Total Variance Explained
Component
Initial Eigenvalues | Extraction Sums of Squared Loadings | |||||
Total | % of Variance | cumulative % | Total | % of Variance | cumulative % | |
1 | 3,087 | 61,747 | 61,747 | 3,087 | 61,747 | 61,747 |
2 | ,904 | 18,089 | 79,837 | |||
3 | ,429 | 8,585 | 88,422 | |||
4 | ,359 | 7,170 | 95,592 | |||
5 | ,220 | 4,408 | 100,000 | |||
Maybe you are interested!
-
 Exploratory Factor Analysis (EFA) Results for Factors Affecting Customer Satisfaction
 -
 Exploratory Factor Analysis Efa For Independent Variables
 -
 Checking the Reliability of the Factor Scale Before Conducting Exploratory Factor Analysis Efa
 -
 Exploratory Factor Analysis Results for Independent Variables
 -
 Reconstructed Hypotheses After Exploratory Factor Analysis
Extraction Method: Principal Component Analysis.
Component Matrix a
Component | |
1 | |
R2 | ,870 |
R3 | ,840 |
R4 | ,812 |
R1 | ,784 |
R5 | ,593 |
Extraction Method: Principal Component Analysis.
a. 1 components extracted.
The results of KMO and Bartlett's Test show that the KMO coefficient = 0.785 is in the range of 0.5 to 1, so factor analysis is acceptable for the research set. The sig. coefficient < 0.05 means that factor analysis is appropriate. The Eigenvalue of the first factor (3.087) > 1 shows that this factor has the best information summary meaning. The total variance extracted = 61.747 ≥ 50% shows that the EFA model is appropriate. Thus, 1 extracted factor condenses 61.747% of the variation of observed variables. No variables were eliminated when testing EFA for the dependent variable. Because only 1 factor was filtered, the rotation matrix was not applied.
After finishing EFA analysis with excluding inappropriate variables, only 1 group of factors affecting digital satisfaction was summarized as follows:
Table 4.2.3.2.2. Summary table of EFA exploratory factor analysis results
Symbol
before
The following symbol | Question | Form variable | |
CA1 | C | The content of the services and products of HKGR brands that you see on the mobile application with wifi/4G connection is very suitable and accurate. | Independence |
CA2 | The steps to order services and products of HKGR brands that you see on the mobile device application with wifi/4G connection are arranged in order. accurate | ||
CA3 | The services and products of HKGR brands that you see on the mobile application with wifi/4G connection have a quick link to HKGR's customer service. | Independence | |
CA4 | The speed of information processing on mobile applications with wifi/4G connection is very efficient. | ||
CB1 | Ordering products & services of HKGR brands on mobile device applications with wifi/4G connection is very simple during the operation process. | ||
CB2 | Transaction of products & services of HKGR brands on mobile application with wifi/4G connection is very fast fast & efficient | ||
CB3 | The interface of advertising products & services of HKGR brands on mobile applications with wifi/4G connection is very user-friendly. | ||
CB4 | HKGR application on device | Independence |
Mobile phones with wifi/4G connection can accurately locate the current location of passengers. | |||
CC1 | You can freely and proactively choose products & services of HKGR brands on the mobile application with wifi/4G connection. | ||
CC2 | You choose products & services of HKGR brands on the application of mobile devices with wifi/4G connection accurately and quickly. | ||
CD1 | You feel safe and confident when ordering products and services of HKGR brands via mobile device applications with wifi/4G connection | ||
CD3 | Do you feel safe paying by card for HKGR products and services via mobile device applications? mobile with wifi/4G connection | ||
R1 | R | Using mobile devices with wifi/4G connection to book services and products of HKGR airlines saves a lot of time. | Dependent |
R2 | Using mobile devices with wifi/4G connection to book services and products of HKGR brands is very convenient at any location. | ||
R3 | Use mobile devices connected to wifi/4G to order services and products of HKGR companies regardless of transaction time. | ||
R4 | Use mobile device connected to wifi/4G in accessing service information and |
HKGR products are very timely and fast. | ||
R5 | Using mobile devices connected to wifi/4G to reflect customer care information of HKGR airlines is very convenient. |
After the second EFA analysis, the number of dependent variables includes 12 factors, forming a single group reflecting the impact of the 4.0 travel application (utility) on customer satisfaction. To simplify the process of using SPSS to analyze the correlation between independent variables and dependent variables, surrogate variables are created using the Mean function in SPSS. Therefore, the new research model and newly formed hypothesis are as follows:
Hypothesis (H): There is a positive relationship between the utility of the Travel 4.0 application and the digital satisfaction of customers using HKGR services in Vietnam.
H: has a positive relationship
BENEFITS OF TRAVEL APPLICATION 4.0 (C)
PASSENGER SATISFACTION (R)
4.2.4. Pearson correlation
Table 4.2.4. Pearson correlation analysis results
Correlations
C | R | ||
C | Pearson Correlation | 1 | ,764 ** |
Sig. (2-tailed) | ,000 | ||
N | 392 | 392 | |
R | Pearson Correlation | ,764 ** | 1 |
Sig. (2-tailed) | ,000 | ||
N | 392 | 392 |
**. Correlation is significant at the 0.01 level (2-tailed).
The Pearson correlation coefficient of the independent variables [C] with the dependent variable [R] is less than 0.05. Thus, there is a linear relationship between these independent variables and the dependent variable.
The correlation coefficients between independent variables are all greater than 0.4, so multicollinearity may occur between variables.
4.2.5. Hypothesis Testing (Regression Analysis)
Table 4.2.5. Regression analysis results
Model Summary b
Model
R | R Square | Adjusted R Square | Std. Error of the Estimate | Durbin-Watson | |
1 | , 764a | ,583 | ,582 | ,53459 | 1,942 |
a. Predictors: (Constant), C
b. Dependent Variable: R
ANOVA a
Model
Sum of Squares | df | Mean Square | F | Sig. | ||
1 | Regression | 155,839 | 1 | 155,839 | 545,293 | ,000 b |
Residual | 111,458 | 390 | ,286 | |||
Total | 267,296 | 391 |
a. Dependent Variable: R - b. Predictors: (Constant), C
Coefficients a
Model
Unstandardized Coefficients | Standardized Coefficients | t | Sig. | Collinearity Statistics | ||||
B | Std. Error | Beta | Tolerance | VIF | ||||
1 | (Constant) | ,246 | ,157 | ,764 | 1,569 | ,117 | 1,000 | 1,000 |
C | ,959 | ,041 | 23,352 | ,000 | ||||
a. Dependent Variable: R
The adjusted R2 value of 0.582 shows that the independent variable introduced into the regression affects 58.2% of the change in the dependent variable, the remaining 41.8% is due to variables outside the model and random errors. The Durbin-Watson coefficient = 1.942, is in the range of 1.5 to 2.5, so there is no first-order serial autocorrelation. The F test Sig is 0.00 < 0.05, thus, the multiple linear regression model fits the data set and can be used.
The t-test regression coefficient of the independent variables C is less than 0.05, so this independent variable is meaningful in explaining the dependent variable.
VIF coefficient < 2, so multicollinearity does not occur.
The regression coefficient is greater than 0, so the independent variable included in the regression analysis has a positive impact on the dependent variable.
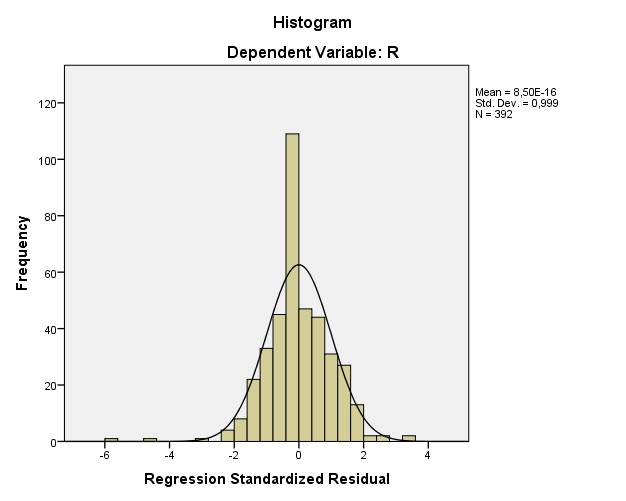
Figure 4.2.5.1. Hypothetical distribution chart
The mean value Mean = 8.50E-16 is close to 0, the standard deviation is 0.999 close to 1, so it can be said that the residual distribution is approximately normal. Therefore, it can be concluded that: The assumption of normal distribution of the residual is not violated.
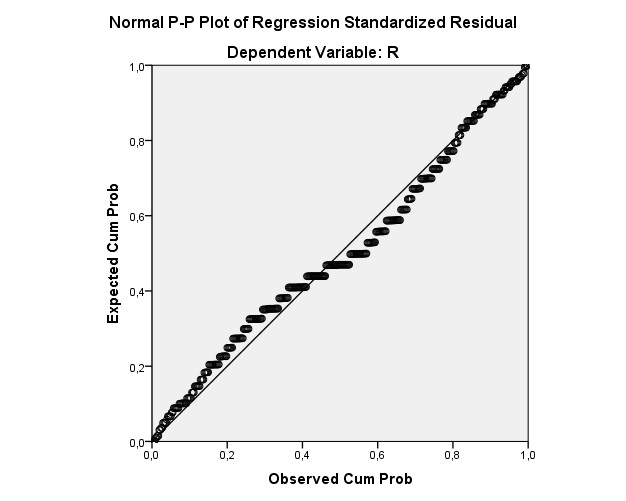
Figure 4.2.5.2. PP Plot chart
The quantiles in the residual distribution are concentrated on one diagonal, thus the assumption of normal distribution of the residuals is not violated.
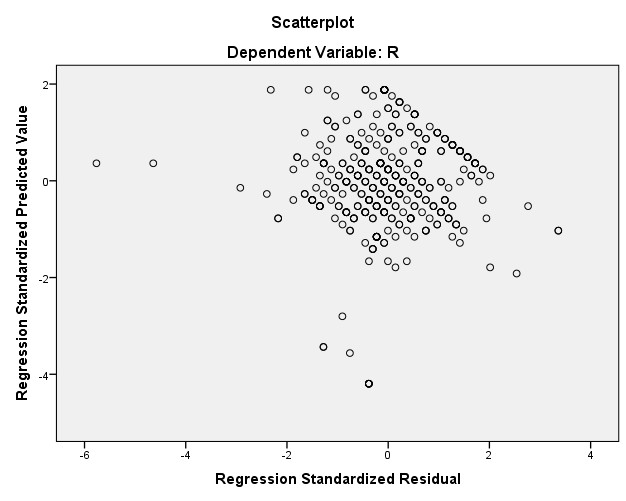
Figure 4.2.5.3. Scatterplot result chart
The standardized residuals are concentrated around the zero-coordinate line, so the linear relationship assumption is not violated.
Thus, after regression analysis with the newly proposed hypothesis, the hypothesis has a positive impact on the digital satisfaction of customers using the 4.0 travel application of HKGR airlines in Vietnam, or it can be proven that all variables are significant in the regression model.
The new hypothesis (H) represents the elements of the original four hypotheses, so it can be seen that “convenience”, “accessibility”, “personalization” as well as “security and privacy” all play important roles in influencing the formation of digital customer satisfaction. This is consistent with previous studies.