equivalent. However, when analyzing the number of outpatient visits between the two groups, there was a clear difference (Figure 5.1)
With the number of outpatient medical examinations less than 06 times, the number of people in the group not using health insurance cards is higher than the group using health insurance cards; with the number of outpatient medical examinations from 06-07 times in the 2 groups is quite similar, however, the gap between the 02 groups is more obvious. The majority of people who have 11 or more outpatient medical examinations are in the group using health insurance cards and according to table 5.3, the average number of outpatient medical examinations of the group using cards is 4.14 times (higher than the total average number of outpatient medical examinations of 3.68 times), showing that there are signs of moral hazard in outpatient medical examinations when people using health insurance cards have more outpatient medical examinations than people who do not use health insurance cards.
For inpatient medical examination and treatment, we see that the group using health insurance cards for inpatient treatment is more, however, there is almost no abuse when the number of people receiving medical examination and treatment more than 5 times is 37 people/2,171 inpatient medical examination and treatment, accounting for a very small percentage of only 1.7%, so it can be considered that there is no ethical risk in inpatient medical examination and treatment (Figure 5.2).
1200 people
1000
800
600
400
do not use health insurance card
using health insurance card
200
0
1 time 2 3 4 5 6 7 8 10 12
time
Figure 5.2 Comparison of average number of inpatient medical examinations
Source: Author's calculations from VHLSS 2012
When analyzing in detail by type of health insurance card used (Table 5.5), we see that the free and voluntary health insurance groups have the largest number of people using medical examination and treatment. For voluntary health insurance, part of the reason may come from adverse selection, but for free health insurance with the cost benefit when treating is 100%, the number of people using medical services in this group is much higher than in other groups.
Continuing to consider the average number of medical examinations, we see that the highest average number of outpatient medical examinations belongs to the group using voluntary health insurance (5.18 times), the groups using other types of health insurance also have a higher average number of outpatient medical examinations (near-poor households, free) or relatively equal to those who do not use cards (students, compulsory). For inpatient medical examinations, the average number of inpatient medical examinations between groups is not much different from the group not using cards, especially the student health insurance group has an average number of inpatient medical examinations lower than the group not using health insurance cards. From this data, we can conclude that moral hazard may exist in outpatient medical examinations but may not exist in inpatient medical examinations.
Table 5.5 Average number of medical examinations by type of health insurance card
Type of health insurance used
Outpatient treatment | Inpatient treatment | |||
number | average number of medical examinations | number | average number of medical examinations | |
Health Insurance for Near Poor Households | 139 | 4.12 | 27 | 1.48 |
Student Health Insurance | 81 | 3.24 | 32 | 1.09 |
Compulsory Health Insurance | 994 | 3.24 | 293 | 1.38 |
Free Health Insurance | 2,031 | 4.03 | 645 | 1.58 |
Voluntary Health Insurance | 1,143 | 5.18 | 346 | 1.40 |
Add | 4,388 | 4.14 | 1,343 | 1.47 |
Do not use health insurance | 4,798 | 3.26 | 828 | 1.34 |
Total | 9,186 | 3.68 | 2,171 | 1.42 |
Maybe you are interested!
-

 Comparison of Distribution by Number of Cesarean Sections Between Studies
 -
 Comparison of Total Number of Cases and Total Number of Defendants Brought to Trial by the Court Regarding Articles 289, 290 and 291 of the Penal Code During a 5-Year Period (2008 - 2012)
 -
 Comparison of Number of Cases and Values to be Executed Between Two District-Level Judgment Enforcement Units in 2014 and 2015
 -
 Education and health promotion - 4
 -
 Number of Accommodation Establishments in the Country and the Central Region Through the Years 2011 - 2012
Source: Author's calculations from VHLSS 2012
250
200
150
100
50
0
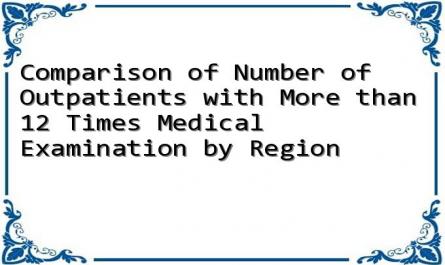
When considering regional characteristics, we see that the number of people who seek outpatient medical care more than 12 times is highest in region 6, meaning that ethical risk behavior in outpatient medical care is most concentrated in region 6. However, when considering only those without health insurance, we see that the number of times of medical care of people without health insurance cards in region 6 is also higher than in other regions. Therefore, the reason may also come from the climate and living environment as explained by Jowett (2001).
Region 1 | Region 2 | Region 3 | Region 4 | Region 5 | Region 6 | |
No card | 10 | 1 | 13 | 5 | 24 | 70 |
Have health insurance card | 43 | 21 | 60 | 15 | 71 | 201 |
Figure 5.3 Comparison of the number of people receiving outpatient medical care more than 12 times by region
Source: Author's calculations from VHLSS 2012
Note: Region 1- Red River Delta, Region 2- Northern Midlands and Mountains, Region 3- North Central and Central Coast, Region 4- Central Highlands, Region 5- Southeast, Region 6- Mekong River Delta.
5.2 Regression results
5.2.1 Logit regression model testing backward selection
Table 5.6 Results of regression testing for backward selection
Health insurance
Coefficient | Standard error | Marginal impact | Standard error of the boundary effect | |
SKTot (d) | -0.998*** | 0.051 | -0.141*** | 0.008 |
SKKem (d) | 0.570*** | 0.088 | 0.088*** | 0.016 |
Age | 0.032*** | 0.002 | 0.004*** | 0 |
GTNam (d) | -0.225*** | 0.05 | -0.029*** | 0.006 |
University (d) | 0.949*** | 0.168 | 0.164*** | 0.036 |
Bangnghe (d) | 1,027*** | 0.2 | 0.181*** | 0.044 |
High School (d) | 0.702*** | 0.074 | 0.107*** | 0.013 |
Secondary School (d) | 0.262*** | 0.06 | 0.035*** | 0.008 |
ChuaKH (d) | -0.228* | 0.098 | -0.028* | 0.011 |
NhaLD (d) | 0.203 | 0.49 | 0.028 | 0.073 |
GiaosuKysu (d) | 0.335* | 0.169 | 0.049 | 0.027 |
Office of Public Service (d) | 0.001 | 0.073 | 0 | 0.01 |
Industry(d) | -0.065 | 0.071 | -0.008 | 0.009 |
LDgiandon (d) | 0.196 | 0.12 | 0.027 | 0.018 |
Huutri (d) | 0.288** | 0.104 | 0.041* | 0.016 |
thatnghiep(d) | 0.267** | 0.097 | 0.038* | 0.015 |
study (d) | 0.421* | 0.208 | 0.063 | 0.035 |
intrest | 0.485*** | 0.04 | 0.063*** | 0.005 |
DTKinh (d) | 0.818*** | 0.152 | 0.083*** | 0.011 |
DTHoa (d) | 0.577* | 0.28 | 0.09 | 0.051 |
Thanhthi (d) | 0.365*** | 0.055 | 0.050*** | 0.008 |
tsnguoiHoGD | 0.041** | 0.015 | 0.005** | 0.002 |
Region 1 (d) | -0.374*** | 0.074 | -0.045*** | 0.008 |
Area 2 (d) | 0.202* | 0.094 | 0.028* | 0.014 |
Region 3 (d) | 0.165* | 0.067 | 0.022* | 0.009 |
Region 4 (d) | -0.885*** | 0.126 | -0.088*** | 0.009 |
Area 5 (d) | -0.435*** | 0.08 | -0.051*** | 0.008 |
_cons | -7.152*** | 0.354 | ||
N=13,691 | ||||
* p<0.05, ** p<0.01, *** p<0.001 | ||||
The model only explains 14.08% of the dependent variable, however, with the P-value of R 2 <0.05, the model is considered suitable (Appendix 2.1)
To conclude, the study conducted a number of tests (Appendix 2.2) . First, the explanatory level of the model was tested, the Correctly Classified result reached 81.73%, so the model can be considered suitable for explanation.
Next, the suitability test of the logit model was performed, with Prob>chi2=0.83> significance level 0.05, so it can be concluded that the model is suitable. The study continued to check for multicollinearity between variables by calculating the variance inflation factor VIF. The results showed that the VIF of all variables were less than 10, so it can be concluded that multicollinearity is not serious. Therefore, the regression results can be used to draw conclusions. However, due to the presence of heteroscedasticity, the author reran the logit regression with the robust option and calculated the marginal effects (Appendix 2.3) , the results are presented in Table 5.6.
The significant variables in the model include: SKTot, SKKem, Tuoi, GTNam, Daihoc, Bangnghe, THPT, THCS, ChuaKH, Huutri, Thatnghiep, lnthunhap, DTKinh, Thanhthi, tsnguoiHoGĐ, Vung1, Vung2, Vung3, Vung4, Vung5.
Conclusion on the existence of adverse selection
Holding other factors constant, people with Good health have a 0.141 lower probability of purchasing health insurance than people with Average health, and people with Poor health have a 0.088 higher probability of purchasing health insurance than people with Average health. In addition, for every 1 year increase in age, the probability of purchasing health insurance increases by 0.004.
The study concluded that adverse selection exists in Vietnam's voluntary health insurance program because people with poor health have a higher probability of purchasing health insurance than people with good and average health, similar to the conclusions of Jowett (2001), Ngai and Hong (2012) and consistent with the theory that adverse selection exists whenever individuals are free to choose whether to buy or not to buy (Akerlof, 1970).
Analyze other control variables in the model.
Gender also affects the decision to buy health insurance when men have a lower probability of buying health insurance by 0.029 than women under the condition that other factors are constant. This result is different from the study of Jowett (2001), Wang et al (2006) when Jowett (2001) said that women hear less information about health insurance than men, but he did not find a difference in gender in the decision to buy health insurance and Hong Wang et al (2006) also did not find the impact of gender in registering to buy health insurance. Here, the author tends to explain that people who are afraid of risks are more likely to buy insurance and women are often more afraid of risks than men (Adhikari and O'Leary, 2008). This conclusion is also consistent with Tomislav and Danijel (2008), Ngai and Hong (2012).
Similar to the explanation of gender differences in the probability of purchasing health insurance, the author argues that unmarried people have a lower probability of purchasing health insurance by 0.028 compared to married people because they are less afraid of risks, have less responsibility, and have less anxiety about the future, so they buy less health insurance. This result is consistent with the studies of Wang et al (2006), Tomislav and Danijel (2008), Ha and Leung (2010).
Next are the variables on education level. The study shows that education level is as important as health in deciding to buy health insurance when the level of impact on the probability of buying health insurance is quite high. People with higher education level are more likely to buy health insurance. Specifically, with the condition that other factors remain unchanged, people with university degrees, vocational degrees (equivalent to college level) increase the probability of buying health insurance by 0.164 and 0.181 compared to people with lower secondary education. Meanwhile, people with high school and secondary education degrees increase the probability of buying health insurance by 0.107 and 0.035. This result is consistent with the study of Kefeli and Jones (2012) and can be explained by the fact that people with higher education often have better awareness of the benefits of health insurance. However, Jowett (2001), Tomislav and Danijel (2008), Ngai and Hong (2012) did not find any impact of education on the purchase of health insurance. This could be explained by the difference in data.
Jowett (2001), Ngãi and Hồng (2012) conducted research on survey data in Dong Thap, Ninh Binh, Hai Phong and Tomislav and Danijel (2008) conducted research in Croatia. It is possible that in these places, health insurance is developed, the dissemination and propaganda of health insurance benefits are good, so there is no difference in awareness of health insurance among people with different educational levels. However, this is only the author's inference, more detailed research is needed to explain this difference.
Retirees increased the probability of purchasing health insurance by 0.041 compared to those working in agriculture, all other factors remaining constant, and similarly, unemployed people increased the probability of purchasing health insurance by 0.038. The remaining occupational variables were not significant, indicating that occupation did not affect the decision to purchase health insurance. Tomislav and Danijel (2008), Ngai and Hong (2012) had similar conclusions, while Jowett (2001) and Kefeli and Jones (2012) found that some occupations had an impact on the probability of purchasing health insurance. The author sought to explain why retired and unemployed people were more likely to purchase health insurance than employed people through the observation of Baker and Jha (2012) that people are more likely to purchase health insurance when they think they can use it and need to use it. The author follows this direction when he believes that with the inconvenience of procedures and waiting time for health care using health insurance, retired and unemployed people seem to have more favorable conditions in terms of time for health care using health insurance than people in other professions, so they have a higher probability of purchasing.
The variables income, urban, Kinh ethnicity, and total household size are all significant and have a positive impact on the probability of purchasing health insurance. This result is supported by the research results of Tomislav and Danijel (2008), Kefeli and Jones (2012) - income increases the probability of purchasing health insurance; Jowett (2001) - rural people have a lower probability of purchasing health insurance; Wang et al (2006) - total household size increases the probability of purchasing health insurance; Ha and Leung (2010) - Kinh people have a higher probability of purchasing health insurance. These results can be explained as follows:
Income increases the probability of purchasing voluntary health insurance because the ability to purchase health insurance of high-income people increases compared to low-income people, showing that the level of
Health insurance premiums are always a matter of consideration. This is also consistent with the fact that the total number of people in the household has a positive impact on the purchase of health insurance because the premium is reduced from the next member in the household. Specifically: the 2nd, 3rd, 4th person pays 90%, 80%, 70% respectively and from the 5th person onwards it is 60% of the premium as prescribed by the first person in the household. (Decree 62/2009, Article 3, Clause 6).
The positive impact of urban and Kinh ethnicity variables is explained by the author in terms of access to health services and access to information. The economic, cultural and social life of urban and Kinh people is more developed than that of rural and ethnic minorities, with more favorable conditions for obtaining information, leading to better awareness of health insurance as well as much more convenience in medical examination and treatment due to the closer distance to medical facilities.
For the variables on Region, all are significant but have different signs of impact. The results show that Region 1, Region 4 and Region 5 have a lower probability of purchasing health insurance by 0.045; 0.088 and 0.051 compared to Region 6, while Region 2 and Region 3 will increase the probability of purchasing health insurance by 0.028 and 0.022. This conclusion is quite consistent with the results of Jowett (2001) when he also found that people from Ninh Binh and Hai Phong provinces (in Region
1) will have a lower probability of buying health insurance than Dong Thap province (in region 6).
According to Table 5.3, region 2 (Northern Midlands and Mountains) and region 3 (North Central and Central Coast) have the lowest average income/person/month compared to the remaining regions. However, the probability of purchasing health insurance in these two regions is higher than in the remaining regions, possibly because these regions receive large budget support for policy beneficiaries such as the poor, near-poor and ethnic minorities . 11 The author believes that the remaining beneficiaries who are not supported by health insurance in regions 2 and 3 also have better awareness of the benefits of health insurance from the community with many people owning health insurance.
11. According to the report of the Standing Committee of the National Assembly (2013), the Northern Midlands and Mountains provinces have achieved nearly 100% of the population participating in health insurance due to budget support for purchasing health insurance for the poor, near-poor and ethnic minorities.