The Nikkei index traded at the option price. Most of the call and put prices Leeson sold ranged from 18,500 to 20,000. But the Kobe earthquake on January 17, 1995, caused the Nikkei stock index to fall below the price Leeson sold. Because of the drop in prices, the call options had no exercise value while the put options had great exercise value. When the Nikkei stock index fell to 17,950 on January 23, 1995, Leeson realized his mistake in selling the put options. At this time, Leeson wanted to reverse the situation in the Japanese stock market, so he bought a large amount of futures contracts in the hope of stabilizing the price and avoiding unnecessary losses on the option transactions he had made. Specifically, on January 27, 1995, account 88888 showed a position of 27,158 futures contracts for delivery in March. Three weeks later, around February 22, 1995, Leeson doubled this position to 55,206 futures contracts for delivery in March and 5,640 futures contracts for delivery in June. However, the market continued to decline, causing BFS and even the Barings group to suffer heavy losses leading to insolvency. The huge losses caused the London High Court to declare Barings bankrupt and place the bank under the control of Earnst & Young on the night of February 26-27, 1995. During his two and a half years at Barings (July 1, 1992 to February 27, 1995), Leeson led the bank to collapse with a loss of GBP 827 million, and by the time it was formally liquidated, the loss was GBP 927 million.
1.5.2.2 Impact of the collapse
Richard J (2005) said that after being placed under control on 27 February, on 6 March 1995, ING (International Nederlanden Group) announced that they would take over Barings for 660 million GBP. On 3 April 1995, both the chairman and vice chairman of Barings resigned. The Bank of England also suffered serious losses, with the head of the inspection and supervision department having to leave before the report of the banking inspection board was published. At the same time, the Bank of England
The UK government must restructure the entire banking inspection and supervision department to make it more effective.
1.5.2.3 Causes of collapse from the perspective of derivative product risk
Firstly, the weakness in internal control over the control of open foreign exchange position risks from speculation. This weakness is shown in the following: Barings' managers did not take any action when recognizing signs of dangerous risks from BFS's business activities: SIMEX's notice letters on September 7, 1993, January 11, 1995, January 27, 1995 and February 10, 1995 as well as phone calls from the Bank for International Settlements, Bloomberg (January 27, 1995) ... about BFS's risk status. In October 1993, the BSL (Barings Securities Ltd) risk monitoring committee was established but operated ineffectively due to lack of information and control experience. In late 1994, Barings had global projects to control the risky volatility of financial instruments, in which the allocation of risk managers for each region was an important first step. However, because BFS's activities focused on arbitrage, there was no risk manager in Singapore. Second, the weakness in supervising the activities of derivatives trading staff. Although Nick Leeson did not have any business license before going to Singapore, the head office in London did not assign any individual to be responsible for supervising his business activities in Singapore. Third, it was the weakness in management, control and inspection from the Bank of England as well as the auditing companies. They did not uncover any serious problems with Barings or BFS, including the bank's internal audit system (BFS was audited by Deloiite&Touche in 1992-1993 and Coopers & Lybrand in 1994).
1.5.2.4 Lessons learned for Vietnam
The collapse of Barings Bank is a typical lesson for Vietnamese commercial banks when providing derivative products. Schinasi (1998) argues that in the customer market, in addition to providing derivative products to serve their customers,
It is also necessary to find counter-transactions to insure the safe status. Compliance with regulations on controlling open position risk for Vietnamese banks is very important for sustainable development. Therefore, commercial banks must strictly comply with regulations on the total end-of-day position of banks and maintain the total value of option contracts without counter-transactions at the maximum prescribed level. Currently, Vietnam has not developed the futures market, the activities of this market are highly leveraged: profits can be very high but losses can be unpredictable. The collapse of Barings Bank also reminds Vietnamese banks that the development of safe derivative products requires a strict internal monitoring system, within the scope of responsibility and role of employee performance management.
CONCLUSION OF CHAPTER 1
Chapter 1 presents the theoretical basis of commodities, commodity derivatives, conditions for the development of commodity derivatives trading and some lessons learned. The theoretical part of commodities has shown the characteristics and differences between non-financial commodities and financial commodities. A prominent feature in commodity trading is the risk of price fluctuations, which requires the market to have tools to control this risk. The next part of chapter one presents commodity derivatives products: forwards, options and futures; the non-financial commodity derivatives trading system; analysis to see the characteristics and differences of each commodity derivative instrument; the increased benefits and increased risks when trading commodity derivatives. Next, chapter 1 presents the conditions for the development of non-financial commodity derivatives trading: commodity conditions, legal basis conditions, economic-financial conditions and technical conditions. These are important conditions that need to be surveyed to see the current status of conditions for the development of commodity derivatives trading in Vietnam, as well as solutions that need to be aimed at to improve the above conditions in order to develop commodity derivatives activities sustainably. Chapter 1 also briefly introduces the two exchanges LIFFE and NYBOT and lessons learned from Brazil. These are very important lessons, although the characteristics of cultivation, production and market in Brazil are not completely suitable for Vietnam, this is a very successful commodity derivatives market, worthy of being studied and learning lessons. An overview of the issues just presented will be the basis for analyzing the current status of non-financial commodity derivatives trading in Vietnam and proposing appropriate solutions to develop this activity in Vietnam.
CHAPTER 2
CURRENT STATE OF NON-FINANCIAL COMMODITY DERIVATIVES TRADING IN VIETNAM
INTRODUCTION TO CHAPTER 2
Chapter 2 presents the current situation of non-financial commodity derivatives trading in Vietnam. In particular, the conditions affecting the development of non-financial commodity derivatives trading in Vietnam are specifically analyzed, including commodity conditions, legal basis, economic and financial conditions and technical conditions. Part two of this chapter delves into the analysis to highlight the current situation of non-financial commodity derivatives trading in Vietnam. Specifically, the objective of this part is to introduce and analyze the operation of commodity derivatives exchanges in Vietnam. In addition, the results of three surveys including product demand survey, supplier survey and expert survey are presented specifically. From the current situation of the market and the survey results, the content of chapter two is continued by applying the SWOT model to evaluate non-financial commodity derivatives trading in Vietnam, thereby presenting the main reasons why the development of the market is still limited.
2.1 OVERVIEW OF MAIN CONDITIONS FOR DEVELOPING NON-FINANCIAL COMMODITY DERIVATIVES TRADING IN VIETNAM
2.1.1 Conditions of goods
Vietnam is a country with strengths in agriculture, so Vietnamese agricultural products occupy a certain position in the world agricultural product market. Export products with a turnover of more than 1 billion USD per year include seafood, rice, coffee, and cashews. Products with a large market share in the world include cashews (51.63%), pepper (22.8%), rice (19.7%), coffee (11%), etc. In terms of export position, for many consecutive years, Vietnam has ranked 1st in the world for pepper and cashews, 2nd in the world for coffee and rice, and 4th in the world for rubber.
Table 2.1 Position of Vietnamese goods in the world in 2013
Item
Annual export turnover 2013 (000 USD) | Market share in the world world 2013 (%) | Location of output 2013 export | |
Coffee | 3,672,823 | 11 | 2 |
Pepper | 791,400 | 22.8 | 1 |
Thing | 1,470,342 | 51.63 | 1 |
Tea | 224,589 | 3.55 | 10 |
Rice | 3,673,000 | 19.7 | 2 |
Rubber | 2,859,837 | 4.1 | 4 |
Seafood | 6,088,507 | 4.4 | 5 |
Maybe you are interested!
-
 Some solutions to limit risks in international goods trading activities of Vietnamese traders - 10
 -
 The Preposition “Auf” Viewed From a Cognitive Perspective Compared with Vietnamese
 -
 Factors Affecting Business Performance of Meiko Trading and Construction Company Limited
 -
 Research on factors affecting the decision to purchase gypsum board of Huy An private trading enterprise from institutional customers in Ho Chi Minh City - 13
 -
 Che Lan Vien's political poetry from the perspective of artistic thinking - 1
Source: General Department of Vietnam Customs, 2014
The export turnover of these key products of Vietnam has continuously increased over the years. This achievement is the result of a series of solutions from seedlings, cultivation methods, ensuring cultivation area, and promoting trade promotion.
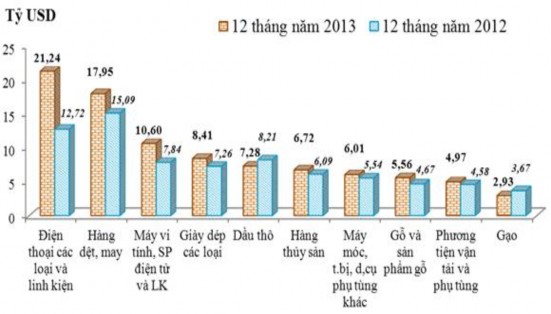
Source: General Department of Vietnam Customs, 2014
Chart 2.1: Export value of 10 largest commodity groups in 2013 compared to 2012
Some of the above mentioned goods are also among the 10 groups of goods with the largest export value in 12 months of 2013 compared to 12 months of 2012. The following will be an overview of 3 strong products of Vietnam including rice, coffee and rubber.
2.1.1.1 Rice
In terms of output and export value: rice has been Vietnam's strength for many years. In 2013, Vietnam ranked second in the world in rice exports. Vietnam's rice output has increased gradually over the years and in the last 3 years, the annual output has reached about 40 million tons. Vietnam has a stable rice cultivation area, diverse rice varieties with nearly 30 popular and increasingly improved rice varieties, and increasingly developed farming techniques.
Million tons
45
40
35
30
25
20
15
10
5
0
1990 1995 2000 2005 2010 2011 2012 2013 2014
(Estimated)
Source: Mekong Delta Rice Research Institute (2014)
Chart 2.2: Vietnam's rice output in the period 1990 - 2014
Over the past 10 years, Vietnam's rice export output has increased sharply, from 1.37 million tons in 1989 to 7.72 million tons in 2013, an increase of more than 5 times. From 2009 to 2013, the annual rice export output was very stable. Vietnam's rice export forecast for the 2013/14 crop season is expected to decrease to 7.4 million tons, due to competitive pressure.
competition from India and Thailand as well as declining demand in some traditional markets such as the Philippines and Indonesia.
Million tons
8
7
6
5
4
3
2
1
0
1989 1990 1995 2000 2005 2009 2010 2011 2012 2013 2014
(Estimated)
Source: Mekong Delta Rice Research Institute (2014)
Chart 2.3: Vietnam's rice export output 1989-2014
Million USD
4000
3500
3000
2500
2000
1500
1000
500
0
1989 1990 1995 2000 2005 2009 2010 2011 2012 2013 2014
(Estimated)
The total value of Vietnam's rice exports has also increased gradually over the years, reaching nearly 3 billion USD in 2010, and over 3 billion USD in 2011, 2012, and 2013.
Source: Mekong Delta Rice Research Institute (2014)
Chart 2.4: Total rice export value of Vietnam 1989-2014