LIST OF ENGLISH - VIETNAMESE TRANSLATION TABLES
ENGLISH
VIETNAMESE | |
Alkaline Phosphatase | Alkaline phosphatase |
Body Mass Index | Body mass index |
Bone Mineral Density | |
Bone specific Alkaline Phosphatase | Bone specific alkaline phosphatase |
Chemiluminescence Immunoassay | Chemiluminescence immunoassay |
Dual – Photon Absortiometry | Dual Photon Energy Absorption |
Dual-energy X-ray Absorbiometry | Dual energy X-ray absorptiometry |
Fibroblast Growth Factor | Fibroblast growth factor |
Growth Hormone | Growth hormone |
Maximum | Maximum value |
Minimum | Minimum value |
Parathyroid Hormone | Parathyroid hormone |
Standard Deviation | Standard deviation |
Single Photon Absortiometry | Single photon energy absorption |
Single-energy X-ray Absorbiometry | Single energy X-ray absorptiometry |
Triiodothyronine | T3 hormone |
Thyroxine | Thyroid hormones |
Tumor Necrosis Factor | Tissue necrosis factor |
Thyroid Stimulating Hormone | Thyroid stimulating hormone |
World Health Organization | World Health Organization |
Maybe you are interested!
-
 Assessment of bone density and changes in bone metabolism markers osteocalcin, s-CTx in hyperthyroid patients - 1
 -
 Bone Density Characteristics of Study Subjects
 -
 Studies on Mthfr Rs1801133 Correlation with Bone Density
 -
 Evaluation of the treatment results of Schatzker type V-VI tibial plateau fractures by combining minimal bone fusion and external ring fixation under fluoroscopy - 13
 -
 Anterior and Posterior Shoulder X-Ray in Large Tear Shows the Head of the Humerus Close to the Underside of the Mcv Bone.
LIST OF TABLES
Table 3.1. Characteristics of age, height, weight and BMI of research subjects...43 Table 3.2. Gender and age group distribution of research subjects 43
Table 3.3. Distribution of study variables before treatment 44
Table 3.4. Changes in hormone concentrations over 12 months of treatment 46
Table 3.5. Treatment effectiveness of hyperthyroidism based on FT4 values within the normal range according to reference values 47
Table 3.6. Percentage of patients with bone damage before treatment 49
Table 3.7. Percentage of patients with increased and restored bone density 49
Table 3.8. Rate of osteoporosis of the lumbar spine and femoral neck according to the definition of T-score index before and after 12 months of hyperthyroidism treatment 50
Table 3.9. Rate of osteoporosis of the lumbar spine and femoral neck 50
Table 3.10. Changes in bone density of the lumbar spine and femoral neck of the study subjects before and after 12 months of treatment 51
Table 3.11. Testing the difference in the level of change in bone density at the lumbar spine and femoral neck of the study subjects 52
Table 3.12. Comparison of bone density increase at the lumbar spine between osteoporosis subgroups according to T-score and Z-score before and after 12 months of hyperthyroidism treatment 52
Table 3.13. Comparison of bone density increase at the femoral neck between osteoporosis subgroups as defined by T-score and Z-score before and after 12 months of hyperthyroidism treatment 53
Table 3.14. Comparison of bone density increase by age group 54
Table 3.15. Changes in concentrations of bone metabolism markers during hyperthyroidism treatment 55
Table 3.16. Changes in osteocalcin concentrations among groups of subjects with osteoporosis subgrouped according to bone density at the lumbar spine before treatment 56
Table 3.17. Changes in s-CTx concentrations among osteoporosis subgroups according to bone density at the lumbar spine before treatment 57
Table 3.18. Simultaneous correlations of base 10 logarithms of hormones on bone density before and after 12 months of treatment 58
Table 3.19. Correlation between the variation in hormone concentrations and the variation in bone density 60
Table 3.20. Individual correlations between log10 of bone metabolism marker concentrations and bone density 61
Table 3.21. Simultaneous correlation between log10 of bone metabolism marker concentrations and bone density at the lumbar spine 61
Table 3.22. Individual correlations between pretreatment bone density and BMI 62
Table 3.23. Linear regression between Osteocalcin and s-CTx 62
Table 3.24. Multivariate regression testing the simultaneous correlation between hormones and Osteocalcin, s-CTx 63
Table 3.25. Multivariate linear regression analysis testing the simultaneous correlation between hormones and bone metabolism markers 64
LIST OF FIGURES
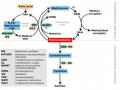
Figure 1.1. Bone turnover 16
Figure 1.2. Markers of bone formation and bone resorption 20
Figure 1.3. Type I collagen consists of two fibers α1 and α2 21
Figure 2.4. Hologic QDR 4500 37 machine
Figure 2.5. Research process 42
Figure 3.6. BMI group distribution before and after treatment of study subjects 45
Figure 3.7. Average change in bone density at the lumbar spine by age group47 Figure 3.8. Average change in bone density at the femoral neck by age group48
Figure 3.9. Regression equation graph showing the correlation between FT3 and spinal BMD, and TSH and thigh BMD in hyperthyroid patients 59
PROBLEM STATEMENT
The relationship between thyroid and bone disease was first noted by Von Reckinghausen in 1891, in a case of a hyperthyroid patient who died with multiple fractures [60]. Over the decades, researchers have seen more clearly the effects of thyroid hormones on bones. In hyperthyroid patients, calcium needs increase by 25%, but intestinal calcium absorption decreases by 66% and furthermore, calcium loss through feces and skin increases by 50-70%. In general, calcium balance is more negative than normal -7.9 mmol/day compared to -2.1 mmol/day, bone resorption rate increases by 170%, bone mineralization rate increases by 140% compared to normal [15].
Studies on the relationship between bone density and hyperthyroidism have all found that hyperthyroidism reduces bone density [82, 84, 107]. A recent study by Udayakumar published in the Singapore Medical Journal in 2006 evaluated the relationship between osteoporosis and hyperthyroidism in 50 patients, showing that the rate of patients with bone density changes was 92% and noted changes in bone density after stable hyperthyroidism treatment [104]. A study by Cliffor conducted in the US on 21 patients including 2 groups of hyperthyroidism (11 cases) and non-hyperthyroidism (10 cases), noted changes in lumbar bone density in the hyperthyroidism group with treatment [84].
According to author Numbenrapon (2011), using CT scan to evaluate the condition of the spine and femoral neck in a group of 15 patients with childhood and puberty hyperthyroidism for 1 and 2 years, recorded bone recovery after treatment [65].
In addition, the role of bone metabolism markers in recent decades has been found to contribute to the assessment of bone turnover activity. Bone metabolism markers include proteins derived from osteoblasts and osteoclasts; and collagens related to the bone matrix.
Osteocalcin is a product of osteoblasts, reflecting the activity of these cells in bone formation during bone turnover [35].
s-CTx is a degradation product of type 1 collagen during bone resorption, reflecting the bone resorption status of bone turnover [87].
In studies of the effects of thyroid hormones on bone, an increase in bone formation and bone resorption mediated by increased osteoblast activity and concomitant bone resorption and degradation of type 1 collagen, the bone matrix, was noted.
A study by author Tsuyoshi Ohishi conducted in Japan in 2007 on 17 hyperthyroid patients noted a correlation between bone metabolism markers such as osteocalcin, s-CTx and thyroid hormones [102].
According to our research results, there are currently few domestic studies on changes in bone density in hyperthyroid patients; besides, we have not found any studies on bone metabolism markers in this group of patients.
In practice, doctors often only pay attention to the treatment of hyperthyroidism and its complications such as cardiovascular disease, eye disease, and drug-induced liver damage. However, little attention is paid to the problem of osteoporosis caused by the disease.
The question is whether there is a relationship between hyperthyroidism and bone status, and how do bones change in hyperthyroidism?
Can this change in bone status during the hyperthyroidism and treatment phase be detected through the evidence of bone formation and bone resorption markers? Faced with the above problem, we conducted this research with the following objectives:
1) Survey of osteoporosis rate in hyperthyroid patients before and after 12 months of treatment.
2) Evaluate changes in bone density at the lumbar spine and femur, changes in osteocalcin and s-CTx concentrations in blood in hyperthyroid patients before and after treatment.
3) Evaluate the relationship between thyroid hormones, osteocalcin, s-CTx with bone density during treatment.
CHAPTER 1 - DOCUMENT OVERVIEW
1.1. Osteoporosis
1.1.1. Epidemiology of osteoporosis
According to the World Health Organization in 2006, more than 200 million people worldwide have osteoporosis [80]. The prevalence of osteoporosis continues to increase with the aging population. Serious complications of osteoporosis include fractures, mortality, and reduced quality of life.
According to the European Osteoporosis Society, the number of osteoporotic fractures was estimated at 3.79 million in 2000 [28]. The first fracture is a very important predictor of subsequent fractures, with approximately 20% of patients with a first fracture reporting a second fracture within the first year. The costs of care are increasing significantly and, at current rates, the incidence of fractures is estimated to double by 2050.
Hip fractures due to osteoporosis are a major health concern in Europe and America, but are also a growing concern in Asia. According to the 2009 Asian Audit Report, with the increase in life expectancy worldwide, the number of older people is increasing in all geographical regions and it is estimated that the incidence of hip fractures will increase from 1.66 million in 1990 to 6 million in 2050 [115]. The incidence of hip fractures is highest in Sweden and North America, approximately seven times higher in southern European countries. The incidence is lower in Asian and American countries. However, since three-quarters of the world's population lives in Asia, it is predicted that Asian countries will account for more hip fractures in the coming years, with estimates that by 2050 more than 50% of all hip fractures due to osteoporosis will occur in Asia [115].
In Korea, Lim et al analyzed the incidence and costs of femoral neck fractures from 2001 to 2004, using retrospective data from the National Health Insurance Agency.