
Correlations
Brand awareness | Brand association | Perceived quality | Loyalty love effect | Brand value | ||
Brand awareness | Pearson Correlation | 1 | 0.621 ** | 0.517 ** | 0.561 ** | 0.590 ** |
Sig. (2-tailed) | 0.000 | 0.000 | 0.000 | 0.000 | ||
N | 236 | 236 | 236 | 236 | 236 | |
Brand association | Pearson Correlation | 0.621 ** | 1 | 0.690 ** | 0.762 ** | 0.721 ** |
Sig. (2-tailed) | 0.000 | 0.000 | 0.000 | 0.000 | ||
N | 236 | 236 | 236 | 236 | 236 | |
Perceived quality | Pearson Correlation | 0.517 ** | 0.690 ** | 1 | 0.780 ** | 0.767 ** |
Sig. (2-tailed) | 0.000 | 0.000 | 0.000 | 0.000 | ||
N | 236 | 236 | 236 | 236 | 236 | |
Brand loyalty | Pearson Correlation | 0.561 ** | 0.762 ** | 0.780 ** | 1 | 0.794 ** |
Sig. (2-tailed) | 0.000 | 0.000 | 0.000 | 0.000 | ||
N | 236 | 236 | 236 | 236 | 236 | |
Brand value | Pearson Correlation | 0.590 ** | 0.721 ** | 0.767 ** | 0.794 ** | 1 |
Sig. (2-tailed) | 0.000 | 0.000 | 0.000 | 0.000 | ||
N | 236 | 236 | 236 | 236 | 236 | |
**. Correlation at 0.01 significance level. | ||||||
**. Correlation at 0.05 significance level. | ||||||
Maybe you are interested!
-
 Preliminary Test of Reliability of Scale in Research Model
 -
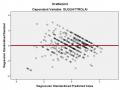 Scatter Plot of Residuals and Predicted Values of Multiple Regression Model
 -
 Regression Model Results of 6 Factors Affecting 8 Listed Joint Stock Companies
 -
 Partial Correlation Test of Regression Coefficients:
 -
 Results of Regression Model Analysis with Two Independent Variables Service and Interbank
(Source: SPSS processing results)
According to the correlation matrix, the correlation coefficient between the dependent variable Brand Equity and the four independent variables Brand Awareness , Brand Association, Perceived Quality and Brand Loyalty are all acceptable, and the Sig. values are all less than 0.05, so all observed variables when included in the analysis are statistically significant. It can be preliminarily concluded that these four independent variables
can be included in the model to explain the dependent variable Brand Value of Agribank.
3.3.2. Multiple regression analysis
The linear regression equation has the following form:
Y = β 1 BAW + β 2 BAS + β 3 PQ + β 4 BL + e i
In there:
Y: Brand value
BAW: Brand awareness BAS: Brand association PQ: Perceived quality
BL: Brand Loyalty
β k : Partial regression coefficient of the kth variable
e i : Error of the regression equation
Evaluate model fit
Table 3.13: Assessment of the suitability of the regression model
Model Summary b
Model | R | R Square | Adjusted R Square | Std. Error of the Estimate | Durbin-Watson |
1 | 0.844a | 0.713 | 0.708 | 0.52511 | 1,533 |
a. Predictors: (Constant), Brand loyalty, Brand awareness, Perceived quality, Brand association | |||||
b. Dependent Variable: Brand value | |||||
(Source: SPSS processing results)
Based on table 3.13, we see that the adjusted R2 is 0.708, meaning that 70.8% of the variation in the Brand Value factor is explained by 4 factors : Brand Loyalty, Brand Awareness, Perceived Quality , Brand Association (including 26 observed variables).
Durbin-Watson coefficient = 1.533 (1≤ Durbin-Watson ≤ 3), so there is no autocorrelation in the model.
Testing the goodness of fit of the regression model (F test)
The F test in analysis of variance is a hypothesis test about the adequacy of the regression model.
Table 3.14: ANOVA test of regression model fit
ANOVA a
Model | Sum of Squares | df | Mean Square | F | Sig. | |
1 | Regression | 158,182 | 4 | 39,545 | 143,417 | 0.000 b |
Residual | 63,695 | 231 | 0.276 | |||
Total | 221,877 | 235 | ||||
a. Dependent Variable: Brand value | ||||||
b. Predictors: (Constant), Brand loyalty, Brand awareness, Perceived quality, Brand association | ||||||
(Source: SPSS processing results)
F-test through analysis of variance aims to test the suitability of the overall model to see if the dependent variable is linearly related to all independent variables. With the hypothesis H 0 is β 1 = β 2 = β 3 = β 4 =0, if the hypothesis H 0 is rejected, it means that the combination of the existing independent variables in the model can explain the change in the dependent variable.
Based on the ANOVA analysis table, the statistical value of the model has a Sig. value less than 0.05, so the hypothesis H0 is rejected . This means that the combination of existing variables in the model can explain the change in the dependent variable or the model is suitable for the data set and can be extrapolated to the entire population.
Table 3.15: Testing correlation coefficients of regression model
Coefficients a
Model | Unstandardized Coefficients | Standardized Coefficients | t | Sig. | Collinearity Statistics | |||
B | Std. Error | Beta | tolerance | VIF | ||||
1 | (Constant) | 0.109 | 0.135 | 0.808 | 0.420 | |||
Brand awareness | 0.128 | 0.043 | 0.135 | 2,940 | 0.004 | 0.592 | 1,688 | |
Brand association | 0.160 | 0.066 | 0.144 | 2,419 | 0.016 | 0.351 | 2,850 | |
Perceived quality | 0.316 | 0.058 | 0.315 | 5,421 | 0.000 | 0.368 | 2,718 | |
Loyalty become a brand | 0.351 | 0.063 | 0.363 | 5,574 | 0.000 | 0.293 | 3,409 | |
a. Dependent Variable: Brand value | ||||||||
(Source: SPSS processing results)
To ensure that the independent variables really have an impact on the dependent variable, we conduct a t-test. With the hypothesis H 0 is the regression coefficient of the independent variables β 1 = β 2 = β 3 = β 4 =0 and with a confidence level of 95%. Based on table 3.15, we have the Sig. value of the 4 factors Brand awareness, Brand association, Perceived quality and Brand loyalty are all less than 0.05, so with a confidence level of 95%, there is enough statistical evidence to reject the hypothesis H 0 , meaning that these 4 independent variables have an impact on the dependent variable Brand value of Agribank .
In addition, to ensure the model is meaningful, we need to conduct further checks for multicollinearity and autocorrelation.
The analysis results in Table 3.15 show that the tolerance of the variables ranges from 0.293 to 0.592, all greater than 0.1 and the variance inflation factor (VIF) is less than 10, indicating that there is no multicollinearity between the independent variables.
Thus, the regression model built ensures suitability, the independent variables can explain well the dependent variable.
 Brand equity with independent variables, including: Brand awareness, Brand association, Perceived quality and Brand loyalty as follows:
Agribank's brand value = 0.135*Brand awareness + 0.144*Brand association + 0.315*Perceived quality +
0.363*Brand Loyalty
 Brand Awareness, Brand Association, Perceived Quality and Brand Loyalty
 Brand value .
Interpretation of meaning : under other conditions remaining constant, if Brand Awareness increases, Agribank's Brand Value also increases. Similarly, if Brand Association, Perceived Quality, Brand Loyalty increase, Agribank's Brand Value also increases.
Importance of variables in the model
Determining the importance (level of influence) of independent variables on dependent variables is based on standardized coefficients Beta. Based on table 3.15, it shows that the Beta coefficients of the variables Brand awareness = 0.135; Brand association = 0.144; Perceived quality = 0.315; Brand loyalty = 0.363 . Thereby, it can be concluded that the variable Brand loyalty has the highest level of influence on Agribank's brand value ; followed by Perceived quality, Brand association and Brand awareness.
From this model, it is possible to propose measures to enhance Agribank brand value based on customers' perceptions of the factors that make up Agribank brand value as in the research model, especially the Brand Loyalty factor as this factor has the greatest impact on Brand Value.
3.4. HYPOTHESIS TESTING
Hypothesis H1

Hypothesis H1 states that Brand Awareness  has a positive impact
  on Agribank's Brand Value. From the regression analysis results in Table 3.15, Beta = + 0.135 (with sig. = 0.004 < 0.05). This means that in this study, Brand Awareness has a positive impact on Brand Value or the higher the level of brand awareness, the more Agribank's Brand Value increases. This is consistent with the initial hypothesis.
Hypothesis H2

Hypothesis H2 states that there is  a positive relationship between
  Brand Association and Brand Value. Based on the results of Table 3.15, this factor has Beta = + 0.144 (with sig. = 0.015 < 0.05) => Brand Association has a positive relationship with Agribank's Brand Value, or in other words, the higher the customer's brand association, the higher the Agribank's Brand Value, so hypothesis H2 is accepted.
Hypothesis H3

Hypothesis H3 states that there is  a positive correlation between
  Perceived Quality and Agribank's Brand Value. Based on the regression results of Table 3.15, Beta = + 0.315 (with sig. = 0.000 < 0.05). This means that Perceived Quality has a positive correlation with Agribank's Brand Value, or in other words, the higher the customer's perception of brand quality, the higher the Agribank's Brand Value, so hypothesis H3 is accepted.
Hypothesis H4

Hypothesis H4 states that there is  a positive correlation
  between Brand Loyalty and Brand Equity of Agribank. Based on the regression results of Table 3.15, Beta = + 0.363 (with sig. = 0.000 < 0.05). This means that Brand Loyalty has a positive correlation with Brand Equity.
Agribank's brand or in other words, the higher the customer's brand loyalty, the higher the Agribank's brand value, so hypothesis H4 is accepted.
Brand association
Brand awareness
Brand value of Agribank
Perceived quality
Brand loyalty
Figure 3.8: Test results of the theoretical model Summary of chapter 3
Chapter 3 introduced some features of Agribank, presented the results of frequency analysis, descriptive analysis, correlation analysis, scale testing, exploratory analysis to test convergent validity and theoretical model and hypotheses.
Statistical analysis shows that the data are suitable for the study. Correlation analysis of the variables mostly has correlation coefficients with the total variable greater than 0.3, meeting the requirements. Cronbach's Alpha coefficients of the variables are all greater than 0.6. Therefore, 27 variables meet the requirements and are included for analysis in the next steps.
The results of the first exploratory factor analysis of independent variables eliminated one variable from the model, which was BAW3 (I can recognize the characteristic color of Agribank). The second exploratory factor analysis did not eliminate any more variables, and the remaining 26 independent variables were extracted into 4 factors.
The results of regression analysis concluded that all four factors affect Brand Value, with statistical significance at the 0.05 level, explaining 70.8% of the variation in the dependent variable: Agribank's Brand Value, which are Brand Awareness, Brand Association, Perceived Quality and Brand Loyalty. After testing, hypotheses H1, H2, H3 and H4 were all accepted.
The next chapter will present the conclusion, suggest some policies to implement to increase the brand value of Agribank, point out the limitations of the topic and suggest future research directions.