2.1.1. Position 48
2.1.2. Objective 48
2.1.3. Basic content of Vietnamese history (10th - 15th century) can and should use infographic 50
2.2. Designing infographics by topic in teaching Vietnamese history (10th century - 15th century) 51
2.2.1. Some requirements when designing infographics in teaching history 51
Maybe you are interested!
-
 Types of Literary Materials That Can Be Used in Teaching Vietnamese History Grade 10 in High Schools
 -
 Using local historical and cultural relics in teaching Vietnamese history at Dong Trieu High School, Quang Ninh Province - 2
 -
 Innovation in using local historical relics in teaching Vietnamese history from 1858 to 1945 at high schools in Thua Thien Hue province - 23
 -
 Using local historical and cultural relics in teaching Vietnamese history at high schools in Thai Nguyen province - 16
 -
 Design and organize teaching of Vietnamese history topics from 1919 to present in the direction of developing the capacity of History major students at Hanoi City High School - 21
2.2.2. Infographic design process in history teaching at high school 52
2.2.3. Design some infographics in teaching Vietnamese history (10th - 15th century) 54
2.3. Some requirements when determining measures to use infographics in teaching Vietnamese history (10th - 15th century) 59
2.4. Measures to use infographics in teaching Vietnamese history (10th - 15th century) at Hung Yen Specialized High School 60
2.4.1. Using infographics to motivate and interest students in learning 60
2.4.2. Using infographics when organizing for students to acquire new knowledge 63
2.4.3. Using infographics to reinforce knowledge learned by students 74
2.4.4. Using infographics when testing students' cognitive activities 78
2.5. Pedagogical experiment 83
2.5.1. Experimental purpose 83
2.5.2. Subjects, time, and location of pedagogical experiment 83
2.5.3. Experimental content and experimental methods 84
2.5.4. Experimental results 85
Chapter 2 Summary 90
CONCLUSIONS AND RECOMMENDATIONS 91
LIST OF REFERENCES 94
INTRODUCTION
1. Reason for choosing the topic
The 8th Conference of the Central Executive Committee of the Communist Party of Vietnam (11th tenure) passed a Resolution on fundamental and comprehensive innovation of education and training to meet the requirements of industrialization and modernization in the context of a socialist-oriented market economy and international integration. On December 25, 2018, the Ministry of Education and Training officially approved the Comprehensive General Education Program for all levels from primary to high school. Accordingly, all subjects in general schools are aimed at implementing the innovation goals to meet the requirements of education and training in the new era.
In the context of having to adapt to the times, education, especially history education, is also innovating, not only to provide knowledge but also to focus on developing students' abilities. However, with the huge amount of information that students need to remember and apply in subjects like today, it is clear that there is a need for new teaching tools to simplify the way of presenting information to effectively support learners' reception. This is an urgent requirement and infographics are a reasonable solution for that requirement. With outstanding features such as the ability to synthesize, generalize, aesthetics, creativity, etc., infographics can become a tool, a new solution, contributing to improving interest and effectiveness in learning the subject. Brief infographic pages with concise content, eye-catching colors and images will attract students and support them better in the process of learning history - a subject that is considered difficult to remember and learn because it is too long and has many events for the majority of students. Although there are many outstanding advantages in conveying information and the potential to improve students' interest in learning, in reality, research and application of infographics in history teaching is still a new issue that has not been effectively exploited.
The Vietnamese history program from the 10th to the 15th century is associated with the establishment of feudal dynasties with the fundamental role for the development of the regime.
independent feudalism. Understanding this historical period plays a particularly important role in helping students perceive and explain the historical content of the following periods. Not only that, the content of Vietnamese history from the 10th to the 15th century has a large amount of knowledge, and many interesting parts of knowledge, but the capacity in terms of teaching time in class is limited. This is the basis for teachers to be able to organize the design and use of infographics in teaching to optimize time and create interest for learners.
Using infographics in history teaching is an effective solution to help students learn quickly, remember for a long time, synthesize knowledge well and promote students' creativity, while meeting the requirements of innovating history teaching methods in a modern direction, arousing students' interest in learning and creative thinking.
Based on the above reality and our own research conditions, we chose the problem: " Using infographics in teaching Vietnamese history (10th century -
XV) at Hung Yen Specialized High School" to make the topic of his master's thesis research.
2. History of research on the problem
2.1. Foreign documents
Research on infographics has been mentioned in a number of articles and research papers by domestic and foreign authors. Based on the history of research on the issue, we can mention typical authors such as:
Paul Martin Lester – Professor in the Department of Communication, California State University at Fullerton in his research titled Syntactic Theory of Visual Communication (2006) pointed out that television images cross all international borders, they become more understandable by most people. Words are easily forgotten, but images stay in the mind. Because: Words and images become a powerful means of effective communication in the mind. In his book, Lester also used evidence from the research of educational psychologist Jerome Bruner of New York University citing studies showing that people only remember 10% of what they hear, 30% of what they read, but about 80% of what they see and
do. As all members of society, whether at home, at school, or at work, learn to use computers to process text and images, a shift will be made from passive viewing to active use. Words and images will become a powerful and memorable means of communication.
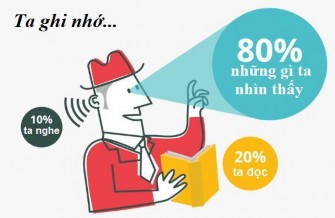
Figure 1.1. Human memory ability through the senses
(Source: Lester, PM, 2006)
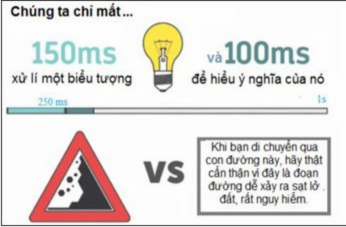
Figure 1.2. Information processing time of the human brain
(Source: Lester, PM, 2006)
Daniel Adams in the article “ What Are Infographics and Why Are They Important ?” (2011) mentioned 2 main contents: What are infographics and why are they important? From the concept of infographic, the author focuses on analyzing the advantages of infographics, emphasizing the necessity of using infographics in
Today’s busy lifestyles mean that “ readers lead busy, fast-paced lives with little time to interpret data, and so creative ways of communicating information need to be explored. Infographics convey key information quickly. They grab the attention and maintain the reader’s focus .”
Kim Eun Sook in the book series A Brief History of the World in Pictures , Dan Tri Publishing House, Hanoi, 2017, compiled 7 volumes with the spirit of " learning and having fun with infographics ". In the introduction, the author affirmed: " Learning history will become extremely boring if we are forced to passively memorize rows and rows of numbers, events, subjective assessments of others... Our brains will also become lazy because someone else will think for us. The method of teaching history in the style of "transmission - memorization" will gradually make us lose interest " [38, p. 3]. According to the author, " the golden key to open the door of time, to find "the history of all of us " - the history of the world " is infographic. Thanks to infographics with “ active thinking methods,” you will have all the vivid images of the past through interesting introductions, lively conversations, realistic pictures… From there, you will have your own assessments and feelings ” [38, p. 3].
Ximena Vengoechea created the book series Want to be good at History? I lend you my notebook , The Gioi Publishing House, Hanoi, 2018 with the desire to become a handbook to help high school students study World History better. The book series consists of three volumes translated by Mai Nguyen and Huyen Pham. Although the book series does not touch on the concept of infographics, the way the content of the three volumes is presented uses the principles of infographic construction. Each page of the book is like an infographic with the content presented being the main ideas, outstanding information and data combined with illustrations, maps, timelines, diagrams, etc. The author also carefully divides the colors for different content to support memory and maintain interest in the reader: with important keywords highlighted in yellow, historical concepts are simplified, easy to understand, framed and highlighted in green; Historical figures, places and dates which are important data related to a historical event are written in blue.
Thus, the use of infographics has been mentioned in many research works as a new method in systematizing information, even applied in teaching subjects in high schools. However, there has not been any official research work mentioning the application of infographics in the process of teaching history to improve the effectiveness of lessons and promote students' ability in learning history.
2.2. Domestic documents
Besides foreign authors, research, study and application of infographics are also issues of interest to domestic scholars. Among them can be mentioned:
Huynh Pham Dung Phat, Tran Thi Hoa Lan, Nguyen Thi Thanh Thuy , Using Piktochart to design infographics for teaching geography, Science magazine of Ho Chi Minh City University of Education, 2016. In the article, the author affirmed: Infographic will be a powerful support tool for the Geography subject in the future for teachers to provide and students to exploit information actively. The data will be selected and designed according to predetermined goals. For each problem, infographics can choose many different approaches, so it is completely possible to use infographics to promote students' own creativity in the self-study process.
Nhat Anh in the article introducing Infographic - a picture is worth a thousand words (2014) in STINFO magazine published by the Ho Chi Minh City Science and Technology Information Center - Ho Chi Minh City Department of Science and Technology in 2014 affirmed: As people spend more time on the sea of information flooding the internet, the role of infographics becomes more important. Infographics become the center of attention as a way to convey complex ideas and information. As the name of the article suggests, the author analyzed in detail the advantages that make infographics outstanding strengths, while also pointing out the limitations of this tool.
Workshop on Application of Infographic in Teaching Architectural History of Ho Chi Minh City University of Architecture on October 7, 2017. At the workshop, Master of Architecture Nguyen Ngoc Son - lecturer of Architectural Theory and History affirmed:
Infographics are a modern means of communication support, widely and popularly applied in many different fields (education, art, science, communication, ...) at American universities in particular and in the world in general. Through serious scientific tests, infographics are gradually being applied strongly to support and enhance communication effectiveness in a simple, concise and succinct manner. The author also demonstrated his point of view by presenting some infographic applications in supporting the teaching of architectural history with remarkable effects in some specific teaching contents of two subjects: History of Western Architecture, History of Eastern and Vietnamese Architecture.
Nguyen Manh Huong (Cb), Infographic for reviewing, testing, evaluating and taking the National High School History exam , Hanoi National University Publishing House, 2018. This is the first history book to recognize and use infographics as an effective tool to systematize core knowledge, supporting students in the learning process by increasing the visuality of images.
Tran Thuy Duyen, Design and use of infographic animation in teaching geography grade 11 , Proceedings of the conference of scientific research students at Ho Chi Minh City University of Education, 2017. The author affirmed: " The "overabundance" of information in the present era also creates the need to read quickly, skim through the main information... Infographic Animation synthesizes information according to each separate topic, thanks to which viewers can easily systematize knowledge. Moreover, each scenario pays attention to logic, arranging the layout of content and images to highlight causal relationships, correlation comparisons, practical connections... This actively supports the formation and fostering of human logical thinking, especially students who are in the process of perfecting their cognition ". From that perception, the author asserts: Through graphic images, vivid effects and creative arrangement of ideas, Geography knowledge is conveyed to students in a more intuitive and vivid way. The lesson content will no longer be dry and boring, besides, it will be updated with new geographical events happening in the world, helping students easily remember knowledge and supplement useful information outside of textbooks . "The author also researched,
Introduces the process of designing a basic Infographic Animation video clip and how to use them effectively in teaching Geography 11 [15, p. 96].
Nguyen Thanh Ha, Using graphic information in electronic newspapers today, Master's thesis in Journalism, Hanoi, 2015. The thesis focuses on studying the issues of using graphics in electronic newspaper works. Based on the analysis of the characteristics, features, advantages and limitations of graphic information, the topic proposes a number of solutions to improve the quality of using graphic information in Vietnamese electronic newspapers today.
Tran Thi Hang, Master's thesis in Journalism, Storytelling method using Infographics on television , Hanoi, 2015. The thesis focuses on analyzing the successes and limitations of using graphic information of some domestic and foreign television channels; at the same time, it also affirms that the use of graphic information contributes to storytelling on television has changed and caught up with the trend of the times. However, there are still certain limitations in the use of graphic colors, motion effects between symbols, ...
Trinh Thi Quynh, Using graphic information in Vietnamese printed newspapers, Master's thesis in Journalism, University of Social Sciences and Humanities, Hanoi, 2016. The topic has emphasized the outstanding advantages of graphic information (infographic) such as diversity, popularity, richness, attractiveness, and system. At the same time, it also pointed out some limitations of graphic information in terms of image size, content quality, printing costs, etc.
Ngo Thi Yen, Using graphic information in television programs , Master's thesis in Journalism, University of Social Sciences and Humanities, Hanoi, 2013. The thesis goes into depth to explain the concepts of television programs, graphic information and terms related to design. The thesis also provides the history of formation and development of graphic information in general and graphic information for the television sector in particular in the world as well as in Vietnam, the characteristics, roles and meanings of graphic information.