Vietnamese seafood processing enterprises, period from 2005 to 2010. Enterprise value variable is measured by return on equity (ROE) total debt to assets representing the capital structure of the enterprise. The research results show that there is a threshold between debt ratio and enterprise value. If the debt ratio is lower than 59.27%, the enterprise value increases, but if the debt ratio is higher than 59.27%, the enterprise value tends to decrease.
Based on empirical studies, a summary of factors affecting corporate capital structure is shown in the following table:
Table 1.2. Summary of factors affecting enterprise financial performance
Independent variable
Impact | Research author | |
Total debt to assets | + | Humphrey Motanya; Divya Aggarwal; Padhan ; Tran Hung Son and Tran Viet Hoang; Maryam Ahani; Nguyen Thanh Cuong |
- | Youn and Gu ; Zeitun & Tian; Ahmad; Abdullah and Roslan; Mwangi, Makau & Kosimbei; Luís Pacheco and Fernando Tavares; Woo Gon Kim; A.Ajanthan; Simona; Chu Thi Thuy Thuy et al.; | |
NA | Nguyen Van Thang, Le Van Thach, | |
Business size | + | Divya Aggarwal; Purna Chandra Padhanm; Yoon and Jang; Zeitun & Tian; Ahmad; Abdullah and Roslan; Master Thesis; Doan Ngoc Phi Anh |
- | Simona; Chu Thi Thuy Thuy and colleagues | |
NA | Tran Hung Son and Tran Viet Hoang; Ahmad; Abdullah and Roslan; Mwangi, Makau & Kosimbei. | |
Growth rate | + | Ahmad; Abdullah and Roslan |
- |
Maybe you are interested!
-
 Factors Affecting Business Performance of Meiko Trading and Construction Company Limited
 -
 Research on factors affecting the decision to purchase gypsum board of Huy An private trading enterprise from institutional customers in Ho Chi Minh City - 13
 -
 Some Factors Affecting the Quality of Short-Term Loan Services for Business Customers of Commercial Banks
 -
 Factors Affecting the Principle of Business Prudence
 -
 Factors Affecting Credit Activities for Business
NA | Divya Aggarwal; Purna Chandra Padhan; Tran Hung Son and Tran Viet Hoang; Master Thesis | |
Ability to pay | + | Divya Aggarwal; Purna Chandra Padhan; Mwangi, Makau & Kosimbei |
- | Simona; Chu Thi Thuy Thuy and colleagues | |
NA | ||
Business risk | + | |
- | Divya Agarwal, Purna Chandra Padhan | |
NA | Zeitun & Tian | |
Corporate Income Tax | + | Zeitun & Tian |
- | ||
NA | Hyewon Youn and Zheng Gu | |
Collateral | + | Master Thesis |
- | Humphrey Motanya ; Zeitun & Tian | |
NA | Divya Aggarwal, Purna Chandra Padhan; Simona | |
Long-term debt to assets | + | Ahmad; Abdullah and Roslan |
- | ||
NA | ||
Current Debt to Assets | + | Zeitun & Tian |
- | Ahmad; Abdullah and Roslan | |
NA |
Uptime
+ | ||
- | ||
NA | Master Thesis | |
GDP growth | + | Divya Aggarwal; Purna Chandra Padhan; Mwangi, Makau & Kosimbei |
- | ||
NA | ||
Industry characteristics | + | |
- | ||
NA | Zeitun & Tian |
Source: Author's synthesis
Table 1.3. Summary of studies on debt thresholds
Variable
Debt threshold | Research sample | Author | |
ROE | * 0%-53.97% * 53.97%-70.48% * 70.48%-75.26% * >75.26% | Chinese listed companies from 2001-2006 | Cheng, Liu and Chien |
ROA | * 0%-22% * 22%- 35% * 35%-52% * > 52% | Chinese listed companies from 1998-2002 | Neih and Lu |
Stock price | * 0%-24.64% | Regional listed companies Baltic 2005-2013 | Berzkalne |
vote
* >24.64% | |||
ROE | * 0%-59.92% * >59.92% | Listed seafood enterprises in Vietnam from 2005-2010 | Cuong and Canh |
ROE | * 0%-56.67% * 56.67%- 69.72% * >69.72% | Listed companies in Vietnam 2005-2012 | Vo Hong Duc and Vo Truong Luan |
ROE | Different debt thresholds exist by industry. | Listed companies in Vietnam 2008-2012 | Vo Xuan Vinh and Nguyen Thanh Phu |
Source: Author's synthesis
1.3. Discussion and evaluation of previous studies
Previous domestic and foreign empirical studies related to capital structure, financial performance and debt threshold have demonstrated and suggested that financial performance is affected by capital structure and some internal and external factors of enterprises. In addition, some studies provide evidence that enterprises apply or follow capital structure theories in practice, and appropriate debt thresholds in capital structure. In particular, some studies related to the field of foreign tourism have provided evidence of the relationship between capital structure and financial performance. The arguments drawn from the studies are also the basis for comparison with the empirical results of the topic to have a clearer view. However, most studies have only tested the influence of capital structure on financial performance, very few topics provide optimal debt levels for enterprises.
The main research methods used in empirical studies are correlation analysis and multivariate linear regression analysis with panel data, combined with appropriate tests. Financial statements are the main source of documents to determine financial indicators in the research model of previous empirical studies.
However, there are only a few studies in the tourism field and the relationship between capital structure and financial performance is unclear, and an optimal capital structure for enterprise value or financial performance has not been determined.
Thus, based on previous research models on financial efficiency and capital structure, the author proposes a research model that both inherits part of the previous ideas and supplements and completes the analysis of the relationship between financial efficiency and capital structure, determining the optimal capital structure of Hue's enterprises.
CONCLUSION OF CHAPTER 1
With the aim of synthesizing theories related to capital structure and financial efficiency, chapter 1 presented an overview of basic theories on capital structure and the relationship of capital structure to corporate financial efficiency, optimal capital structure. The thesis also provided empirical evidence at home and abroad to clearly see whether or not there is an impact of capital structure on financial efficiency, and whether there exists an optimal capital structure threshold for financial efficiency to reach the highest value.
Most of the previous studies conducted on large enterprises in domestic and foreign economies or studying the capital structure of small and medium enterprises have not yet studied the capital structure and optimal debt threshold of the tourism sector, specifically the capital structure of tourism service enterprises in Hue city and that is also the research objective of this topic.
CHAPTER 2: CURRENT STATUS OF CAPITAL STRUCTURE OF TOURISM SERVICE ENTERPRISES IN HUE CITY
2.1. Concept of tourism and tourism services
The concept of tourism is perceived in many different categories. There are views that tourism is the art of individual travel. Another view is that tourism is the expansion of human cultural space. According to two Swiss scholars Hunziker and Krapf (1942), tourism is a synthesis of relationships and phenomena originating from the journey and temporary stay of individuals in places other than their regular workplace. Sharing the same view, Dr. Tran Nhan defines tourism as the process of human activities leaving their homeland to another place with the main purpose of appreciating unique, special, and different material and spiritual values from their homeland, not for the purpose of making a profit. (Nguyen Ba Lan, 2007)
Tourism services are the provision of travel, transportation, accommodation, food and beverage, entertainment, information, guidance and other services to meet the needs of tourists. (According to Article 4 of the Tourism Law)
According to Chapter V of the 2017 Tourism Law, tourism business includes the following 4 industries:
+ Travel business
+ Tourist accommodation business
+ Tourist transportation business
+ Other tourism services business
2.2. Current status of tourism development in Vietnam and Hue City
2.2.1. Current status of Vietnam tourism development
According to the Notice No. 179/TB-TW of the Politburo on tourism development in the new situation in 1998, together with the State Steering Committee on tourism established in 1999, the development of Vietnam's tourism was promoted. The documents of the 6th, 7th, 8th Party Congresses and the Resolution of the Central Executive Committee and the Resolution of the 9th and 10th Party Congresses affirmed the goal of developing tourism as a spearhead economic sector, raising
service level compared to other countries in the region and help Vietnam soon escape from underdevelopment.
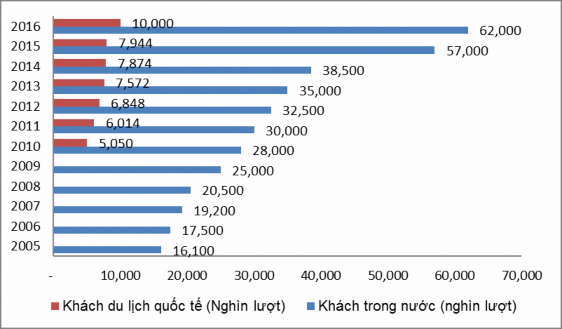
Figure 2.1. Number of domestic and foreign tourists in Vietnam in the period 2005-2016
Source: General Statistics Office.
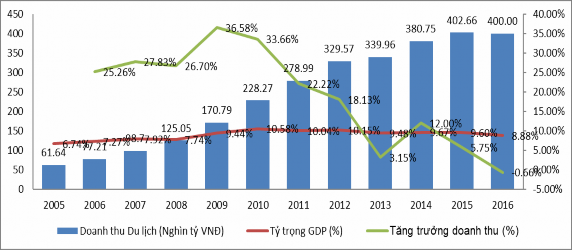
Figure 2.2. Total tourism service revenue and proportion in Vietnam's GDP in the period 2005-2016
Source: General Statistics Office.
Tourism development is reflected in the number of international and domestic tourists each year. From 1990 to present, the number of international tourists to
Vietnam increases by an average of 12% per year. Starting from the year of launching tourism in 1990, our country welcomed 250,000 international visitors and 1 million domestic tourists, then in 2010 it reached 5,050 thousand international visitors and 28,000 thousand domestic visitors. From 2010 to 2016, the number of visitors continued to grow impressively, by 2015 the number of international visitors was 7,944 thousand and domestic visitors was 57,000 thousand. It is estimated that in 2016 the number of international visitors was 10,000 and domestic visitors was 62,000 thousand.
In 2016, the total revenue of the tourism industry reached 400 trillion VND, contributing 8.9% of the country's GDP. Revenue growth from 2005 to 2010 was always at an average high of 30%. From 2011, the revenue growth rate began to decrease, the period 2011-2016 the average growth was only 12.25%. The role of the tourism industry is shown through its increasing contribution to GDP, in 2005 this figure was 6.74%, from 2009 to 2016 the average contribution to the country's GDP was 10%.
With high growth and important contribution to the country's GDP, the tourism industry continues to be considered a key economic sector mentioned in the Resolution of the 12th National Party Congress in 2016: " Have a policy to develop tourism into a key economic sector ; Encourage economic sectors to invest in tourism development with a synchronous, modern infrastructure system, diverse products and high professionalism; Create all favorable conditions for entry and exit procedures, travel and ensure safety and security; Promote promotion and build the Vietnamese tourism brand; Effectively and sustainably exploit cultural and natural heritages, historical relics, scenic spots and preserve environmental sanitation; Develop large-scale, high-quality complex tourism service areas ".
In summary, in the period from 2005-2016, the Party and the State have oriented tourism development to become a spearhead economic sector with high growth rate. Since then, the tourism industry has had strong development steps in the number of domestic and foreign visitors; the role of tourism in GDP structure is increasingly high; and the quality of tourism services is being improved and innovated.