Bank lending methods are diverse and always
available | 3.83 | 0.7375 | 0.4958 | 0.8729 |
NH applies information technology well in | ||||
customer service | 3.83 | 0.7125 | 0.4287 | 0.8748 |
Flexible loan conditions (collateral...) | ||||
active, suitable | 3.66 | 0.7913 | 0.4537 | 0.8741 |
Fast application review and disbursement time | ||||
promptly | 3.84 | 0.6227 | 0.5305 | 0.8725 |
NH shows concern for customers (handling) | ||||
problem debt…) | 3.50 | 0.7145 | 0.4513 | 0.8742 |
NH staff understand the needs of | ||||
Dear Customer | 3.51 | 0.5997 | 0.4973 | 0.8734 |
NH notes and responds to special concerns | ||||
your special | 3.44 | 0.5529 | 0.5701 | 0.8721 |
Bank working hours are convenient for you | ||||
guest | 4.05 | 0.4815 | 0.5136 | 0.8739 |
NH has promotional programs, care | ||||
Regular and varied customer care | 3.73 | 0.5993 | 0.5009 | 0.8733 |
NH always keeps its promises | 3.83 | 0.9056 | 0.4106 | 0.8759 |
Bank provides good credit service now | ||||
from the first time | 3.77 | 0.9999 | 0.4311 | 0.8757 |
When will the bank notify you? | ||||
service will be performed | 3.70 | 0.9810 | 0.3987 | 0.8768 |
Overall Cronbach's Alpha reliability coefficient | 0.8788 |
Maybe you are interested!
-
 Checking the Reliability of the Factor Scale Before Conducting Exploratory Factor Analysis Efa
 -
 Results of Scale Testing Using Exploratory Factor Analysis (Efa)
 -
 Summary Table of Exploratory Factor Analysis Results Efa
 -
 Exploratory Factor Analysis (EFA) Results for Factors Affecting Customer Satisfaction
 -
 Exploratory Factor Analysis Efa For Independent Variables

(Source: From the results of processing survey data with SPSS)
The data in the table shows that all Cronbach's Alpha coefficients of the expected questions (in the Cronbach's Alpha value column when removing variables) have values higher than 0.8. At the same time, all questions have a total variable correlation coefficient (in the Total variable relationship value column) greater than 0.3. In addition, the total Cronbach's Alpha coefficient for the expected questions of the subjects presented in the table above is 0.8788, which is very high.
Therefore, it can be concluded that this is a good measurement scale, the responses of the survey subjects all give reliable results and can be used well in the next analysis steps.
2.3.3. Scale evaluation by exploratory factor analysis EFA
Factor analysis is the general name for a group of procedures for reducing the detailed questions in a questionnaire that are designed to obtain information on all aspects of the problem under study. Using this factor analysis method will help the researcher to obtain a more meaningful set of variables. Detailed studies on the mathematical calculation can be found in some studies by Emeric (1999) and Hair et al (1995). [12]
Factor Analysis requires the researcher to decide in advance on a number of issues such as: the number of factors that need to be introduced and the method used to rotate the factors , as well as the threshold correlation coefficient to eliminate factors. According to Almeda's (1999) study, the number of factors that need to be introduced is calculated based on the estimated scope of the study, which is based on this research framework to pose specific questions. In addition, the factors that are introduced after the analysis process need to satisfy the Keiser standard - with KMO being an index used to consider the appropriateness of factor analysis. A large KMO value (between 0.5 and 1) means that factor analysis is appropriate, but if this value is less than 0.5, factor analysis is likely not appropriate for the data. [12]
The Keiser criterion stipulates that the Eigenvalue coefficient must be at least greater than or equal to 1. And usually, to facilitate a better understanding of the factors, empirical researchers often use the Varimax coordinate rotation method, also known as the Varimax method. This method will maximize the sum of variances of the correlation regression coefficients of the factor matrix, and from there leads to a logic that the correlation coefficients of the factors-variables are close to +1 or -1, which means indicating a positive or negative correlation between the factors and variables. If the correlation coefficient is approximately 0, it means that there is no correlation. At the same time, the standard of the correlation coefficient of the factor must be at least 0.5 to be considered satisfactory. And this index of 0.5 is considered the threshold to eliminate other questions in the process of factor analysis. [12]
1 | 2 | 3 | 4 | 5 | |
Bank transaction locations are convenient for you. | 0.719 | ||||
NH has spacious and attractive facilities | 0.785 | ||||
The bank's equipment is modern, always working well and stably. | 0.838 | ||||
Bank staff are neatly and politely dressed. | 0.852 | ||||
Documents such as contracts, invoices, payment orders... are clear and easy to understand. | 0.885 | ||||
Effective advertising and communication to attract customers | 0.826 | ||||
Bank staff are always polite and courteous to customers. | 0.898 | ||||
NH staff have enough knowledge to answer your questions. | 0.850 | ||||
The behavior of bank employees increasingly creates trust from customers. | 0.857 | ||||
The bank is ready to meet your needs. | 0.727 | ||||
Bank loan procedures are quick and simple | 0.649 | ||||
Bank lending methods are diverse and always available. | 0.870 | ||||
Banks apply information technology well in customer service | 0.847 | ||||
Loan conditions (collateral...) are flexible and suitable | 0.672 | ||||
Time for reviewing documents and disbursing funds is quick and timely. | 0.878 | ||||
The bank shows concern for its customers (handling problem debts…) | 0.772 | ||||
NH staff understand your needs | 0.855 | ||||
NH takes note of and responds to your special concerns. | 0.877 | ||||
Bank working hours are convenient for you | 0.639 | ||||
NH has regular and diverse promotions and customer care programs. | 0.795 | ||||
NH always keeps its promises | 0.872 | ||||
Banks provide good credit service from the first time. | 0.907 | ||||
The bank will notify you when the service will be performed. | 0.874 | ||||
Value | 6.85 | 4.08 | 2.40 | 1.91 | 1.82 |
Cumulative Variance (%) | 29.80 | 47.52 | 57.96 | 66.28 | 74.19 |
Table 2.28: Factor analysis for investigated variables
Factors Investigating Variables
(Source: From the results of processing survey data with SPSS)
80
The results of factor analysis for the expected variables are presented in the table.
2.28. Table 2.28 above shows that the factor correlation coefficients with Communalities obtained from the Varimax coordinate rotation method for the questions all satisfy the requirements required by the factor analysis method. The results show that there are 5 factors obtained from the above method with Eigenvalues satisfying the Kaiser standard condition greater than 1. At the same time, the reliability coefficient calculated for these new factors also satisfies the requirement of being greater than 0.5. The cumulative variance is 74.19% (> 50%). Therefore, these new factors will be used to calculate into new variables for appropriate analysis to determine the factors affecting the quality of business loan services later. These factors include:
- Factor 1 : Has an Eigenvalue of 6.85, greater than 1. This factor includes 6 observed variables. We name this group of factors F1: tangible means. This factor is interpreted through the impact of the criteria: The bank's transaction location is convenient for customers, the bank has spacious and attractive facilities, the bank's equipment is modern, always works well and stably, the bank's staff is neatly dressed, polite, documents such as contracts, invoices, payment orders... are clear and easy to understand, effective promotion and communication work to attract customers.
- Factor 2 : Has an Eigenvalue of 4.08, greater than 1. This factor includes 6 observed variables. We name this group of factors F2: Responsiveness . This factor is interpreted through the impact of the criteria: The bank is ready to meet the needs of customers, The bank's loan procedures are quick and simple, The bank's lending methods are diverse and always available, The bank applies information technology well in customer service, The lending conditions (collateral...) are flexible and suitable, The time for reviewing documents and disbursing is quick and timely.
- Factor 3 : Has an Eigenvalue of 2.40 greater than 1. This factor includes 5 observed variables. We name this group of factors F3: empathy . This factor is interpreted through the impact of the criteria: The bank shows concern for customers (handling problem debts...), The bank staff understands the needs of customers, The bank pays attention and responds to customers' special concerns, Working hours
The bank's work is convenient for customers. The bank has regular and diverse promotions and customer care programs.
- Factor 4 : Has an Eigenvalue of 1.91, greater than 1. This factor includes 3 observed variables. We name this group of factors F4 reliability . This factor is interpreted through the impact of the criteria: The bank always keeps its promise. The bank provides good credit services from the first time, the bank informs customers when the service will be performed.
- Factor 5 : Has an Eigenvalue of 1.82, greater than 1. This factor includes 3 observed variables. We name this group of factors F5: service capacity. This factor is interpreted through the impact of the criteria: Bank employees are always polite and courteous to customers, Bank employees have enough knowledge to answer customers' questions, Bank employees' behavior increasingly creates customers' trust.
2.3.4. Formal research model and hypotheses
Based on the results of EFA factor analysis in table 2.28, it shows that the 5 factors of the business lending quality scale are still maintained and the 23 observed variables measuring the 5 factors are still maintained with the following specific names and variable lists:
Table 2.29: Order of list of factors affecting quality
CVKD service
Name
Factor name | Observation variable | |
F 1i | Tangible means | 1,2,3,4,5,6 |
F 2i | Responsiveness | 10,11,12,13,14,15 |
F 3i | Empathy | 16,17,18,19,20 |
F 4i | Reliability | 21,22,23 |
F 5i | Service capacity | 7,8,9 |
* The research model is as follows
TANGIBLE MEANS
F1i
RESPONSIVENESS
F2i
EMPATHY
F3i
RELIABILITY
F4i
QUALITY OF BUSINESS LOAN SERVICES OF VIETINBANK QUANG TRI
SERVICE CAPACITY
F5i
Figure 2.2: Formal research model
2.3.5. Regression model
2.3.5.1. Comprehensive assessment of the model's significance
Determining the level of influence of factors on the quality of business lending services at Vietinbank Quang Tri is one of the important issues, especially in practice. Because through this analysis process, Vietinbank Quang Tri can propose solutions to improve the quality of business lending services. The regression model has the form:
Y i = 0 + 1 .F 1i + 2 .F 2i + 3 .F 3i + 4 .F 4i + 5 .F 5i + u i
In there :
- i is the order of the survey sample (i = 1 → 240)
- 0 , 1 , 2 , 3 , 4 , 5 : are the corresponding regression coefficients
- F 1i : Tangible means;
- F 2i : Responsiveness;
- F 3i : Empathy;
- F 4i : Reliability;
- F 5i : Service capacity;
- Y i : Dependent variable (quality of business loan services at Vietinbank Quang Tri)
To test the suitability between the factors that create the quality of business loan services at Vietinbank Quang Tri, the author uses multiple regression function and the single-entry method (Enter). We have the following regression analysis results:
Table 2.30: Results of regression analysis of factors affecting the quality of business loan services at Vietinbank Quang Tri
Regression coefficient
Multicomponent Index
Analytical variables
( j )
t value
VIF line
Blocking factor
3,608 | 169,283*** | ||
Tangible means | 0.227 | 10,623*** | 1,000 |
Responsiveness | 0.183 | 8,565*** | 1,000 |
Empathetic | 0.165 | 7,733*** | 1,000 |
Reliability | 0.167 | 7,811*** | 1,000 |
Service capacity | 0.132 | 6,199*** | 1,000 |
Durbin –Watson | 1,717 | ||
R-square | 0.596 | ||
F test | 69,087 | ||
Sig | 0.000 |
(Source: From the results of processing survey data with SPSS)
Note: ***: 99% confidence level corresponds to Sig < 0.01
The results of Table 2.39 show that the independent variables (Tangibles, service capacity, responsiveness, empathy, reliability) all have regression coefficients with large statistical values of "t" and sig <0.01, which shows that the regression coefficients are all statistically significant, with a confidence level of 99%. In other words, the above independent variables all affect the dependent variable ( quality of business loan services at Vietinbank Quang Tri ).
The regression equation shows the relationship between the dependent variable (Yi: quality of business loan services at Vietinbank Quang Tri ) and the independent variables (F 1i : Tangibles; F 2i : Responsiveness; F 3i : Empathy; F 4i : Reliability, F 5i : Service capacity ) is shown through the following equation:
Yi=3.608 + 0.227*F 1i + 0.183*F 2i + 0.165*F 3i + 0.167F 4i + 0.132 F 5i + U i
According to the above equation, all 5 factors affect the quality of business lending services. To see the importance of each variable to the dependent variable in the comparison relationship between independent variables, people use the regression coefficient (Beta) for comparison; the order of importance of each factor depends on the absolute value of the Beta coefficient, the factor with the larger Beta coefficient has the greater impact on the quality of business lending activities. Specifically, Table 2.30 shows that F 1i is the most important because it has a beta coefficient of 0.227; F 2i is the second most important because it has a beta coefficient of 0.183; F 4i is the third most important because it has a beta coefficient of 0.167; F 3i is the fourth most important because it has a beta coefficient of 0.165; F 5i is the fourth most important because it has a beta coefficient of 0.132.
The results of the data in table 2.30 show that R 2 = 0.596 (R Square), we use R 2 to
evaluate the model's suitability. We have R 2 according to the results of the table above is 0.596, which means that the above multiple linear regression model is suitable for the data set up to 59.6% (or 59.6% of the variation in loan service quality is explained by the 5 independent variables above).
The model has a statistical value of d = 1.717 in the first-order autocorrelation test (Durbin-Watson test) satisfying the condition d u < d < 4-d u. Therefore, the above model does not have first-order autocorrelation.
The VIF indices are all equal to 1, so the model does not have multicollinearity.
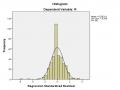
2.3.5.2 . Evaluation of model assumptions
In the F test above, we concluded that the overall model is significant, which means that at least one independent variable in the model can significantly explain the variation in the dependent variable. However, this does not mean that all independent variables included in the model are significant. To determine which independent variables are significant, we test the following hypotheses:
- H1: Good tangible means will make the quality of business loan services better. Tangible means component has beta coefficient = 0.227, t value = 10.623, with 99% confidence level so this hypothesis is accepted.
- H2: Good responsiveness will make the quality of business loan services better. The responsiveness component has beta coefficient = 0.183, t value = 8.565, with 99% confidence, so this hypothesis is accepted.
- H3: Good empathy will lead to better business loan service quality.