Observation variable
Average scale if variable type | Scale variance if variable type | Total variable correlation | Cronbach's Alpha if excluded this variable | |
Q_AIS7 | 13.86 | 13,321 | 0.770 | 0.886 |
Information Technology (IT): Cronbach's Alpha = 0.884 | ||||
IT1 | 11.31 | 11,137 | 0.742 | 0.854 |
IT2 | 10.75 | 11,671 | 0.670 | 0.870 |
IT5 | 11.39 | 11,443 | 0.686 | 0.867 |
IT6 | 11.21 | 10,943 | 0.737 | 0.855 |
IT7 | 11.16 | 10,851 | 0.767 | 0.848 |
Corporate Culture (OC): Cronbach's Alpha = 0.870 | ||||
OC2 | 11.77 | 4,429 | 0.714 | 0.838 |
OC3 | 11.82 | 4,450 | 0.736 | 0.828 |
OC4 | 11.81 | 4,570 | 0.673 | 0.854 |
OC5 | 11.80 | 4,368 | 0.770 | 0.815 |
Training and education of corporate employees (TE): Cronbach's Alpha = 0.925 | ||||
TE1 | 9.06 | 10,264 | 0.759 | 0.917 |
TE2 | 9.19 | 10,700 | 0.840 | 0.901 |
TE3 | 9.14 | 10,359 | 0.801 | 0.908 |
TE4 | 9.18 | 10,691 | 0.791 | 0.910 |
TE5 | 9.10 | 10,271 | 0.837 | 0.901 |
Employee commitment to the business (MC): Cronbach's Alpha = 0.913 | ||||
MC1 | 17.87 | 15,055 | 0.705 | 0.905 |
MC2 | 17.79 | 14,545 | 0.794 | 0.892 |
MC3 | 17.71 | 14,921 | 0.777 | 0.895 |
MC4 | 17.60 | 15,154 | 0.798 | 0.893 |
MC5 | 17.96 | 15,044 | 0.682 | 0.909 |
Maybe you are interested!
-
 A. Results of Testing the Reliability Coefficient of the Factor Scale from the Enterprise Side
 -
 Summary Table of Exploratory Factor Analysis Results Efa
 -
 Exploratory Factor Analysis (EFA) Results for Factors Affecting Customer Satisfaction
 -
 Customer Loyalty Factor Scale Results Table 13: Customer Loyalty Factor Scale Results
 -
 Checking the Reliability of the Factor Scale Before Conducting Exploratory Factor Analysis Efa
Observation variable
Average scale if variable type | Scale variance if variable type | Total variable correlation | Cronbach's Alpha if excluded this variable | |
MC6 | 17.73 | 14,804 | 0.795 | 0.892 |
Top Management Support (TMS): Cronbach's Alpha = 0.918 | ||||
TMS1 | 5.82 | 2,628 | 0.754 | 0.912 |
TMS2 | 5.78 | 2,616 | 0.823 | 0.890 |
TMS3 | 5.78 | 2,480 | 0.792 | 0.900 |
TMS4 | 5.78 | 2,387 | 0.881 | 0.868 |
Manager's knowledge (MK): Cronbach's Alpha = 0.923 | ||||
MK1 | 11.23 | 5,121 | 0.809 | 0.904 |
MK2 | 11.27 | 5,031 | 0.820 | 0.901 |
MK3 | 11.37 | 4,886 | 0.782 | 0.915 |
MK4 | 11.34 | 4,832 | 0.882 | 0.879 |
Performance Efficiency (FP): Cronbach's Alpha = 0.882 | ||||
FP1 | 11.85 | 3,159 | 0.784 | 0.833 |
FP2 | 11.99 | 3,190 | 0.777 | 0.835 |
FP3 | 11.90 | 3,176 | 0.703 | 0.867 |
FP4 | 11.83 | 3,590 | 0.727 | 0.858 |
Source: Author's calculation
4.3.3. Results of scale testing by exploratory factor analysis (EFA)
After assessing the reliability of the scale using Cronbach's Alpha coefficient, the results eliminated 6 observed variables, leaving 38 observed variables and all scales satisfying the reliability requirements. Next, the author will continue to assess the observed variables using the EFA exploratory factor analysis technique. When performing the EFA steps, the researcher obtained the following results:
The results of the first EFA exploratory factor analysis for the variables showed that the KMO value = 0.884 satisfied the condition 0.5 < 0.884 < 1. The results of Bartlett's test showed that
p-value = 0.000 < 0.05 shows that the variables are related to each other and the EFA analysis is suitable for the sample data (Appendix 4.3).
The results showed that there were 8 factors extracted with the total variance extracted (TVE) explained by the 8 factors being greater than 50%. The eight factors included:
Factor 1 (Q_AIS): has 6 observed variables Q_AIS1, Q_AIS2, Q_AIS3, Q_AIS4, Q_AIS5, Q_AIS7
Factor 2 (IT) has 5 observed variables IT1, IT2, IT5, IT6, IT7 Factor 3 (TE) has 5 observed variables TE1, TE2, TE3, TE4, TE5
Factor 4 (TMS) has 4 observed variables TMS1, TMS2, TMS3, TMS4 Factor 5 (MK) has 4 observed variables MK1, MK2, MK3, MK4 Factor 6 (OC) has 4 observed variables OC2, OC3, OC4, OC5
Factor 7 (MC) has 6 observed variables MC1, MC2, MC3, MC4, MC5, MC6 Factor 8 (FP) has 4 observed variables FP1, FP2, FP3, FP4
Table 4.13. Results of EFA analysis of official research
Observation variable
Factor | ||||||||
1 | 2 | 3 | 4 | 5 | 6 | 7 | 8 | |
MC2 | 0.894 | |||||||
MC4 | 0.834 | |||||||
MC6 | 0.821 | |||||||
MC3 | 0.811 | |||||||
MC5 | 0.731 | |||||||
MC1 | 0.683 | |||||||
Q_AIS4 | 0.888 | |||||||
Q_AIS7 | 0.825 | |||||||
Q_AIS5 | 0.807 | |||||||
Observation variable
Factor | ||||||||
1 | 2 | 3 | 4 | 5 | 6 | 7 | 8 | |
Q_AIS2 | 0.791 | |||||||
Q_AIS3 | 0.727 | |||||||
Q_AIS1 | 0.643 | |||||||
TE5 | 0.888 | |||||||
TE2 | 0.887 | |||||||
TE3 | 0.838 | |||||||
TE4 | 0.832 | |||||||
TE1 | 0.772 | |||||||
TMS4 | 0.939 | |||||||
TMS1 | 0.839 | |||||||
TMS3 | 0.821 | |||||||
TMS2 | 0.816 | |||||||
IT7 | 0.853 | |||||||
IT6 | 0.822 | |||||||
IT1 | 0.777 | |||||||
IT5 | 0.764 | |||||||
IT2 | 0.653 | |||||||
MK4 | 0.917 | |||||||
MK2 | 0.903 | |||||||
Observation variable
Factor | ||||||||
1 | 2 | 3 | 4 | 5 | 6 | 7 | 8 | |
MK1 | 0.821 | |||||||
MK3 | 0.806 | |||||||
FP4 | 0.883 | |||||||
FP2 | 0.852 | |||||||
FP1 | 0.780 | |||||||
FP3 | 0.627 | |||||||
OC5 | 0.926 | |||||||
OC2 | 0.817 | |||||||
OC3 | 0.671 | |||||||
OC4 | 0.593 | |||||||
Source: Author's calculation
4.3.4. Results of scale testing using confirmatory factor analysis
(CFA)
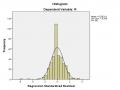
The scale items were further evaluated through the critical model, which has 632 degrees of freedom and fits the market data well (Chisquare/df = 1.435 < 2; CFI = 0.953 > 0.9; TLI = 0.948 and RMSEA = 0.044 < 0.08).
(Steiger, 1990) (see Figure 4.1). In addition, there is no correlation between measurement errors, so the observed variables are unidirectional. This means that an observed variable is only used to measure a single latent variable (research concept).
The regression weights range from 0.6 to 0.9 (> 0.5) and all meet the requirements and are statistically significant, so these variables all achieve convergence values (see table 4.14).
Table 4.14. Results of standardized regression weights
Relationship
Standardization factor | |||
MC6 | <--- | MC | 0.845 |
MC2 | <--- | MC | 0.834 |
MC4 | <--- | MC | 0.843 |
MC3 | <--- | MC | 0.828 |
MC5 | <--- | MC | 0.711 |
MC1 | <--- | MC | 0.744 |
Q_AIS7 | <--- | Q_AIS | 0.799 |
Q_AIS4 | <--- | Q_AIS | 0.842 |
Q_AIS2 | <--- | Q_AIS | 0.796 |
Q_AIS5 | <--- | Q_AIS | 0.832 |
Q_AIS1 | <--- | Q_AIS | 0.689 |
Q_AIS3 | <--- | Q_AIS | 0.767 |
TE5 | <--- | TE | 0.875 |
TE2 | <--- | TE | 0.880 |
TE3 | <--- | TE | 0.840 |
TE4 | <--- | TE | 0.834 |
TE1 | <--- | TE | 0.799 |
MK4 | <--- | MK | 0.935 |
MK2 | <--- | MK | 0.858 |
MK1 | <--- | MK | 0.847 |
MK3
<--- | MK | 0.831 | |
IT6 | <--- | IT | 0.782 |
IT7 | <--- | IT | 0.828 |
IT5 | <--- | IT | 0.732 |
IT1 | <--- | IT | 0.813 |
IT2 | <--- | IT | 0.732 |
TMS4 | <--- | TMS | 0.937 |
TMS2 | <--- | TMS | 0.878 |
TMS1 | <--- | TMS | 0.799 |
TMS3 | <--- | TMS | 0.826 |
OC5 | <--- | OC | 0.824 |
OC2 | <--- | OC | 0.784 |
OC3 | <--- | OC | 0.819 |
OC4 | <--- | OC | 0.744 |
FP4 | <--- | FP8 | 0.770 |
FP2 | <--- | FP8 | 0.841 |
FP1 | <--- | FP8 | 0.862 |
FP3 | <--- | FP8 | 0.770 |
Source: AMOS run results
Tables 4.15 and 4.16 show that the scales of the latent variables achieve discriminant validity because the correlation coefficients between the latent variables are all less than 0.9. The composite reliability coefficients of the latent variables scales are all greater than 0.6 and the total variance extracted is all greater than 50%, so they meet the requirements.
Table 4.15. Discriminant validity analysis
Factor
OC | MC | Q_AIS | TE | MK | IT | TMS | FP | |
OC | 0.793 | |||||||
MC | 0.407 | 0.803 | ||||||
Q_AIS | 0.416 | 0.465 | 0.789 | |||||
TE | 0.291 | 0.264 | 0.379 | 0.846 | ||||
MK | 0.578 | 0.289 | 0.427 | 0.374 | 0.869 | |||
IT | 0.315 | 0.315 | 0.340 | 0.307 | 0.263 | 0.778 | ||
TMS | -0.428 | -0.057 | -0.001 | -0.022 | -0.196 | -0.192 | 0.862 | |
FP | 0.589 | 0.370 | 0.369 | 0.217 | 0.579 | 0.327 | -0.253 | 0.812 |
Source: AMOS run results
Table 4.16. Results of composite reliability assessment and extracted variance
CR | AVE | |
OC | 0.872 | 0.629 |
MC | 0.915 | 0.644 |
Q_AIS | 0.908 | 0.623 |
TE | 0.926 | 0.716 |
MK | 0.925 | 0.755 |
IT | 0.885 | 0.606 |
TMS | 0.920 | 0.742 |
FP | 0.885 | 0.659 |
Source: AMOS run results