4.2.2 Expanding domestic consumer market 158
4.3 Enhance the capacity and supply capability of supporting and investment sectors
private public 160
Maybe you are interested!
-
 Research on competitive advantage of green coffee products of economic organizations in Dak Lak province - 26
 -
 Summary of Competitive Advantages of Green Coffee Products
 -
 Research on building coffee tourism products into one of the main brands of Dak Lak tourism - 2
 -
 Research on some technical measures for fertilizing Coffea canephora Pierre coffee trees in the business stage on basalt soil in Dak Lak - 25
 -
 Research Approach and Bank Credit Analysis Framework for Coffee Producers
4.3.1 Strengthening the production and supply capacity of the supplying industries
input factors
4.3.2 Improving the capacity and effectiveness of agricultural extension services
4.3.3 Improve capacity and efficiency of credit services
4.3.4 Increase investment in infrastructure development
160
162
164
165
4.3.5 Strengthening research capacity and technology transfer 166
4.3.6 Completing coffee production planning
4.4 Perfecting the coffee industry management organization system
CONCLUDE
1 Conclusion
167
168
172
172
2 Recommendation 174
LIST OF PUBLISHED SCIENTIFIC WORKS
REFERENCES TO THE THESIS
APPENDIX
176
177
188
LIST OF SYMBOLS AND ABBREVIATIONS
Abbreviation Full meaning
BCEC Buon Ma Thuot Coffee Trading Center
Average BQ
BSCA Brazilian Specialty Coffee Producers Association
CB Processing
CNC Colombia National Coffee Council
CS Associate
Infrastructure
FAOSTAT Statistical Center Food and Agriculture Organization of the United Nations FNC National Federation of Coffee Growers of Colombia
GI Geographical Indication
ICO International Coffee Organization
Business Management
LIFFE London Coffee Exchange
Research NC
Agriculture
Development PT
Rural Development
SCAI Specialty Coffee Association of Indonesia
Production Production
Technical progress
People's Committee People's Committee
VICOFA Vietnam Coffee and Cocoa Association
WASI Tay Nguyen Agricultural and Forestry Science and Technology Institute Export Export
LIST OF TABLES
No. Table name
Table 1.1 Comparison of advantages and disadvantages of 2 processing methods
Page
coffee 27
Table 2.1 Fluctuations in coffee area, yield and output
of Dak Lak province 50
Table 2.2 Structure of coffee export products of the province
Dak Lak 51
Table 2.3 Coffee area and output of districts in
study area 60
Table 2.4 Summary of research sample selection results 61
Table 2.5 Classification of importance level of each factor 64
Table 2.6 Classification of impact level of each factor 65
Table 2.7 SWOT matrix model 67
Table 2.8 Research indicator system 74
Table 3.1 Coffee product productivity of farming households
Dak Lak 2010 79
Table 3.2 Coffee productivity of Vietnam and some countries in 2009 80
Table 3.3 Cost of 1 ton of Dak Lak's exported coffee beans
Shake 81
Table 3.4 Cost of 1 ton of coffee beans in Dak Lak and Gia Lai
and some countries 81
Table 3.5 Domestic resource costs for 1 ton of green coffee
of Dak Lak 82
Table 3.6 Resource cost coefficients of Dak Lak, Gia Lai and
some countries 82
Table 3.7 Profits of Dak Lak, Gia Lai and some countries
84
Table 3.8 Recognizing coffee product quality information
of farmers 85
Table 3.9 Quality structure of exported coffee beans of the countries
business 87
Table 3.10 Market share of Dak Lak's exported green coffee beans and
some countries 93
Table 3.11 Cost and loading speed at ports of Vietnam and Indonesia 100
Table 3.12 Coffee growing soil quality in 2009 105
Table 3.13 Robusta coffee production efficiency according to soil quality
106
Table 3.14 Labor for coffee production of farming households 107 Table 3.15 Coffee production efficiency by area scale
108
Table 3.16 Coffee production capital of farming households 108
Table 3.17 Financial capacity of companies (million VND) 111 Table 3.18 Impact level of company capacity on profit
competitive position
Green coffee products 112
Table 3.19 Impact of adopting production process
to coffee production efficiency Table 3.20 Coffee yield by variety
113
114
Table 3.21 Comparison of actual fertilizer use in households
farmer
with recommended fertilizer dose 114
Table 3.22 Sustainable certified coffee production in Dak Lak
118
Table 3.23 Fertilizer supply capacity for coffee production
of Dak Lak province 122
Table 3.24 Comparison of actual fertilizer prices farmers have to pay with
import price
Table 3.25 Qualifications of agricultural extension officers
122
123
Table 3.26 Loan situation of coffee growing households
125
Table 3.27 Ratio of asphalt and concrete on roads
Dak Lak (%)
Table 3.28 Coffee area classified by irrigation water source
127
128
Table 3.29 Impact level of support activities on
Competitive advantage of green coffee products 129
Table 3.30 Coffee production efficiency according to the linkage form
131
Table 3.31 Impact level of industry management organization
for the competitive advantage of green coffee products 135
Table 3.32 Impact of exchange rate on competitive advantage of products
green coffee 137
Table 3.33 Strategy for developing product competitive advantage
green coffee
of economic organizations in Dak Lak province 141
Table 4.1 Labor resources in coffee growing households 148
Table 4.2 Comparison of coffee bean quality by variety 151
Table 4.3 Coffee production planning to 2015 and 2020
168
LIST OF CHARTS
No. Chart Name Page
Chart 3.1 Factors affecting the quality of green coffee (%) 86
Chart 3.2 Export price of green coffee from Dak Lak and some countries (USD/ton)
90
Chart 3.3 Unit price index of green coffee of Dak Lak and some Asian countries
91
Chart 3.4 Market share of exported green coffee volume
of Dak Lak and Gia Lai compared to the whole country 93
Figure 3.5 Changes in major markets for green coffee products
of Dak Lak (tons) 95
Figure 3.6 Structure of exported coffee bean types of Dak Lak province (%) 99 Figure 3.7 (a and b) Labor structure of coffee producing households
by educational level and professional level 107
Chart 3.8 Coffee selling time of farming households (% of households) 110
Figure 3.9 Total capacity of export processing enterprises
Coffee in Dak Lak province (points, maximum 100 points) 111
Figure 3.10 Coffee harvest time in households 116
Figure 3.11 (a and b) Forms and means of coffee processing in households 116 Figure 3.12 Scale and growth rate of domestic coffee consumption in Dak Lak
120
Chart 3.13 Domestic consumption rate of Vietnam (Dak Lak) and some countries (%)
121
Chart 3.14 Households' difficulties in borrowing capital 126
Figure 3.15 Sources of market information for businesses
Access options (%) 134
Chart 3.16 Coffee price fluctuations in Dak Lak province market in 2010 136
Figure 4.1 Information needs of coffee producers (%) 149
Figure 4.2 Information sources for coffee producers (%) 149
Chart 4.3 Farmers' access to coffee cultivation knowledge (%) 149
Figure 4.4 Farmers' Preferred Extension Types
(% of people who chose) 163
LIST OF DIAGRAMS
No. Sitemap Name
Figure 1.1 Competitive advantage of green coffee products 24
Diagram 1.2 Factors determining the competitive advantage of green coffee products 31
Diagram 2.1 Actors participating in the coffee industry in Dak Lak province 53
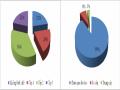
Figure 2.2. Research framework for competitive advantage of green coffee products 60 Figure 3.1 Proportion of volume and consumption price of green coffee products
in Dak Lak province in 2010 (Unit: %, 1000 VND/kg) Diagram 3.2 Summary of competitive advantages of green coffee products
97
104
Figure 3.3 Summary of factors affecting the competitive advantage of green coffee products of economic organizations 139
Diagram 4.1 Sustainable coffee production linkage between farmers and enterprises
career 156