Therefore, to examine the impact of website quality on customer satisfaction and the impact of this relationship on purchase intention, an empirical study in the Vietnamese market with a research model testing the indirect impact of website quality on purchase intention through customer satisfaction was chosen as the theoretical model.
However, there is also a study by Morgan, Hunt (1994) that there is no indirect impact through customer satisfaction, but website quality and satisfaction can directly impact purchase intention. And there have also been a number of empirical studies examining the direct impact of functionality and usefulness on purchase intention such as White and Manning (1997); Liu et al. (2000). Thus, in addition to testing the indirect impact between website functionality and usefulness on purchase intention through customer satisfaction in the theoretical model, this study still tests the direct impact between website functionality and usefulness on purchase intention to create a level of reliability and consistency in the research model. And therefore, the research model of website quality impact on purchase intention is specifically shown in Figure 2.1.
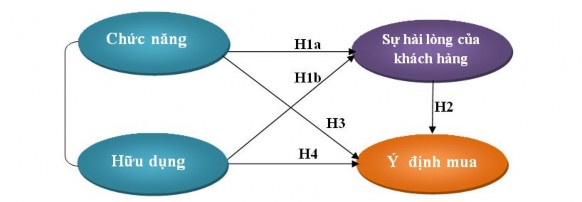
Figure 2.1 : Research model of the impact of website quality on purchase intention through customer satisfaction
Model 2.1 represents the relationship between website quality including 2 components: functionality and usefulness affecting purchase intention through the mediating variable of customer satisfaction along with 4 hypotheses:
H1(a, b): There is a positive relationship between website quality and customer satisfaction.
H2: There is a positive relationship between customer satisfaction and purchase intention.
H3: There is a positive relationship between website functionality and purchase intention.
H4: There is a positive relationship between website usefulness and purchase intention.
2.3 Competitive model
“Competing models play an important role in the theory building of social science research. According to Zaltman et al. (1982), instead of focusing on testing a model, we need to test it with competing models. Building a competing model is not only a reasonable thing to do but also a natural thing to do in research. Bagozzi (1984) also believes that we should not wait to test competing models in other studies but should do it in the same study. Because doing it this way, the research objects, measurements and other environmental factors are set up the same for the proposed theoretical model and competing models, so the level of reliability in model comparison will be higher. Researchers in the field of structural equation modeling also share the same opinion that we should not test a theoretical model
theory but must test it against a competing model (Bollen and Long, 1993)”. 6
According to Bollen and Long (1992), not only test the proposed model but also compare it with competing models to obtain consistency in the linear structural model. Some previous studies such as Morgan and Hunt (1994) suggested that there is no indirect effect through customer satisfaction, website functionality and usefulness can directly affect purchase intention. And there have been some empirical studies examining the direct effect of website functionality and usefulness on purchase intention (White and Manning, 1997; Liu et al., 2000).
6 According to Nguyen Dinh Tho, 2010, 183. Scientific research in business administration.
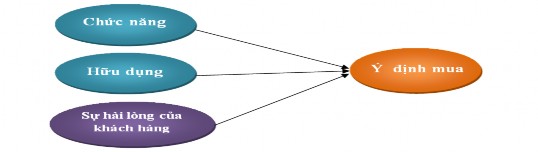
Figure 2.2: Competitive model - website quality, customer satisfaction directly affect purchase intention
In this study, the competitive model is the level of direct impact between website functionality and usefulness; customer satisfaction on purchase intention. The competitive model is established generally on the research model in Figure 2.1.
Chapter 2 presented the theoretical basis and 4 hypotheses proposed to establish a research model with the level of direct and indirect impact between website quality, customer satisfaction and purchase intention. Chapter 3 will introduce the research method to test the theoretical model and the proposed hypotheses.
CHAPTER 3: RESEARCH METHODOLOGY
Chapter 3 presents the research method used to evaluate and test the scales and research models along with the hypotheses proposed in Chapter 2, including 5 main parts: (1) research process, (2) analysis methods, (3) basis of scales measuring research concepts, (4) preliminary scale evaluation results, (5) sampling method for official research.
3.1 Research process
The research was conducted in two main steps, (1) preliminary research,
(2) formal research. Preliminary research uses qualitative and quantitative methods. Formal research uses quantitative methods. Specifically presented as follows:
3.1.1 Preliminary research
The qualitative research aims to adjust the use of scale terminology and at the same time record comments to expand the scale, adjust it to suit the consumer behavior of Vietnamese tourists, thereby building and perfecting the questionnaire for quantitative research. The qualitative research is conducted through the 2-group discussion technique, with discussion group 1 discussing with 4 managers and tour operators of travel companies: Viet Sun Travel, Thuan Viet Travel, Unitour Travel, Cabaret Travel and discussion group 2 including 8 tourists of Unitour travel company, discussion outline (See Appendix 1).
The preliminary quantitative research questionnaire was designed from the results of the qualitative research, the questionnaire was sent to tourists of the Viet Sun Travel tourism company, with the help of tour guides and direct interaction with tourists. There were 70 questionnaires distributed, received about 52 and there were 46 valid questionnaires combined with 102 responses through online survey using Google Docs tool. The sample results for the preliminary quantitative research included 148. The preliminary quantitative research was conducted to make a preliminary assessment of the reliability and value of the
scale and eliminate variables that do not meet the requirements. The scale is preliminarily evaluated through Cronbach's Alpha reliability coefficient and exploratory factor analysis (EFA). The results of the preliminary quantitative study will build a questionnaire for the official quantitative study.
3.1.2 Formal research
The official study re-examined the measurement model as well as the theoretical model and hypotheses in the research model. The questionnaire for the official quantitative study was adjusted from the results of the preliminary quantitative study (See Appendix 2). The sample size of the official quantitative study was 446. The official study was conducted from June 22, 2014 to August 15, 2014. The method of data collection for the study was mainly by online survey method with the author's subjective intention according to the topic of website quality assessment, representing and correctly classifying the survey subjects in order to collect accurate data so that the research results are meaningful. The online questionnaire was designed using Google Docs tool through travel forums, travel groups, and Facebook social network sent to those who have visited any websites of travel agencies within 12 months. The questionnaire has a filtering section to identify the correct survey subjects. The factors that form the concept of website quality include: functionality and usefulness; customer satisfaction and purchase intention are assessed using a 5-level Likert scale. The scale is tested using confirmatory factor analysis (CFA).
Structural Equation Modeling (SEM) using SPSS and AMOS software was performed to test the model's suitability and examine the impact between website quality variables and customer satisfaction on purchase intention.
The research process is shown in Figure 3.1.
Preliminary Qualitative
Base
theory
Draft scale
Cronbach's alpha
Check Cronbach alpha coefficient Check variable-total correlation
Preliminary quantification
EFA
Check EFA weights, Factor weights and extracted variance. |
Maybe you are interested!
-
 Study on the impact of website quality on satisfaction and online booking intention of tourists in Ho Chi Minh City: The case of homestay tourism - 1
 -
 Study on the impact of website quality on satisfaction and online booking intention of tourists in Ho Chi Minh City: The case of homestay tourism - 26
 -
 The Impact of Website Quality on Tourist Satisfaction and Purchase Intention - The Case of a Travel and Tourism Business - 14
 -
 A Modified Research Model on the Impact of Training Service Quality on Student Satisfaction at Saigonact School
 -
 Solutions for tourism development in Tien Lang - 10
zt2i3t4l5ee
zt2a3gstourism, tourism development
zt2a3ge
zc2o3n4t5e6n7ts
- District People's Committees and authorities of communes with tourist attractions should support, promote, and provide necessary information to people, helping them improve their knowledge about tourism. Raise tourism awareness for local people.
*
* *
Due to limited knowledge and research time, the thesis inevitably has shortcomings. Therefore, I look forward to receiving guidance from teachers, experts as well as your comments to make the thesis more complete.
Chapter III Conclusion
Through the issues presented in Chapter II, we can come to some conclusions:
Based on the strengths of available tourism resources, the types of tourism in Tien Lang that need to be promoted in the coming time are sightseeing and resort tourism, discovery tourism, weekend tourism. To improve the quality and diversify tourism products, Tien Lang district needs to combine with local cultural tourism resources, at the same time combine with surrounding areas, build rich tourism products. The strengths of Tien Lang tourism are eco-tourism and cultural tourism, so developing Tien Lang tourism must always go hand in hand with restoring and preserving types of cultural tourism resources. Some necessary measures to support and improve the efficiency of exploiting tourism resources in Tien Lang are: strengthening the construction of technical facilities and labor force serving tourism, actively promoting and advertising tourism, and expanding forms of capital mobilization for tourism development.
CONCLUDE
I Conclusion
1. Based on the results achieved within the framework of the thesis's needs, some basic conclusions can be drawn as follows:
Tien Lang is a locality with great potential for tourism development. The relatively abundant cultural tourism resources and ecological tourism resources have great appeal to tourists. Based on this potential, Tien Lang can build a unique tourism industry that is competitive enough with other localities within Hai Phong city and neighboring areas.
In recent years, the exploitation of the advantages of resources to develop tourism and build tourist routes in Tien Lang has not been commensurate with the available potential. In terms of quantity, many resource objects have not been brought into the purpose of tourism development. In terms of time, the regular service time has not been extended to attract more visitors. Infrastructure and technical facilities are still weak. The labor force is still thin and weak in terms of expertise. Tourism programs and routes have not been organized properly, the exploitation content is still monotonous, so it has not attracted many visitors. Although resources have not been mobilized much for tourism development, they are facing the risk of destruction and degradation.
2. Based on the results of investigation, analysis, synthesis, evaluation and selective absorption of research results of related topics, the thesis has proposed a number of necessary solutions to improve the efficiency of exploiting tourism resources in Tien Lang such as: promoting the restoration and conservation of tourism resources, focusing on investment and key exploitation of ecotourism resources, strengthening the construction of infrastructure and tourism workforce. Expanding forms of capital mobilization. In addition, the thesis has built a number of tourist routes of Hai Phong in which Tien Lang tourism resources play an important role.
Exploiting Tien Lang tourism resources for tourism development is currently facing many difficulties. The above measures, if applied synchronously, will likely bring new prospects for the local tourism industry, contributing to making Tien Lang tourism an important economic sector in the district's economic structure.
REFERENCES
1. Nhuan Ha, Trinh Minh Hien, Tran Phuong, Hai Phong - Historical and cultural relics, Hai Phong Publishing House, 1993
2. Hai Phong City History Council, Hai Phong Gazetteer, Hai Phong Publishing House, 1990.
3. Hai Phong City History Council, History of Tien Lang District Party Committee, Hai Phong Publishing House, 1990.
4. Hai Phong City History Council, University of Social Sciences and Humanities, VNU, Hai Phong Place Names Encyclopedia, Hai Phong Publishing House. 2001.
5. Law on Cultural Heritage and documents guiding its implementation, National Political Publishing House, Hanoi, 2003.
6. Tran Duc Thanh, Lecture on Tourism Geography, Faculty of Tourism, University of Social Sciences and Humanities, VNU, 2006
7. Hai Phong Center for Social Sciences and Humanities, Some typical cultural heritages of Hai Phong, Hai Phong Publishing House, 2001
8. Nguyen Ngoc Thao (editor-in-chief, Tourism Geography, Hai Phong Publishing House, two volumes (2001-2002)
9. Nguyen Minh Tue and group of authors, Hai Phong Tourism Geography, Ho Chi Minh City Publishing House, 1997.
10. Nguyen Thanh Son, Hai Phong Tourism Territory Organization, Associate Doctoral Thesis in Geological Geography, Hanoi, 1996.
11. Decision No. 2033/QD – UB on detailed planning of Tien Lang town, Hai Phong city until 2020.
12. Department of Culture, Information, Hai Phong Museum, Hai Phong relics
- National ranked scenic spot, Hai Phong Publishing House, 2005. 13. Tien Lang District People's Committee, Economic Development Planning -
Culture - Society of Tien Lang district to 2010.
14.Website www.HaiPhong.gov.vn
APPENDIX 1
List of national ranked monuments
STT
Name of the monument
Number, year of decisiondetermine
Location
1
Gam Temple
938 VH/QĐ04/08/1992
Cam Khe Village- Toan Thang commune
2
Doc Hau Temple
9381 VH/QĐ04/08/1992
Doc Hau Village –Toan Thang commune
3
Cuu Doi Communal House
3207 VH/QĐDecember 30, 1991
Zone II of townTien Lang
4
Ha Dai Temple
938 VH/QĐ04/08/1992
Ha Dai Village –Tien Thanh commune
APPENDIX II
STT
Name of the monument
Number, year of decision
Location
1
Phu Ke Pagoda Temple
178/QD-UBJanuary 28, 2005
Zone 1 - townTien Lang
2
Trung Lang Temple
178/QD-UBJanuary 28, 2005
Zone 4 – townTien Lang
3
Bao Khanh Pagoda
1900/QD-UBAugust 24, 2006
Nam Tu Village -Kien Thiet commune
4
Bach Da Pagoda
1792/QD-UB11/11/2002
Hung Thang Commune
5
Ngoc Dong Temple
177/QD-UBNovember 27, 2005
Tien Thanh Commune
6
Tomb of Minister TSNhu Van Lan
2848/QD-UBSeptember 19, 2003
Nam Tu Village -Kien Thiet commune
7
Canh Son Stone Temple
2160/QD-UBSeptember 19, 2003
Van Doi Commune –Doan Lap
8
Meiji Temple
2259/QD-UBSeptember 19, 2002
Toan Thang Commune
9
Tien Doi Noi Temple
477/QD-UBSeptember 19, 2005
Doan Lap Commune
10
Tu Doi Temple
177/QD-UBJanuary 28, 2005
Doan Lap Commune
11
Duyen Lao Temple
177/QD-UBJanuary 28, 2005
Tien Minh Commune
12
Dinh Xuan Uc Pagoda
177/QD-UBJanuary 28, 2005
Bac Hung Commune
13
Chu Khe Pagoda
177/QD-UBJanuary 28, 2005
Hung Thang Commune
14
Dong Dinh
2848/QD-UBNovember 21, 2002
Vinh Quang Commune
15
President's Memorial HouseTon Duc Thang
177/QD-UBJanuary 28, 2005
NT Quy Cao
Ha Dai Temple
Ben Vua Temple
Tien Lang hot spring
div.maincontent .p { color: black; font-family:"Times New Roman", serif; font-style: normal; font-weight: normal; text-decoration: none; font-size: 14pt; margin:0pt; } div.maincontent p { color: black; font-family:"Times New Roman", serif; font-style: normal; font-weight: normal; text-decoration: none; font-size: 14pt; margin:0pt; } div.maincontent .s1 { color: black; font-family:"Times New Roman", serif; font-style: normal; font-weight: normal; font-size: 16pt; } div.maincontent .s2 { color: black; font-family:"Times New Roman", serif; font-style: italic; font-weight: bold; text-decoration: none; font-size: 14pt; } div.maincontent .s3 { color: black; font-family:"Times New Roman", serif; font-style: italic; font-weight: normal; text-decoration: none; font-size: 14pt; } div.maincontent .s4 { color: black; font-family:"Times New Roman", serif; font-style: normal; font-weight: normal; font-size: 14pt; } div.maincontent .s5 { color: black; font-family:"Times New Roman", serif; font-style: normal; font-weight: bold; font-size: 14pt; } div.maincontent .s6 { color: black; font-family:"Times New Roman", serif; font-style: normal; font-weight: normal; text-decoration: none; font-size: 14pt; } div.maincontent .s7 { color: black; font-family:"Times New Roman", serif; font-style: normal; font-weight: bold; text-decoration: none; font-size: 14pt; } div.maincontent .s8 { color: black; font-family:"Times New Roman", serif; font-style: normal; font-weight: normal; text-decoration: none; font-size: 9pt; vertical-align: 6pt; } div.maincontent .s9 { color: black; font-family:"Times New Roman", serif; font-style: normal; font-weight: bold; text-decoration: none; font-size: 12pt; } div.maincontent .s11 { color: black; font-family:"Times New Roman", serif; font-style: normal; font-weight: normal; tex
Solutions for tourism development in Tien Lang - 10
zt2i3t4l5ee
zt2a3gstourism, tourism development
zt2a3ge
zc2o3n4t5e6n7ts
- District People's Committees and authorities of communes with tourist attractions should support, promote, and provide necessary information to people, helping them improve their knowledge about tourism. Raise tourism awareness for local people.
*
* *
Due to limited knowledge and research time, the thesis inevitably has shortcomings. Therefore, I look forward to receiving guidance from teachers, experts as well as your comments to make the thesis more complete.
Chapter III Conclusion
Through the issues presented in Chapter II, we can come to some conclusions:
Based on the strengths of available tourism resources, the types of tourism in Tien Lang that need to be promoted in the coming time are sightseeing and resort tourism, discovery tourism, weekend tourism. To improve the quality and diversify tourism products, Tien Lang district needs to combine with local cultural tourism resources, at the same time combine with surrounding areas, build rich tourism products. The strengths of Tien Lang tourism are eco-tourism and cultural tourism, so developing Tien Lang tourism must always go hand in hand with restoring and preserving types of cultural tourism resources. Some necessary measures to support and improve the efficiency of exploiting tourism resources in Tien Lang are: strengthening the construction of technical facilities and labor force serving tourism, actively promoting and advertising tourism, and expanding forms of capital mobilization for tourism development.
CONCLUDE
I Conclusion
1. Based on the results achieved within the framework of the thesis's needs, some basic conclusions can be drawn as follows:
Tien Lang is a locality with great potential for tourism development. The relatively abundant cultural tourism resources and ecological tourism resources have great appeal to tourists. Based on this potential, Tien Lang can build a unique tourism industry that is competitive enough with other localities within Hai Phong city and neighboring areas.
In recent years, the exploitation of the advantages of resources to develop tourism and build tourist routes in Tien Lang has not been commensurate with the available potential. In terms of quantity, many resource objects have not been brought into the purpose of tourism development. In terms of time, the regular service time has not been extended to attract more visitors. Infrastructure and technical facilities are still weak. The labor force is still thin and weak in terms of expertise. Tourism programs and routes have not been organized properly, the exploitation content is still monotonous, so it has not attracted many visitors. Although resources have not been mobilized much for tourism development, they are facing the risk of destruction and degradation.
2. Based on the results of investigation, analysis, synthesis, evaluation and selective absorption of research results of related topics, the thesis has proposed a number of necessary solutions to improve the efficiency of exploiting tourism resources in Tien Lang such as: promoting the restoration and conservation of tourism resources, focusing on investment and key exploitation of ecotourism resources, strengthening the construction of infrastructure and tourism workforce. Expanding forms of capital mobilization. In addition, the thesis has built a number of tourist routes of Hai Phong in which Tien Lang tourism resources play an important role.
Exploiting Tien Lang tourism resources for tourism development is currently facing many difficulties. The above measures, if applied synchronously, will likely bring new prospects for the local tourism industry, contributing to making Tien Lang tourism an important economic sector in the district's economic structure.
REFERENCES
1. Nhuan Ha, Trinh Minh Hien, Tran Phuong, Hai Phong - Historical and cultural relics, Hai Phong Publishing House, 1993
2. Hai Phong City History Council, Hai Phong Gazetteer, Hai Phong Publishing House, 1990.
3. Hai Phong City History Council, History of Tien Lang District Party Committee, Hai Phong Publishing House, 1990.
4. Hai Phong City History Council, University of Social Sciences and Humanities, VNU, Hai Phong Place Names Encyclopedia, Hai Phong Publishing House. 2001.
5. Law on Cultural Heritage and documents guiding its implementation, National Political Publishing House, Hanoi, 2003.
6. Tran Duc Thanh, Lecture on Tourism Geography, Faculty of Tourism, University of Social Sciences and Humanities, VNU, 2006
7. Hai Phong Center for Social Sciences and Humanities, Some typical cultural heritages of Hai Phong, Hai Phong Publishing House, 2001
8. Nguyen Ngoc Thao (editor-in-chief, Tourism Geography, Hai Phong Publishing House, two volumes (2001-2002)
9. Nguyen Minh Tue and group of authors, Hai Phong Tourism Geography, Ho Chi Minh City Publishing House, 1997.
10. Nguyen Thanh Son, Hai Phong Tourism Territory Organization, Associate Doctoral Thesis in Geological Geography, Hanoi, 1996.
11. Decision No. 2033/QD – UB on detailed planning of Tien Lang town, Hai Phong city until 2020.
12. Department of Culture, Information, Hai Phong Museum, Hai Phong relics
- National ranked scenic spot, Hai Phong Publishing House, 2005. 13. Tien Lang District People's Committee, Economic Development Planning -
Culture - Society of Tien Lang district to 2010.
14.Website www.HaiPhong.gov.vn
APPENDIX 1
List of national ranked monuments
STT
Name of the monument
Number, year of decisiondetermine
Location
1
Gam Temple
938 VH/QĐ04/08/1992
Cam Khe Village- Toan Thang commune
2
Doc Hau Temple
9381 VH/QĐ04/08/1992
Doc Hau Village –Toan Thang commune
3
Cuu Doi Communal House
3207 VH/QĐDecember 30, 1991
Zone II of townTien Lang
4
Ha Dai Temple
938 VH/QĐ04/08/1992
Ha Dai Village –Tien Thanh commune
APPENDIX II
STT
Name of the monument
Number, year of decision
Location
1
Phu Ke Pagoda Temple
178/QD-UBJanuary 28, 2005
Zone 1 - townTien Lang
2
Trung Lang Temple
178/QD-UBJanuary 28, 2005
Zone 4 – townTien Lang
3
Bao Khanh Pagoda
1900/QD-UBAugust 24, 2006
Nam Tu Village -Kien Thiet commune
4
Bach Da Pagoda
1792/QD-UB11/11/2002
Hung Thang Commune
5
Ngoc Dong Temple
177/QD-UBNovember 27, 2005
Tien Thanh Commune
6
Tomb of Minister TSNhu Van Lan
2848/QD-UBSeptember 19, 2003
Nam Tu Village -Kien Thiet commune
7
Canh Son Stone Temple
2160/QD-UBSeptember 19, 2003
Van Doi Commune –Doan Lap
8
Meiji Temple
2259/QD-UBSeptember 19, 2002
Toan Thang Commune
9
Tien Doi Noi Temple
477/QD-UBSeptember 19, 2005
Doan Lap Commune
10
Tu Doi Temple
177/QD-UBJanuary 28, 2005
Doan Lap Commune
11
Duyen Lao Temple
177/QD-UBJanuary 28, 2005
Tien Minh Commune
12
Dinh Xuan Uc Pagoda
177/QD-UBJanuary 28, 2005
Bac Hung Commune
13
Chu Khe Pagoda
177/QD-UBJanuary 28, 2005
Hung Thang Commune
14
Dong Dinh
2848/QD-UBNovember 21, 2002
Vinh Quang Commune
15
President's Memorial HouseTon Duc Thang
177/QD-UBJanuary 28, 2005
NT Quy Cao
Ha Dai Temple
Ben Vua Temple
Tien Lang hot spring
div.maincontent .p { color: black; font-family:"Times New Roman", serif; font-style: normal; font-weight: normal; text-decoration: none; font-size: 14pt; margin:0pt; } div.maincontent p { color: black; font-family:"Times New Roman", serif; font-style: normal; font-weight: normal; text-decoration: none; font-size: 14pt; margin:0pt; } div.maincontent .s1 { color: black; font-family:"Times New Roman", serif; font-style: normal; font-weight: normal; font-size: 16pt; } div.maincontent .s2 { color: black; font-family:"Times New Roman", serif; font-style: italic; font-weight: bold; text-decoration: none; font-size: 14pt; } div.maincontent .s3 { color: black; font-family:"Times New Roman", serif; font-style: italic; font-weight: normal; text-decoration: none; font-size: 14pt; } div.maincontent .s4 { color: black; font-family:"Times New Roman", serif; font-style: normal; font-weight: normal; font-size: 14pt; } div.maincontent .s5 { color: black; font-family:"Times New Roman", serif; font-style: normal; font-weight: bold; font-size: 14pt; } div.maincontent .s6 { color: black; font-family:"Times New Roman", serif; font-style: normal; font-weight: normal; text-decoration: none; font-size: 14pt; } div.maincontent .s7 { color: black; font-family:"Times New Roman", serif; font-style: normal; font-weight: bold; text-decoration: none; font-size: 14pt; } div.maincontent .s8 { color: black; font-family:"Times New Roman", serif; font-style: normal; font-weight: normal; text-decoration: none; font-size: 9pt; vertical-align: 6pt; } div.maincontent .s9 { color: black; font-family:"Times New Roman", serif; font-style: normal; font-weight: bold; text-decoration: none; font-size: 12pt; } div.maincontent .s11 { color: black; font-family:"Times New Roman", serif; font-style: normal; font-weight: normal; tex
Official quantification
CFA
Official scale
Test model fit, CFA weights, convergent validity, discriminant validity, unidimensionality, composite reliability, and variance extracted.
SEM
Check the model's suitability and hypotheses, the impact level of variables.
- Conclude
- Management implications
Figure 3.1 : Research process
3.2 Analytical methods
3.2.1 Cronbach's Alpha coefficient analysis
Cronbach's Alpha is a statistical test of the level of rigor (ability to explain a research concept) of a set of observed variables. Cronbach's Alpha is used to eliminate inappropriate variables. The correlation coefficient of an observed variable with the total variable is less than 0.3 and the standard for selecting a scale is when the reliability is 0.6 or higher. A scale has good reliability when it varies in the range [0.70 - 0.80]. If Cronbach's Alpha ≥ 0.60, the scale is acceptable in terms of reliability (Nunnally and Bernstein, 1994).
3.2.2 Exploratory factor analysis EFA
The EFA exploratory factor analysis method helps us evaluate the convergent and discriminant validity of the measurement. The EFA analysis method belongs to the group of interdependent multivariate analysis, meaning that there are no dependent and independent variables but it is based on the correlation between variables. EFA is used to reduce a set of k observed variables into a set F (F < k) of more meaningful factors. The basis for reducing and selecting variables for EFA factor analysis includes:
- KMO test is an indicator used to consider the appropriateness of EFA,
0.5 ≤ KMO ≤ 1 then factor analysis is appropriate. Bartlett's test considers the hypothesis that the correlation between observed variables = 0 in the population. If (Sig ≤ 0.05) then this test is statistically significant, the observed variables are correlated with each other in the population (Hoang Trong and Chu Nguyen Mong Ngoc, 2005, 262).
- The criteria for factor extraction in EFA include Eigenvalue indexes (representing the amount of variation explained by the factors) and Cumulative indexes (total extracted variance) indicating how much percentage the factor analysis explains and how much percentage is lost. Factors with Eigenvalue < 1 will not have the effect of summarizing information better than the latent variables in the scales before EFA analysis (Gerbing and Anderson, 1998). Eigenvalue and Cumulative indexes
How much variance is extracted depends on the extraction method and factor rotation.
- Factor loading criteria are based on the correlation between factors and observed variables. Factor loading is an indicator to ensure the practical significance of EFA. Factor loading > 0.3 is considered to reach the minimum level. Factor loading > 0.4 is considered important. Variables with factor loading ≥ 0.5 are considered to have practical significance (Hair et al., 1998). If the Factor loading > 0.3 criterion is chosen, the sample size must be at least 350. If the sample size is 100, the Factor loading > 0.55 criterion should be chosen, if the sample size is about 50, then Factor loading > 0.75 (Hair et al., 1998) .
3.2.3 Confirmatory Factor Analysis (CFA)
Confirmatory Factor Analysis is one of the statistical techniques of structural equation modeling (SEM). CFA is a method to determine the suitability of research data with the theoretical model. CFA is the next step of EFA because with CFA, the researcher must know in advance how many factors there are, how many variables in each factor, CFA considers and confirms the suitability of the available theoretical model with the research data.
According to Nguyen Dinh Tho and Nguyen Thi Mai Trang (2010), the CFA method in SEM linear structural analysis has many advantages over traditional methods such as: correlation coefficient method, exploratory factor analysis EFA, multi-concept multi-method MTMM 7 ... (Bagozzi and Foxal, 1996) because CFA allows testing the theoretical structure of measurement scales such as the relationship between a research concept and other concepts without being biased due to errors.
measurement. Furthermore, it is possible to test the convergent and discriminant validity of the scale without using as many studies as in the traditional MTMM method (Steenkamp Van Trijp, 1991).
7 The MTMM (MultiTrait - MultiMethod) method, proposed by Campbell Fiske (1958) and widely used to evaluate the value of research concepts, has the disadvantage of requiring the simultaneous implementation of many studies and many methods.