90
Table 4.2. Scale of Vietnam's commercial banking system
Unit: trillion dong
Target
2005 | 2006 | 2007 | 2008 | 2009 | 2010 | 2011 | 2012 | 2013 | 2014 | 2015 | |
Total assets | 753.15 | 1,005.65 | 1,521.72 | 1,809.42 | 2,468.69 | 3,459.9 | 4,131.9 | 4,242.21 | 5,755.80 | 6,514.9 | 7,319,317 |
Charter capital | 28,928 | 42,063 | 78,142 | 113,062 | 144,454 | 208,808 | 235,327 | 274,226 | 423,900 | 435,650 | 460,279 |
Capital mobilized | 547.64 | 725.45 | 1.5054.96 | 1,302.11 | 1,295.76 | 2,314.31 | 2,534.34 | 3,027.6 | 3,651.29 | 4,272.01 | 5,293.19 |
Growth rate mobilization (%) | 32.47 | 45.42 | 23.43 | -0.49 | 78.61 | 9.51 | 19.46 | 20.6 | 17 | 23.90 | |
Credit balance | 472.12 | 581.19 | 873.59 | 1,025.41 | 1,809.00 | 1,907.61 | 2,363.64 | 3,090.90 | 3,478.07 | 3,970.57 | 4,655.89 |
Debt/GDP (%) | 56.26 | 59.69 | 76.40 | 69.39 | 86.68 | 96.3 | 86.05 | 82.57 | 97.04 | 100.83 | 110.02 |
Growth rate credit (%) | 23.10 | 50.31 | 17.38 | 76.42 | 5.45 | 23.90 | 30.77 | 12.52 | 14.16 | 17.26 | |
Lending/mobilizing (%) | 86.21 | 80.11 | 82.81 | 78.75 | 110.94 | 82.43 | 86.13 | 80.48 | 95.26 | 92.94 | 87.96 |
Maybe you are interested!
-
 Testing the credit risk tolerance of Vietnamese commercial banks - Case study of Vietnam Joint Stock Commercial Bank for Industry and Trade - 21
 -
 The influence of factors belonging to bank characteristics on credit risk at Vietnamese commercial banks - 13
 -
 Factors affecting profitability at Vietnamese joint stock commercial banks - 1
 -
 Branch management at multinational banks: Experience of Mizuho Corporate Bank, Ltd and lessons for Vietnamese commercial banks - 17
 -
 Current Status of Profitability Rates at Vietnamese Joint Stock Commercial Banks

Source: SBV (2016), section on Statistics of operations of the credit institution system
However, inflation accelerated from 6.5% at the beginning of the year to 12.6% at the end of 2007. Domestic credit increased continuously in 2007 and early 2008. The credit growth rate compared to the same period at the end of 2007 was 53.9%. Faced with high inflation pressure, the decision to strongly tighten monetary policy was implemented by the State Bank on March 16, 2008 by issuing compulsory 364-day SBV bills with a total value of VND 20,300 billion to withdraw money from circulation. After being forced to buy, credit institutions were not allowed to use these bills in refinancing operations with the State Bank. Then, on May 19, 2008, the State Bank sharply increased all operating interest rates. In 2009, credit growth decreased to 23.0%. Inflation, after rising to 28.3% in August 2008, also eased and was down to 2.0% by August 2009.
In the context that the State Bank of Vietnam had just tightened monetary policy in Vietnam to restore macroeconomic stability, the global financial crisis occurred due to the systemic collapse of the subprime debt market in the United States. In early 2008, monetary policy was tightened with a series of strong measures such as: (i) Increasing the reserve requirement ratio by 1%, applying reserve requirement ratio to all terms (Decision No. 187/2008/QD-NHNN); (ii) Issuing mandatory credit notes of VND 20,300 billion to commercial banks (Decision No. 346/QD-NHNN); (iii) Controlling the total outstanding loans and discounting of valuable papers for securities investment and trading not to exceed 20% of the charter capital of credit institutions, raising the risk coefficient for real estate loans and securities investment and trading loans to 250% (Decision 03/2008/QD-NHNN). With these policy responses, the SBV proactively burst the bubbles, but caused a big shock to investors even though there had been policy steps to limit investment in the stock market before. In the monetary market, the sudden tightening caused a lack of liquidity and pushed up interest rates (Ha Thi Thieu Dao, 2012). From October 1, 2008, the SBV allowed credit institutions to use compulsory credit notes to refinance or withdraw early. The required reserve ratio and policy interest rates were adjusted downward starting from October 21, 2008. Along with the SBV loosening monetary policy from Q4/2008 to the end of Q1/2009, the Government
has implemented a stimulus package to cope with the impact of the global economic crisis. Monetary policy was still loosened in 2010. By early November 2010, the State Bank had adjusted policy interest rates up by 1 percentage point. The total amount of net money injected into the economy through the State Bank's open market operations in 2010 was VND98,500 billion. According to the State Bank's 2010 Annual Report, M2 money supply and outstanding credit to the economy increased by 33.3% and 31.2% respectively in 2010.
Figure 4.1. Interest rates and required reserve ratios, 2005-2015
16%
14%
12%
10%
8%
6%
4%
2%
0%
Rediscount rate Refinancing rate Base rate Required reserve ratio
Source: SBV, SBV website, monetary policy section, 2015
Faced with the reality of recurring macroeconomic instability, the Government issued Resolution 11/NQ-CP on February 24, 2011 on key solutions focusing on curbing inflation, stabilizing the macro economy, and ensuring social security. According to the Resolution, the State Bank must "manage and control to ensure the credit growth rate in 2011 is below 20%, total means of payment is 15-16%" and "reduce the speed and proportion of credit borrowing in the non-production sector, especially the real estate and securities sectors". The operating interest rates were adjusted up by the State Bank (refinancing interest rate from 9% to 11% on February 17, 2011 and 12% on May 1, 2011; rediscount interest rate from 7% to 12% on August 3, 2011 and 14% on May 1, 2011). The base interest rate and required reserve ratio remained unchanged. In addition, the increase in the number of banks led to strong competition among banks.
Small banks rely solely on deposits and lending to make profits, leading to a trend of rapidly reducing credit standards to increase outstanding loans. In particular, when the real estate market is on the rise, the trend of reducing credit standards is even greater.
4.1.2.1. Profitability of Vietnamese commercial banks
During the period 2005-2015, the Vietnamese commercial banking system achieved a fairly stable and high level of profitability with the ratio of net profit to total assets (ROA) remaining above 1% until 2010 (Figure 4.2). However, from 2011 to present, this ratio has decreased sharply. By the end of 2015, the ratio of commercial banks in the sample reached only 0.54%. This may be due to the consequences of the increasing bad debt ratio and high inflation in 2011, which caused the cost of credit risk provisions and operating costs of banks to increase rapidly, leading to a decrease in net income.
Asset size has increased steadily over the years but business efficiency has decreased, this is due to the difficult operating context of banks, weak credit growth and continuously decreasing interest rates. In 2014, business activities continued to decline, with profits in the following year being lower than the previous year. This is explained by the following main reasons:
Firstly, interest rates remain low but credit growth is difficult, mainly due to the weak capital absorption capacity of the economy, creating great pressure on capital use for banks.
Second, the mechanism and policies on handling secured assets, legal regulations on land, real estate, construction, etc. still have many shortcomings, leading to difficulties in handling secured assets to handle bad debts. Commercial banks must increase credit risk provisions according to regulations, affecting profits.
Third, commercial banks are under pressure to both consolidate and resolve existing problems according to the restructuring requirements of the State Bank of Vietnam and to allocate resources to achieve the target of increasing capital.
credit growth, support for the economy.
Figure 4.2. Net profit and ROA of Vietnamese commercial banks, 2005-2015
Net profit (billion VND)
7000
6000
5000
4000
3000
2000
1000
0
2005 2006 2007 2008 2009 2010 2011 2012 2013 2014 2015
ROA (%)
3%
2%
2%
1%
1%
0%
State Commercial Bank
Joint Stock Commercial Bank
ROANHTMNN
ROANHTMCP
Source: Financial reports of commercial banks, 2005-2015
4.1.2.2. Capital safety of Vietnamese commercial banks
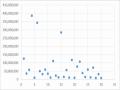
The equity capital of Vietnamese commercial banks has increased over the years (Figure 4.3). Some of the new capital may be virtual capital when shareholders borrow money from one bank to contribute to another bank based on the cross-ownership structure. In the period 2005-2008, with the wave of converting a series of rural banks to urban banks, combined with the roadmap to increase legal capital according to Decree 141/2006/ND-CP, some newly converted banks encountered difficulties when bank stock prices fell sharply after 2008, finding strategic partners was no longer as favorable as before and in order to survive, major shareholders of these banks linked to borrow from each other by mortgaging their shares. When real capital is not much, the safety coefficient will not be real and the bank will face risks if this capital source is not enough to compensate for the risks (Nguyen Xuan Thanh, 2016).
60000
Billion VND
55000
50000
45000
40000
35000
30000
25000
20000
15000
10000
5000
0
Figure 4.3. Equity of Vietnamese commercial banks in 2015 compared to 2005
ABB ACB BID CTG EAB EIB HDB MBB MHB MSB SGB SHB STB TCB VAB VIB VCB VPB OCB SEA BAN NAB NCB PGB KLB LVP PVC MDB AGR SCB TPB NSB
2005 2015
Source: Financial reports of Vietnamese commercial banks, 2005 and 2015
In addition, the capital adequacy ratio of banks is low. By September 2011, the average capital adequacy ratio of the whole system was 11.85%. Figure 4.4 shows that the capital adequacy ratio (CAR) of banks has decreased sharply because the growth rate of total assets has increased faster than the growth rate of equity. This fact is creating pressure to increase capital of some banks. BIDV calculated that at the end of 2015, the CAR ratio was only over 9%, Vietinbank decreased to 10% while total assets increased rapidly by 17.8%.
Figure 4.4. Capital adequacy ratio of Vietnamese commercial banks
15%
15%
14%
14%
13%
13%
12%
12%
14.55%
14.19%
14.11 1 % 3.75%
13.65%
13.76%
13.25%
12.80%
13.28%
12.95%
Minimum capital adequacy ratio (%)
Source: State Bank (2015)
Comparing the 2014 data in Figure 4.5, Vietnam's CAR ratio of 12.80% is still low compared to other countries in the region such as Korea (14.5%), Malaysia (14.6%), Philippines (17%), Singapore (16.4%) although the Vietnamese commercial banking system has achieved the minimum capital adequacy ratio required by the State Bank of Vietnam, which is 9%.
Figure 4.5. CAR ratio of some countries (December 31, 2014)
25%
20%
19.80
15.20
17.00 16.40 15.60
15%
10%
5%
0%
11.60
12.20
12:30
14.50 14.60
14.40
12.80
Source: Website Bizlive.vn. 2015
4.1.2.3. Credit growth of Vietnamese commercial banks
- Credit size
The growth of commercial banks in the period 2005-2015 is shown in Figure 4.6. Within 11 years, the total outstanding credit of the state-owned commercial banks and joint-stock commercial banks increased by 7.1 times and 26 times, respectively. The total assets of the joint-stock commercial banks increased by 13.2 times during this period, because in addition to lending, joint-stock commercial banks also promoted securities investment and investment trust. The total assets of joint-stock commercial banks were equivalent to those of state-owned commercial banks in 2015.
Figure 4.6. Total assets and outstanding credit of state-owned and joint-stock commercial banks, 2005-2015
Source: Financial statements of commercial banks, 2005, 2010 and 2015.
The credit boom in the period 2006-2010 was due to the following reasons: First, this was the result of extremely loose monetary policy. In 2008, inflation increased and the M2 money supply also increased. This led to a large growth in the loan portfolio. In 2010, the debt/GDP ratio reached 96.3%. The consumer price index was unstable and tended to increase. Second, the increase in the number of banks and their operating networks led to strong competition. Small banks relied only on the mobilization and lending segments to make profits, leading to a trend of reducing credit standards, rapidly increasing outstanding debt. Especially when the real estate market was heating up, the trend of reducing credit standards was even greater.
- Credit growth and operational safety
Excessive lending and investment in the period 2006-2010 led to the capital utilization ratio of Vietnamese commercial banks being very high and exceeding the safety level. Credit growth was too fast and faster than capital mobilization for a long time, making a part of banks, especially small-scale banks, dependent on capital from the State Bank and from the interbank market to finance credit expansion and liquidity shortages. Figure 4.7 shows that the ratio of outstanding loans to mobilized capital of Vietnamese commercial banks is very high, with the highest levels in 2009 and 2012.