average banking system. Through observation of the table, it can be seen that credit growth rate and mobilization growth rate have an impact and are affected by the economic growth rate.
Regarding the loan-to-deposit ratio (LDR), this is one of the safety ratios commonly used by many countries in the world, used to evaluate the ability of banks to repay depositors and other creditors without excessive costs, while maintaining capital growth. An increase in LDR shows that banks have fewer resources to finance growth and requires credit tightening, which will lead to higher interest rates.
During the period 2007-2013, the lending/mobilization ratio of commercial banks fluctuated from 70% - 90%. According to Circular No. 13/2010/TT-NN, the State Bank stipulates the lending/mobilization ratio is 80%.. Thus, it can be seen that in 2013, CTG, BID, EIB, VCB, SHB, STB banks ensured this ratio.
Based on the liquid assets in Table 2.5, we see that ACB, STB, SHB, BID have quite low liquidity. Meanwhile, MBB has the highest liquidity.
Loan/Deposit Ratio 2009-2013
160%
140%
120%
100%
80%
60%
40%
20%
0%
2009
2010
2011
2012
2013
ACB CTG BID EIB MBB NVB VCB SHB STB
Figure 2.4 Loan/Deposit ratio of State-owned commercial banks 2009-2013
(Source: Financial statements of banks, author's synthesis) Thus, it can be seen that CTG, EIB, VCB have high loan/deposit ratios but still ensure liquidity. Proving the governance structure between loans
Mobilizing and lending short, medium and long term is quite good.
2.3. Current status of profitability ratios at Vietnamese joint stock commercial banks
2.3.1. Profitability ratio situation at Vietnamese Joint Stock Commercial Banks
Business performance
In 2012 and 2013, the total profit of 9 listed banks reached over 21 trillion VND. The total profit of the entire Vietnamese banking system in 2012 was 28.6 trillion VND according to the report from the State Bank of Vietnam, so the total profit of 9 listed banks reached over 73% of the profit of the entire banking system. Some banks had lower business results in 2013 compared to 2012 such as: CTG, EIB, MBB, VCB, SHB.
Most banks have a structure that is still heavily dependent on credit activities, with the interest/income ratio of some banks reaching 90.71% (NVB). Ranked second in terms of income contribution is net interest from service activities.
Income structure of banks in 2013
100%
Other
Unit:
80%
Income from capital contribution, share purchase
Net income from other activities
60%
40%
20%
0%
ACB CTG BID EIB MBB NVB VCB SHB STB
Net profit/loss from trading investment securities
Net profit/loss from trading securities
Net profit/loss from foreign exchange and gold trading activities
Net profit from service activities
Net interest income
-20%
Figure 2.5: Income structure of joint stock commercial banks in 2013
(Source: BCTN of banks, author's synthesis)
2013 is still considered a difficult year for the banking system, especially as banks have to worry about bad debts, leading to higher credit provisioning and decreasing profits.
Return on assets (ROA)
Return on assets 2009-2013
2.00%
1.80%
1.60%
1.40%
1.38%
1.27%
1.20%
1.00%
0.80%
0.60%
0.40%
0.20%
0.00%
1.01%
0.93%
0.74%
0.59%
0.30%
0.39%
2009
2010
2011
2012
2013
0.06%
ACB CTG BID EIB MBB NVB VCB SHB STB
Figure 2.6: Return on assets at state-owned commercial banks in the period 2009 - 2013
(Source: BCTN of banks, author's synthesis)
Through Figure 2.6, it can be seen that ROA of State-owned commercial banks tends to decrease gradually over the years. In general, ROA in 3 years 2009, 2010, 2011 of all banks is quite high. Through 2011, 2012, ROA tends to decrease more sharply. Only some banks still maintain their performance such as CTG, BID, MBB, VCB. Some banks decrease sharply such as ACB, EIB, NVB. Some tend to increase and decrease unevenly such as SHB, STB.
The reason for the change in ROA is that in the period 2009-2011, the domestic economy was affected by the global economic recession. In 2012, the number of bad debts increased, banks were greatly affected by bad debts in real estate, leading to ineffective business operations, especially NVB, with an extremely low ROA. In addition, banks also face unique risks such as ACB, due to the influence of some individuals who committed violations, leading to a decline in the image, reputation, and brand of the bank; gold and foreign exchange trading activities also decreased sharply, leading to a sharp decline in ACB's profits. For EIB, ROA in 2013 was 0.39%, down nearly 70% compared to 2012, the ratio of bad debt to total outstanding debt remained at 1.61% in 2011, 1.31% in 2012 and increased to 1.98% at the end of the year.
2013, led to an increase in credit risk provisions, reducing profits, and the bank also failed to complete its plan to increase charter capital by 756 billion VND.
Return on equity (ROE)
Return on equity 2009-2013
30.00%
25.00%
20.00%
2009
15.09%
15.00%
12.64%
13.14%
10.70% 10.38%
2010
2011
10.00% 8.21%
6.61%
5.00%
4.49%
0.58%
2012
2013
0.00%
ACB
CTG
BID
EIB
MBB NVB
VCB
SHB
STB
Figure 2.7: Equity return ratio at state-owned commercial banks in the period 2007 - 2013
(Source: BCTN of banks, author's synthesis)
In general, ROE in banks in the period 2009 - 2011 remained stable or increased. In 2012, ROE of banks continued to decrease except SHB. In 2013, some banks increased ROE such as ACB, BID, STB, while the rest of the banks tended to decrease.
In summary, ROA and ROE in banks over the years are generally not steady, which proves that there are still potential instabilities in the business operations of banks and the banking system. MBB is the bank with the best ROA and ROE, always maintained and stable over the years.
Some other indicators for evaluating bank profits
In addition to evaluating profits by ROA and ROE, some other indicators can be evaluated to have a more general view of banks' profits.
Table 2.3. Some other indicators on evaluating the profit of commercial banks in 2007-2013 .
Unit %
ACB | CTG | BID | EIB | MBB | NVB | VCB | SHB | STB | ||
Interest margin ratio | 2007 | 1.54 | 2.82 | 2.37 | 2.03 | 2.14 | 6.77 | 20.76 | 0.72 | 1.78 |
2008 | 2.59 | 3.71 | 2.53 | 2.74 | 3.20 | 1.95 | 1.66 | 1.12 | 1.68 | |
2009 | 1.67 | 3.25 | 2.35 | 3.02 | 2.66 | 1.54 | 2.54 | 2.34 | 2.21 | |
2010 | 2.17 | 3.29 | 2.51 | 2.20 | 3.21 | 2.45 | 2.66 | 2.38 | 2.26 | |
2011 | 2.35 | 4.35 | 3.11 | 2.89 | 3.76 | 3.29 | 3.39 | 2.67 | 3.92 | |
2012 | 2.44 | 3.66 | 1.90 | 2.88 | 3.79 | 3.39 | 2.64 | 1.61 | 4.27 | |
2013 | 1.60 | 3.17 | 2.54 | 1.61 | 3.38 | 2.05 | 2.30 | 1.46 | 4.11 | |
Non-interest margin | 2007 | 2.00 | 1.18 | 1.44 | 0.98 | 1.33 | 1.40 | 7.54 | 1.40 | 2.00 |
2008 | 1.44 | 0.78 | 0.54 | 1.19 | 0.93 | 0.54 | 0.81 | 2.20 | 1.91 | |
2009 | 1.29 | 0.72 | 0.92 | 0.92 | 1.01 | 0.99 | 1.09 | 0.79 | 1.72 | |
2010 | 0.69 | 0.75 | 0.63 | 0.60 | 0.52 | 0.18 | 1.08 | 0.53 | 0.99 | |
2011 | 0.37 | 0.51 | 0.68 | 0.51 | (0.05) | (0.24) | 0.67 | 0.47 | 0.72 | |
2012 | (0.37) | 0.89 | 0.47 | 0.29 | 0.65 | 0.05 | 1.00 | 0.91 | 0.23 | |
2013 | 0.46 | 0.82 | 0.96 | 0.30 | 0.85 | 0.21 | 1.01 | 0.18 | 0.60 | |
Operating profit margin | 2007 | 58.26 | 17.29 | 19.61 | 45.58 | 46.72 | 9.23 | 41.76 | 51.04 | 75.90 |
2008 | 52.15 | 20.75 | 23.84 | 37.58 | 42.50 | 21.11 | 27.75 | 40.77 | 40.33 | |
2009 | 44.35 | 29.69 | 34.61 | 43.95 | 44.23 | 30.14 | 43.33 | 37.02 | 40.94 | |
2010 | 42.53 | 23.18 | 32.74 | 49.45 | 42.69 | 29.81 | 37.38 | 33.26 | 38.60 | |
2011 | 41.95 | 27.98 | 20.76 | 48.72 | 37.21 | 24.23 | 28.35 | 33.79 | 30.85 | |
2012 | 13.44 | 26.97 | 22.39 | 39.70 | 29.69 | 0.29 | 29.47 | 57.40 | 14.63 | |
2013 | 14.63 | 25.24 | 21.09 | 20.27 | 29.84 | 2.81 | 28.27 | 35.88 | 29.07 |
Maybe you are interested!
-
 Current status of investment activities in bond trading of Vietnam Commercial Bank
 -
 Current Status of Credit Risk Management at Vietnam Bank for Agriculture and Rural Development
 -
 Current status of credit risk at Saigon Thuong Tin Commercial Joint Stock Bank, Lam Dong branch - 1
 -
 Assessment of the Current Status of Access to Bank Credit Capital of Small and Medium Enterprises in Thai Nguyen Area in the Period of 2013 - 2018
 -
 Current Status of Credit Risk Management for Individual Customers at Vietnam Technological and Commercial Joint Stock Bank - Thai Nguyen Branch
(Source: BCTN of banks, author's synthesis)
Through table 2.3, it can be seen that:
Net interest margin (NIM): tends to increase in the period 2007-2009, from 2010-2013 it tends to increase slightly. CTG and STB are the 2 banks with the highest ratio, especially STB has this ratio continuously increasing over the years.
Non-interest margin (MN) ratio: VCB, CTG, BID and MBB are the banking groups with the highest MN ratio in 2013.
Operating profit margin (NPM): This indicator tends to decrease over the years. In some banks, it decreased slightly such as EIB, CTG, MBB, and the bank with the strongest decrease was: ACB. Since 2011, this ratio reached 41.95%, down to 13.44% in 2012. EIB, SHB, VCB, MBB are the group of banks with the highest MPN ratio in 2013. In general, banks have quite effective cost management activities, the average profit level is about 20 - 25%, only NVB is the bank with the least effective operation.
2.3.2. Current status of factors affecting profitability at Vietnamese joint stock commercial banks
2.3.2.1. Micro factors Regarding scale
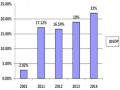
The asset scale of State-owned commercial banks has had impressive growth in the period 2007-2013. The total assets of State-owned commercial banks in 2010 increased 2 times compared to 2007, the value increased from 803 trillion VND to 1,687 trillion VND, the total assets in 2013 increased 3 times compared to 2007. Total assets in 2013 reached 2,552 billion VND.
In general, bank assets have increased over the years. The largest bank is CTG with 576 trillion VND, followed by BID with more than 548 trillion VND, followed by VCB with nearly 469 trillion VND; MBB also reached 180 trillion VND. This is a group of state-owned commercial banks that have been equitized, with the State share still accounting for over 50%. In the group of remaining banks, ACB is the largest in terms of asset size with 274 trillion VND, the lowest is NVB with 29 trillion VND.
Asset growth 2007-2013
Unit: billion VND
700,000
600,000
CAGR
23%
17.9%
500,000
15.5%
400,000
21.5%
300,000
200,000
30.9
%
35.1%
50.5%
16.5%
100,000
19.7%
2007
2008
2009
2010
2011
2012
2013
0
ACB CTG BID
EIB MBB NVB VCB SHB STB
CAGR
CAGR
CAGR
Figure 2.8: Asset growth 2007-2013
(Source: BCTN of banks, author's synthesis)
In terms of average asset growth rate (CAGR), small and medium-sized banks usually have higher growth rates. SHB has the highest growth rate of 50.5%, partly due to SHB's merger with Hanoi Housing Commercial Joint Stock Bank (Habubank) in 2012, significantly increasing its scale. MBB and EIB also have quite high CAGRs, the lowest is STB with a CAGR of 16.5%.
Compared with the average growth rate of after-tax profits of banks in the period 2007-2013, it can be seen that SHB with the fastest asset growth rate also has the fastest profit growth rate of 46.28%, ranked 2nd in average profit growth rate is CTG with 38.26%, followed by MBB with 35.93%, BID with 21.48%, VCB with 12.71%, the lowest are EIB and STB at 7.29% and 9.78% respectively. NVB and ACB have negative average profit growth rates, in which NVB is the bank with the biggest profit decline. It can be seen that MBB and CTG are the 2 most efficient banks, and are in the growth stage. The profit growth rate is greater than the asset growth rate; Banks BID, VCB, SHB all operate well, profit growth rate is equivalent to or a few percentage points higher than asset growth rate. EIB, STB, ACB,
NVB has a much lower profit growth rate than asset growth rate, which will reduce the bank's ROA.
About capital scale
Although the charter capital of the State-owned commercial banks in the survey period had a high growth rate, there was an unevenness in the charter capital level among the banks. In 2013, the highest charter capital in the group belonged to CTG and the lowest belonged to NVB, the difference between these two banks was 12 times.
In general, the equity/total assets ratio of banks in 2013 was around 8%-10%, some banks had higher ratios such as NVB, STB at nearly 11% and 10.5%; some banks had lower ratios such as ACB at around 4.56%, BID at 6%. CTG, VCB, EIB, MBB, SHB banks were at 9.38%, 8.99%, 8.64%, 8.4% and 7.21% respectively.
Compared with ROA and ROE, the highest still belongs to MBB at 1.27% and 15.09%. MBB's equity/total assets ratio is 8.4%, which is average compared to other banks. Meanwhile, NVB has the highest equity/total assets ratio but the lowest ROA and ROE. ACB has a low equity/total assets ratio, ACB's ROA and ROE are also not high, only about 0.3% and 6.61%; CTG, BID, SHB, and VCB banks have an average ROE of 8-10%. Thus, if we do not consider the influence of other factors, it can be seen that banks with an average equity/total assets ratio of 8-9% operate more effectively.
About net interest income
In general, the net interest income of banks is divided into 2 periods. In the period 2007-2012, net interest income increased, in the period 2011-2013, net interest income tended to decrease. In 2013, the largest ratio of net interest income/assets was STB at 4.11%, followed by MBB at 3.38%, CTG at 3.17%. However, compared to 2012, this ratio decreased in all banks except BID which increased from 1.9% to 2.54%, the reason being that the interest rate difference was tending to decrease, reducing the net interest income of banks.