The same applies to all hotel locations. The reality is that city hotels tend to have higher labor costs due to higher occupancy levels than other hotel groups, assuming that taxes remain unchanged.
Research shows that, in addition to factors such as size and accommodation class, the location of the hotel is also a factor that creates different levels of profit. Therefore, city hotels are the most profitable, with profits before tax, interest and financial costs accounting for more than 30% of revenue, while coastal resort hotels are the least profitable, at only about 17%. The difference is partly due to accommodation services, with estimates showing that accommodation services account for up to 80% of profits in city hotels compared to only 60% in coastal resorts. This makes material costs (food and beverage) account for a much smaller proportion of the total cost structure in city hotels than in hotels in other areas. Moreover, some city hotels (London, Tokyo, ...) provide accommodation services only without breakfast included. Analysis of Table 7.9 shows the difference in profit on the basis of cost of accommodation and catering business.
Hotels with a high revenue reliance on beverage sales, particularly those in less populated urban areas and coastal resorts, have the lowest profits. However, hotels in urban areas may face higher financing and other similar costs. These hotels must meet different demand patterns depending on their location. Meanwhile, motels have a relatively high reliance on food and beverage sales, which shows a clearer distinction between hotels and motels. This also provides a basis for hotels with low occupancy rates to shift to other products that generate higher revenues. Rural hotels with low occupancy rates should have profits that depend mainly on food sales.
Table 7.9. Costs and profits based on location (% of revenue)
London | Urban with over 100,000 People | Urban with less than 100,000 People | Countryside Resort | Beach Resort | Motel | |
Business | ||||||
Room | 54.2 | 34.7 | 18 | 25.7 | 27.3 | 34.2 |
Food | 23.4 | 31.3 | 32.7 | 35.8 | 31.3 | 32.5 |
Bar | 10.9 | 24.1 | 43.8 | 30.6 | 35 | 26 |
Other | 11.5 | 9.9 | 5.5 | 7.9 | 6.4 | 7.3 |
Expense | ||||||
Raw materials | 13 | 25.6 | 41.4 | 33.4 | 34.8 | 29.2 |
Labor | 28.1 | 28.5 | 26.4 | 27.8 | 25.5 | 28.8 |
Other | 25.6 | 21.9 | 13.5 | 17.9 | 22.7 | 20 |
Earnings before taxes, fees and interest | 33.3 | 24 | 18.7 | 20.9 | 17 | 23 |
Maybe you are interested!
-

 Solutions for tourism development in Tien Lang - 10
zt2i3t4l5ee
zt2a3gstourism, tourism development
zt2a3ge
zc2o3n4t5e6n7ts
- District People's Committees and authorities of communes with tourist attractions should support, promote, and provide necessary information to people, helping them improve their knowledge about tourism. Raise tourism awareness for local people.
*
* *
Due to limited knowledge and research time, the thesis inevitably has shortcomings. Therefore, I look forward to receiving guidance from teachers, experts as well as your comments to make the thesis more complete.
Chapter III Conclusion
Through the issues presented in Chapter II, we can come to some conclusions:
Based on the strengths of available tourism resources, the types of tourism in Tien Lang that need to be promoted in the coming time are sightseeing and resort tourism, discovery tourism, weekend tourism. To improve the quality and diversify tourism products, Tien Lang district needs to combine with local cultural tourism resources, at the same time combine with surrounding areas, build rich tourism products. The strengths of Tien Lang tourism are eco-tourism and cultural tourism, so developing Tien Lang tourism must always go hand in hand with restoring and preserving types of cultural tourism resources. Some necessary measures to support and improve the efficiency of exploiting tourism resources in Tien Lang are: strengthening the construction of technical facilities and labor force serving tourism, actively promoting and advertising tourism, and expanding forms of capital mobilization for tourism development.
CONCLUDE
I Conclusion
1. Based on the results achieved within the framework of the thesis's needs, some basic conclusions can be drawn as follows:
Tien Lang is a locality with great potential for tourism development. The relatively abundant cultural tourism resources and ecological tourism resources have great appeal to tourists. Based on this potential, Tien Lang can build a unique tourism industry that is competitive enough with other localities within Hai Phong city and neighboring areas.
In recent years, the exploitation of the advantages of resources to develop tourism and build tourist routes in Tien Lang has not been commensurate with the available potential. In terms of quantity, many resource objects have not been brought into the purpose of tourism development. In terms of time, the regular service time has not been extended to attract more visitors. Infrastructure and technical facilities are still weak. The labor force is still thin and weak in terms of expertise. Tourism programs and routes have not been organized properly, the exploitation content is still monotonous, so it has not attracted many visitors. Although resources have not been mobilized much for tourism development, they are facing the risk of destruction and degradation.
2. Based on the results of investigation, analysis, synthesis, evaluation and selective absorption of research results of related topics, the thesis has proposed a number of necessary solutions to improve the efficiency of exploiting tourism resources in Tien Lang such as: promoting the restoration and conservation of tourism resources, focusing on investment and key exploitation of ecotourism resources, strengthening the construction of infrastructure and tourism workforce. Expanding forms of capital mobilization. In addition, the thesis has built a number of tourist routes of Hai Phong in which Tien Lang tourism resources play an important role.
Exploiting Tien Lang tourism resources for tourism development is currently facing many difficulties. The above measures, if applied synchronously, will likely bring new prospects for the local tourism industry, contributing to making Tien Lang tourism an important economic sector in the district's economic structure.
REFERENCES
1. Nhuan Ha, Trinh Minh Hien, Tran Phuong, Hai Phong - Historical and cultural relics, Hai Phong Publishing House, 1993
2. Hai Phong City History Council, Hai Phong Gazetteer, Hai Phong Publishing House, 1990.
3. Hai Phong City History Council, History of Tien Lang District Party Committee, Hai Phong Publishing House, 1990.
4. Hai Phong City History Council, University of Social Sciences and Humanities, VNU, Hai Phong Place Names Encyclopedia, Hai Phong Publishing House. 2001.
5. Law on Cultural Heritage and documents guiding its implementation, National Political Publishing House, Hanoi, 2003.
6. Tran Duc Thanh, Lecture on Tourism Geography, Faculty of Tourism, University of Social Sciences and Humanities, VNU, 2006
7. Hai Phong Center for Social Sciences and Humanities, Some typical cultural heritages of Hai Phong, Hai Phong Publishing House, 2001
8. Nguyen Ngoc Thao (editor-in-chief, Tourism Geography, Hai Phong Publishing House, two volumes (2001-2002)
9. Nguyen Minh Tue and group of authors, Hai Phong Tourism Geography, Ho Chi Minh City Publishing House, 1997.
10. Nguyen Thanh Son, Hai Phong Tourism Territory Organization, Associate Doctoral Thesis in Geological Geography, Hanoi, 1996.
11. Decision No. 2033/QD – UB on detailed planning of Tien Lang town, Hai Phong city until 2020.
12. Department of Culture, Information, Hai Phong Museum, Hai Phong relics
- National ranked scenic spot, Hai Phong Publishing House, 2005. 13. Tien Lang District People's Committee, Economic Development Planning -
Culture - Society of Tien Lang district to 2010.
14.Website www.HaiPhong.gov.vn
APPENDIX 1
List of national ranked monuments
STT
Name of the monument
Number, year of decisiondetermine
Location
1
Gam Temple
938 VH/QĐ04/08/1992
Cam Khe Village- Toan Thang commune
2
Doc Hau Temple
9381 VH/QĐ04/08/1992
Doc Hau Village –Toan Thang commune
3
Cuu Doi Communal House
3207 VH/QĐDecember 30, 1991
Zone II of townTien Lang
4
Ha Dai Temple
938 VH/QĐ04/08/1992
Ha Dai Village –Tien Thanh commune
APPENDIX II
STT
Name of the monument
Number, year of decision
Location
1
Phu Ke Pagoda Temple
178/QD-UBJanuary 28, 2005
Zone 1 - townTien Lang
2
Trung Lang Temple
178/QD-UBJanuary 28, 2005
Zone 4 – townTien Lang
3
Bao Khanh Pagoda
1900/QD-UBAugust 24, 2006
Nam Tu Village -Kien Thiet commune
4
Bach Da Pagoda
1792/QD-UB11/11/2002
Hung Thang Commune
5
Ngoc Dong Temple
177/QD-UBNovember 27, 2005
Tien Thanh Commune
6
Tomb of Minister TSNhu Van Lan
2848/QD-UBSeptember 19, 2003
Nam Tu Village -Kien Thiet commune
7
Canh Son Stone Temple
2160/QD-UBSeptember 19, 2003
Van Doi Commune –Doan Lap
8
Meiji Temple
2259/QD-UBSeptember 19, 2002
Toan Thang Commune
9
Tien Doi Noi Temple
477/QD-UBSeptember 19, 2005
Doan Lap Commune
10
Tu Doi Temple
177/QD-UBJanuary 28, 2005
Doan Lap Commune
11
Duyen Lao Temple
177/QD-UBJanuary 28, 2005
Tien Minh Commune
12
Dinh Xuan Uc Pagoda
177/QD-UBJanuary 28, 2005
Bac Hung Commune
13
Chu Khe Pagoda
177/QD-UBJanuary 28, 2005
Hung Thang Commune
14
Dong Dinh
2848/QD-UBNovember 21, 2002
Vinh Quang Commune
15
President's Memorial HouseTon Duc Thang
177/QD-UBJanuary 28, 2005
NT Quy Cao
Ha Dai Temple
Ben Vua Temple
Tien Lang hot spring
div.maincontent .p { color: black; font-family:"Times New Roman", serif; font-style: normal; font-weight: normal; text-decoration: none; font-size: 14pt; margin:0pt; } div.maincontent p { color: black; font-family:"Times New Roman", serif; font-style: normal; font-weight: normal; text-decoration: none; font-size: 14pt; margin:0pt; } div.maincontent .s1 { color: black; font-family:"Times New Roman", serif; font-style: normal; font-weight: normal; font-size: 16pt; } div.maincontent .s2 { color: black; font-family:"Times New Roman", serif; font-style: italic; font-weight: bold; text-decoration: none; font-size: 14pt; } div.maincontent .s3 { color: black; font-family:"Times New Roman", serif; font-style: italic; font-weight: normal; text-decoration: none; font-size: 14pt; } div.maincontent .s4 { color: black; font-family:"Times New Roman", serif; font-style: normal; font-weight: normal; font-size: 14pt; } div.maincontent .s5 { color: black; font-family:"Times New Roman", serif; font-style: normal; font-weight: bold; font-size: 14pt; } div.maincontent .s6 { color: black; font-family:"Times New Roman", serif; font-style: normal; font-weight: normal; text-decoration: none; font-size: 14pt; } div.maincontent .s7 { color: black; font-family:"Times New Roman", serif; font-style: normal; font-weight: bold; text-decoration: none; font-size: 14pt; } div.maincontent .s8 { color: black; font-family:"Times New Roman", serif; font-style: normal; font-weight: normal; text-decoration: none; font-size: 9pt; vertical-align: 6pt; } div.maincontent .s9 { color: black; font-family:"Times New Roman", serif; font-style: normal; font-weight: bold; text-decoration: none; font-size: 12pt; } div.maincontent .s11 { color: black; font-family:"Times New Roman", serif; font-style: normal; font-weight: normal; tex
Solutions for tourism development in Tien Lang - 10
zt2i3t4l5ee
zt2a3gstourism, tourism development
zt2a3ge
zc2o3n4t5e6n7ts
- District People's Committees and authorities of communes with tourist attractions should support, promote, and provide necessary information to people, helping them improve their knowledge about tourism. Raise tourism awareness for local people.
*
* *
Due to limited knowledge and research time, the thesis inevitably has shortcomings. Therefore, I look forward to receiving guidance from teachers, experts as well as your comments to make the thesis more complete.
Chapter III Conclusion
Through the issues presented in Chapter II, we can come to some conclusions:
Based on the strengths of available tourism resources, the types of tourism in Tien Lang that need to be promoted in the coming time are sightseeing and resort tourism, discovery tourism, weekend tourism. To improve the quality and diversify tourism products, Tien Lang district needs to combine with local cultural tourism resources, at the same time combine with surrounding areas, build rich tourism products. The strengths of Tien Lang tourism are eco-tourism and cultural tourism, so developing Tien Lang tourism must always go hand in hand with restoring and preserving types of cultural tourism resources. Some necessary measures to support and improve the efficiency of exploiting tourism resources in Tien Lang are: strengthening the construction of technical facilities and labor force serving tourism, actively promoting and advertising tourism, and expanding forms of capital mobilization for tourism development.
CONCLUDE
I Conclusion
1. Based on the results achieved within the framework of the thesis's needs, some basic conclusions can be drawn as follows:
Tien Lang is a locality with great potential for tourism development. The relatively abundant cultural tourism resources and ecological tourism resources have great appeal to tourists. Based on this potential, Tien Lang can build a unique tourism industry that is competitive enough with other localities within Hai Phong city and neighboring areas.
In recent years, the exploitation of the advantages of resources to develop tourism and build tourist routes in Tien Lang has not been commensurate with the available potential. In terms of quantity, many resource objects have not been brought into the purpose of tourism development. In terms of time, the regular service time has not been extended to attract more visitors. Infrastructure and technical facilities are still weak. The labor force is still thin and weak in terms of expertise. Tourism programs and routes have not been organized properly, the exploitation content is still monotonous, so it has not attracted many visitors. Although resources have not been mobilized much for tourism development, they are facing the risk of destruction and degradation.
2. Based on the results of investigation, analysis, synthesis, evaluation and selective absorption of research results of related topics, the thesis has proposed a number of necessary solutions to improve the efficiency of exploiting tourism resources in Tien Lang such as: promoting the restoration and conservation of tourism resources, focusing on investment and key exploitation of ecotourism resources, strengthening the construction of infrastructure and tourism workforce. Expanding forms of capital mobilization. In addition, the thesis has built a number of tourist routes of Hai Phong in which Tien Lang tourism resources play an important role.
Exploiting Tien Lang tourism resources for tourism development is currently facing many difficulties. The above measures, if applied synchronously, will likely bring new prospects for the local tourism industry, contributing to making Tien Lang tourism an important economic sector in the district's economic structure.
REFERENCES
1. Nhuan Ha, Trinh Minh Hien, Tran Phuong, Hai Phong - Historical and cultural relics, Hai Phong Publishing House, 1993
2. Hai Phong City History Council, Hai Phong Gazetteer, Hai Phong Publishing House, 1990.
3. Hai Phong City History Council, History of Tien Lang District Party Committee, Hai Phong Publishing House, 1990.
4. Hai Phong City History Council, University of Social Sciences and Humanities, VNU, Hai Phong Place Names Encyclopedia, Hai Phong Publishing House. 2001.
5. Law on Cultural Heritage and documents guiding its implementation, National Political Publishing House, Hanoi, 2003.
6. Tran Duc Thanh, Lecture on Tourism Geography, Faculty of Tourism, University of Social Sciences and Humanities, VNU, 2006
7. Hai Phong Center for Social Sciences and Humanities, Some typical cultural heritages of Hai Phong, Hai Phong Publishing House, 2001
8. Nguyen Ngoc Thao (editor-in-chief, Tourism Geography, Hai Phong Publishing House, two volumes (2001-2002)
9. Nguyen Minh Tue and group of authors, Hai Phong Tourism Geography, Ho Chi Minh City Publishing House, 1997.
10. Nguyen Thanh Son, Hai Phong Tourism Territory Organization, Associate Doctoral Thesis in Geological Geography, Hanoi, 1996.
11. Decision No. 2033/QD – UB on detailed planning of Tien Lang town, Hai Phong city until 2020.
12. Department of Culture, Information, Hai Phong Museum, Hai Phong relics
- National ranked scenic spot, Hai Phong Publishing House, 2005. 13. Tien Lang District People's Committee, Economic Development Planning -
Culture - Society of Tien Lang district to 2010.
14.Website www.HaiPhong.gov.vn
APPENDIX 1
List of national ranked monuments
STT
Name of the monument
Number, year of decisiondetermine
Location
1
Gam Temple
938 VH/QĐ04/08/1992
Cam Khe Village- Toan Thang commune
2
Doc Hau Temple
9381 VH/QĐ04/08/1992
Doc Hau Village –Toan Thang commune
3
Cuu Doi Communal House
3207 VH/QĐDecember 30, 1991
Zone II of townTien Lang
4
Ha Dai Temple
938 VH/QĐ04/08/1992
Ha Dai Village –Tien Thanh commune
APPENDIX II
STT
Name of the monument
Number, year of decision
Location
1
Phu Ke Pagoda Temple
178/QD-UBJanuary 28, 2005
Zone 1 - townTien Lang
2
Trung Lang Temple
178/QD-UBJanuary 28, 2005
Zone 4 – townTien Lang
3
Bao Khanh Pagoda
1900/QD-UBAugust 24, 2006
Nam Tu Village -Kien Thiet commune
4
Bach Da Pagoda
1792/QD-UB11/11/2002
Hung Thang Commune
5
Ngoc Dong Temple
177/QD-UBNovember 27, 2005
Tien Thanh Commune
6
Tomb of Minister TSNhu Van Lan
2848/QD-UBSeptember 19, 2003
Nam Tu Village -Kien Thiet commune
7
Canh Son Stone Temple
2160/QD-UBSeptember 19, 2003
Van Doi Commune –Doan Lap
8
Meiji Temple
2259/QD-UBSeptember 19, 2002
Toan Thang Commune
9
Tien Doi Noi Temple
477/QD-UBSeptember 19, 2005
Doan Lap Commune
10
Tu Doi Temple
177/QD-UBJanuary 28, 2005
Doan Lap Commune
11
Duyen Lao Temple
177/QD-UBJanuary 28, 2005
Tien Minh Commune
12
Dinh Xuan Uc Pagoda
177/QD-UBJanuary 28, 2005
Bac Hung Commune
13
Chu Khe Pagoda
177/QD-UBJanuary 28, 2005
Hung Thang Commune
14
Dong Dinh
2848/QD-UBNovember 21, 2002
Vinh Quang Commune
15
President's Memorial HouseTon Duc Thang
177/QD-UBJanuary 28, 2005
NT Quy Cao
Ha Dai Temple
Ben Vua Temple
Tien Lang hot spring
div.maincontent .p { color: black; font-family:"Times New Roman", serif; font-style: normal; font-weight: normal; text-decoration: none; font-size: 14pt; margin:0pt; } div.maincontent p { color: black; font-family:"Times New Roman", serif; font-style: normal; font-weight: normal; text-decoration: none; font-size: 14pt; margin:0pt; } div.maincontent .s1 { color: black; font-family:"Times New Roman", serif; font-style: normal; font-weight: normal; font-size: 16pt; } div.maincontent .s2 { color: black; font-family:"Times New Roman", serif; font-style: italic; font-weight: bold; text-decoration: none; font-size: 14pt; } div.maincontent .s3 { color: black; font-family:"Times New Roman", serif; font-style: italic; font-weight: normal; text-decoration: none; font-size: 14pt; } div.maincontent .s4 { color: black; font-family:"Times New Roman", serif; font-style: normal; font-weight: normal; font-size: 14pt; } div.maincontent .s5 { color: black; font-family:"Times New Roman", serif; font-style: normal; font-weight: bold; font-size: 14pt; } div.maincontent .s6 { color: black; font-family:"Times New Roman", serif; font-style: normal; font-weight: normal; text-decoration: none; font-size: 14pt; } div.maincontent .s7 { color: black; font-family:"Times New Roman", serif; font-style: normal; font-weight: bold; text-decoration: none; font-size: 14pt; } div.maincontent .s8 { color: black; font-family:"Times New Roman", serif; font-style: normal; font-weight: normal; text-decoration: none; font-size: 9pt; vertical-align: 6pt; } div.maincontent .s9 { color: black; font-family:"Times New Roman", serif; font-style: normal; font-weight: bold; text-decoration: none; font-size: 12pt; } div.maincontent .s11 { color: black; font-family:"Times New Roman", serif; font-style: normal; font-weight: normal; tex -
 Completing the organization of accounting for revenue, sales costs and determining business results at Hai Phong Paint Joint Stock Company - 1
 -
 Tourism Revenue of Yen Tu Area in the Last 5 Years
 -
 Proposing a Model for Developing Community-Based Tourism in Quan Lan Commune, Van Don, Quang Ninh.
 -
 Completing the accounting of revenue, expenses and determining business results at Huong Duong Tourism Development and Service Company - 10
Source: NEDC
When it comes to taxes, many businesses can make or lose money due to the difference in tax rates between corporate income tax and business tax. Hotels that are not run by companies but by individual tenants are usually subject to personal income tax in assessing income, however, the Internal Revenue Service does not differentiate between personal and business income. Typically, personal income tax is lower than corporate income tax (for example, personal income tax is 10% (progressive) while corporate income tax is 20%). This means that self-employment is more profitable, but it depends on the size of the profit. Therefore,
Hotel owners must decide which is more profitable, to be taxed as personal income tax or corporate income tax, to include the manager's taxable income and leave the remaining revenue in the business, or to be subject to corporate income tax. For service businesses, including hotels and restaurants, while the average 80% of property owners pay about 30% of their total revenue in taxes. In general, hotels and catering have historically paid much less tax than other industries due to lower profits and low levels of corporate consolidation, and service industries do not have the same subsidies and tax benefits as manufacturing industries.
In terms of international profitability, comparisons can be made between hotels in European countries (Table 7.10).
Table 7.10. Profits of European countries (Profits as % of sales)
Total average | Belgium | Older brother | France | Virtue | IDEA | Netherlands | Other | |
Average number of rooms | 352 | 292 | 376 | 417 | 352 | 358 | 259 | 310 |
Income | ||||||||
Room | 52.6 | 48.0 | 54.5 | 57.3 | 48.6 | 55.5 | 48.4 | 50.7 |
Food | 27.0 | 30.6 | 26.9 | 26.8 | 26.0 | 25.1 | 31.6 | 26.7 |
Total income | 46.7 | 40.6 | 51.4 | 43.7 | 46.3 | 33.8 | 41.9 | 46.2 |
Total profit | 20.7 | 9.3 | 28.3 | 16.4 | 19.2 | 7.1 | 16.1 | 19.1 |
Source: Trends in the Food and Beverage Industry, Pannell, Kerr, Forster et al.
In the past decade, hotels in the Middle East and South Asia have had high occupancy rates of 78.2% and 74.7%, respectively, and high profitability of 37.1% and 50.6% of total revenue, respectively. European hotels have average occupancy rates of around 64.3% and profitability of 20.7% of total revenue.
income. In fact, in Europe, according to management consultants Pannell, Kerr, Forster and Company Ltd., hotels in the UK are the most profitable with the fastest growth when occupancy is high and some costs such as food and labor are quite low. However, a survey of hotels in major cities shows that the average number of rooms brings a high rate of profit. In European countries, costs for administration, advertising and repairs are quite low, about 23.5% in the UK and 34.2% in Belgium, averaging about 26.8%. In Italy, labor costs are very high, about 49.8%, while administrative costs in Belgium are the highest. Profitability in the UK is due to lower food and labor costs, in addition, tariffs in this country are also lower, about $3 below the European average at $25.98 per room used. International comparisons also show differences between hotels. German hotel guests are twice as likely to buy drinks in their hotel as French guests. The Dutch spend the most on meals in their hotels, and the French the least. English-speaking hotels spend less on bed linen than their European counterparts, but spend the most on crockery and glassware.
European hotels also face a large cost in interest on loans. In the 1980s, 5% of hotel revenues went to repay the original loan principal that was due. Falling interest rates later eased this burden, but those who missed their loan payments were hit with rising interest rates, highlighting the importance of timing.
Another expense that hotels can save is laundry costs. It is estimated that on-site laundry services can save 30% compared to the cost of hiring an outside laundry service and contribute to the hotel's profits, in addition to increasing the amount of linen available for use in the hotel and avoiding loss. On the other hand, the 30% savings is also a figure for hotels to consider whether to add room service and staff costs. However, there are very few hotels that can reduce costs without reducing the quality of the service provided. Food and beverage services are probably the
Savings can be made in the sector, but these changes often involve switching to fresh food, which is difficult to achieve with high-quality customers. The best way to make the most of the costs is to allocate them more to the accommodation sector; this is something that hotels are less able to influence and is more dependent on customer demand. However, this also means that larger hotels will benefit more. This is the basis for larger hotels to increase their occupancy levels. Large hotels can be highly profitable with the most professional management in hotel groups. However, it cannot be concluded that large size corresponds to large profits for hotels in different locations. Hotels with less than 50 rooms have a profit proportional to capital. 30-room hotels can achieve a higher return on capital or revenue, but larger hotels can still make more profit. For example, a small hotel might achieve a 15% return on $200,000 in revenue, or $30,000, but a larger hotel might achieve a 10% return on $500,000 in revenue, or $50,000, which is a higher profit while achieving a lower return on capital or revenue.
In fact, with the impact of the business environment, many hotels continue to operate at low profit levels. In addition, to cope with inflation, many investors have decided to focus on property and land values, increasing revenue and profits, leading to an increase in investment in the industry, to renovate and build hotel rooms. Of which, large companies, led by Trusthouse Forte, invested about 20%. However, as the demand for amenities increases, small hotels will face more difficulties in maintaining profits due to their limited business conditions.
In addition to the costs listed above, there are additional costs such as “downsizing” costs and theft-related costs. These costs can be as high as 10% of total revenue, and employees are responsible for nearly a third of all costs in a hotel. Many hotels around the world are now using this system.
computerized keyless bedroom door locking system and it has brought double advantages. First, it means less theft; and second, it is suitable for foreign customers. Another advantage is reduced insurance premiums.
7.3.2.2. Cost of food service business operations
The main component costs of a restaurant food service business include materials and labor, which are similar to those of a hotel. However, restaurants differ from hotels in that labor costs in a food service business account for only a small percentage of total revenue, averaging 25% of revenue. However, labor costs can vary as a percentage of revenue from restaurant to restaurant (Table 7.11).
Table 7.11. Labor costs as a percentage of sales (%)
Highest | Medium | Lowest | |
Restaurants | 36.0 | 24.7 | 14.6 |
Specialty restaurants | 30.1 | 23.7 | 15.6 |
National Restaurant | 45.0 | 26.8 | 16.0 |
The bars | 23.0 | 22.5 | 22.0 |
Other dining establishments | 32.0 | 25.2 | 16.2 |
Source: Restaurant Labor Costs, R.Kotas
Part of the deciding factor is the impact of labor costs on the restaurant's operating efficiency and the audience it serves. Two restaurants may be equally efficient in many ways, but one will have a higher labor cost as a percentage of total revenue due to operating 24 hours a day.
Estimates show that 24-hour business operations make labor costs about 45% of total costs, while other operations
The business of providing one meal a day costs only about 28% (Table 7.12).
Table 7.12. Food costs (%)
Direct | Indirect | |||||
Food | Chef | Serve | Clean up | Labor | Other | |
Profit 1 meal/day | 43.6 | 5.3 | 9.6 | 7.1 | 6.3 | 28.1 |
Cost of 1 meal/day | 49.9 | 8.6 | 7.0 | 10.2 | 2.2 | 22.1 |
Profit 2 meals/day | 47.2 | 17.3 | 8.5 | 4.9 | 3.3 | 18.8 |
Cost of 2 meals/day | 52.4 | 5.8 | 2.7 | 5.0 | 10.8 | 23.3 |
24h service profit | 47.6 | 16.1 | 16.6 | 8.7 | 6.4 | 4.6 |
24 hour service cost | 52.0 | 18.8 | 15.3 | 6.5 | 3.9 | 3.5 |
Source: Convenience foods in the food industry, NEDC
Cooking and meal preparation do not consume the majority of labor costs, the costs associated with serving are the same, so the main reason is thought to be the salaries of the chef and cooks. Serving costs can account for up to 16% of total costs and therefore savings can be made by combining serving with self-service. Self-service in restaurants has become more common and restaurants will save on overtime pay for staff, etc. Food accounts for the majority of total costs, often accounting for about half of a restaurant's costs.
This means that the cost structure of restaurants is oriented towards variable costs rather than fixed costs and profits are derived from seating capacity and the defined number of meals served.
For example, in Figure 7.11, variable costs (total costs minus fixed costs) remain the same and change with the number of meals served.
fixed costs increase. The score at OQ 2 rather than OQ 1 assumes that revenue remains the same and also corresponds to the number of meals served. As mentioned above, restaurants typically lease equipment rather than purchase new investments, so depreciation on equipment is typically less than 3% of total costs. Thus, equipment rental costs, along with rent and insurance, may account for only about 1/5 of total restaurant costs.
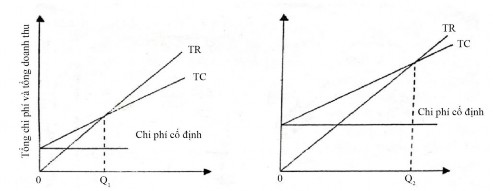
Figure 7.11. The importance of the ratio of fixed costs to variable costs
There is a difference in the allocation of costs between the commercial and non-commercial sectors of the industry, as the latter are very expensive due to their usual focus on providing low-cost meals to customers and consequently have rigid pricing policies. In practice, non-commercial providers may be completely free and subsidised units may have very loose criteria. While 90% of catering companies provide criteria and guidelines for non-commercial restaurant managers, many do not bother to do so. Very few consider budget issues. This does not reflect inefficiency on the part of non-commercial caterers but rather reflects a desire to provide more low-cost meals to employees. The aim is to create better relationships with employees and for some employers in