1995 and 2007 reached 43.50% of total development investment capital, the annual average during this period reached 36.38%.
Source: General Statistics Office 2007
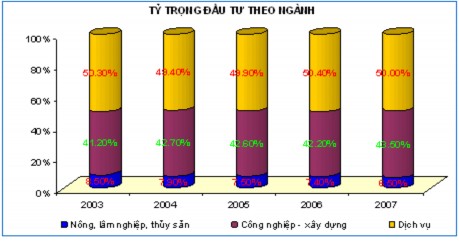
Chart 2.2 : Investment proportion by industry in the period 2003-2007
Especially since 2003, the proportion of investment in the economic sector has not changed much. The proportion of investment in the agricultural sector accounts for a relatively small proportion. The proportion of investment in the industrial-construction and service sectors is quite high. Increasing investment in the industrial-construction and service sectors aims to transform the economic structure. However, the speed of transforming the economic structure of Vietnam is still slow. Due to the impact of the market, the service sector's investment structure is focused on developing based on the strengths of each region, the proportion of the industrial and agricultural sectors tends to decrease. Along with increasing the volume and growth rate of investment in social development, the issue of increasing the efficiency of using investment capital for the state economic sector.
2.2.2. Shifting the economic structure of the sector according to the United Nations' sectoral classification
Compared with the United Nations' sectoral classification, there has been a shift in the macro-economic sectoral structure in our country. As of 2007, the economic sectoral structure in our country has shifted, sector I is still too high.
accounting for over 30.05% of GDP, sector II (processing industry) is still low at 21.38% and sector III is 48.57%. Each year, sector I decreases by 0.68%, only half of the combined growth of both industry and construction according to Vietnam's statistical classification; sector III increases by 0.24%/year due to the strong increase in electricity, water supply and construction in recent times (see table 2.3).
Table 2.3: Vietnam's economic sector GDP structure (%) by sector of the United Nations
Year
Area I | Region II | Region III | |
1990 | 43.95 | 12.26 | 43.79 |
1995 | 31.99 | 14.99 | 53.01 |
2000 | 34.18 | 18.56 | 47.25 |
2001 | 32.45 | 19.78 | 47.75 |
2002 | 31.64 | 20.58 | 47.77 |
2003 | 31.88 | 20.45 | 47.66 |
2004 | 31.93 | 20.32 | 47.75 |
2005 | 31.57 | 20.63 | 47.80 |
2006 | 30.63 | 21.25 | 48.12 |
2007 | 30.05 | 21.38 | 48.57 |
Maybe you are interested!
-
 Economic Sector Structure of Cat Hai District in the Period 2009-2015 (%)
 -
 Solutions for tourism development in Tien Lang - 10
zt2i3t4l5ee
zt2a3gstourism, tourism development
zt2a3ge
zc2o3n4t5e6n7ts
- District People's Committees and authorities of communes with tourist attractions should support, promote, and provide necessary information to people, helping them improve their knowledge about tourism. Raise tourism awareness for local people.
*
* *
Due to limited knowledge and research time, the thesis inevitably has shortcomings. Therefore, I look forward to receiving guidance from teachers, experts as well as your comments to make the thesis more complete.
Chapter III Conclusion
Through the issues presented in Chapter II, we can come to some conclusions:
Based on the strengths of available tourism resources, the types of tourism in Tien Lang that need to be promoted in the coming time are sightseeing and resort tourism, discovery tourism, weekend tourism. To improve the quality and diversify tourism products, Tien Lang district needs to combine with local cultural tourism resources, at the same time combine with surrounding areas, build rich tourism products. The strengths of Tien Lang tourism are eco-tourism and cultural tourism, so developing Tien Lang tourism must always go hand in hand with restoring and preserving types of cultural tourism resources. Some necessary measures to support and improve the efficiency of exploiting tourism resources in Tien Lang are: strengthening the construction of technical facilities and labor force serving tourism, actively promoting and advertising tourism, and expanding forms of capital mobilization for tourism development.
CONCLUDE
I Conclusion
1. Based on the results achieved within the framework of the thesis's needs, some basic conclusions can be drawn as follows:
Tien Lang is a locality with great potential for tourism development. The relatively abundant cultural tourism resources and ecological tourism resources have great appeal to tourists. Based on this potential, Tien Lang can build a unique tourism industry that is competitive enough with other localities within Hai Phong city and neighboring areas.
In recent years, the exploitation of the advantages of resources to develop tourism and build tourist routes in Tien Lang has not been commensurate with the available potential. In terms of quantity, many resource objects have not been brought into the purpose of tourism development. In terms of time, the regular service time has not been extended to attract more visitors. Infrastructure and technical facilities are still weak. The labor force is still thin and weak in terms of expertise. Tourism programs and routes have not been organized properly, the exploitation content is still monotonous, so it has not attracted many visitors. Although resources have not been mobilized much for tourism development, they are facing the risk of destruction and degradation.
2. Based on the results of investigation, analysis, synthesis, evaluation and selective absorption of research results of related topics, the thesis has proposed a number of necessary solutions to improve the efficiency of exploiting tourism resources in Tien Lang such as: promoting the restoration and conservation of tourism resources, focusing on investment and key exploitation of ecotourism resources, strengthening the construction of infrastructure and tourism workforce. Expanding forms of capital mobilization. In addition, the thesis has built a number of tourist routes of Hai Phong in which Tien Lang tourism resources play an important role.
Exploiting Tien Lang tourism resources for tourism development is currently facing many difficulties. The above measures, if applied synchronously, will likely bring new prospects for the local tourism industry, contributing to making Tien Lang tourism an important economic sector in the district's economic structure.
REFERENCES
1. Nhuan Ha, Trinh Minh Hien, Tran Phuong, Hai Phong - Historical and cultural relics, Hai Phong Publishing House, 1993
2. Hai Phong City History Council, Hai Phong Gazetteer, Hai Phong Publishing House, 1990.
3. Hai Phong City History Council, History of Tien Lang District Party Committee, Hai Phong Publishing House, 1990.
4. Hai Phong City History Council, University of Social Sciences and Humanities, VNU, Hai Phong Place Names Encyclopedia, Hai Phong Publishing House. 2001.
5. Law on Cultural Heritage and documents guiding its implementation, National Political Publishing House, Hanoi, 2003.
6. Tran Duc Thanh, Lecture on Tourism Geography, Faculty of Tourism, University of Social Sciences and Humanities, VNU, 2006
7. Hai Phong Center for Social Sciences and Humanities, Some typical cultural heritages of Hai Phong, Hai Phong Publishing House, 2001
8. Nguyen Ngoc Thao (editor-in-chief, Tourism Geography, Hai Phong Publishing House, two volumes (2001-2002)
9. Nguyen Minh Tue and group of authors, Hai Phong Tourism Geography, Ho Chi Minh City Publishing House, 1997.
10. Nguyen Thanh Son, Hai Phong Tourism Territory Organization, Associate Doctoral Thesis in Geological Geography, Hanoi, 1996.
11. Decision No. 2033/QD – UB on detailed planning of Tien Lang town, Hai Phong city until 2020.
12. Department of Culture, Information, Hai Phong Museum, Hai Phong relics
- National ranked scenic spot, Hai Phong Publishing House, 2005. 13. Tien Lang District People's Committee, Economic Development Planning -
Culture - Society of Tien Lang district to 2010.
14.Website www.HaiPhong.gov.vn
APPENDIX 1
List of national ranked monuments
STT
Name of the monument
Number, year of decisiondetermine
Location
1
Gam Temple
938 VH/QĐ04/08/1992
Cam Khe Village- Toan Thang commune
2
Doc Hau Temple
9381 VH/QĐ04/08/1992
Doc Hau Village –Toan Thang commune
3
Cuu Doi Communal House
3207 VH/QĐDecember 30, 1991
Zone II of townTien Lang
4
Ha Dai Temple
938 VH/QĐ04/08/1992
Ha Dai Village –Tien Thanh commune
APPENDIX II
STT
Name of the monument
Number, year of decision
Location
1
Phu Ke Pagoda Temple
178/QD-UBJanuary 28, 2005
Zone 1 - townTien Lang
2
Trung Lang Temple
178/QD-UBJanuary 28, 2005
Zone 4 – townTien Lang
3
Bao Khanh Pagoda
1900/QD-UBAugust 24, 2006
Nam Tu Village -Kien Thiet commune
4
Bach Da Pagoda
1792/QD-UB11/11/2002
Hung Thang Commune
5
Ngoc Dong Temple
177/QD-UBNovember 27, 2005
Tien Thanh Commune
6
Tomb of Minister TSNhu Van Lan
2848/QD-UBSeptember 19, 2003
Nam Tu Village -Kien Thiet commune
7
Canh Son Stone Temple
2160/QD-UBSeptember 19, 2003
Van Doi Commune –Doan Lap
8
Meiji Temple
2259/QD-UBSeptember 19, 2002
Toan Thang Commune
9
Tien Doi Noi Temple
477/QD-UBSeptember 19, 2005
Doan Lap Commune
10
Tu Doi Temple
177/QD-UBJanuary 28, 2005
Doan Lap Commune
11
Duyen Lao Temple
177/QD-UBJanuary 28, 2005
Tien Minh Commune
12
Dinh Xuan Uc Pagoda
177/QD-UBJanuary 28, 2005
Bac Hung Commune
13
Chu Khe Pagoda
177/QD-UBJanuary 28, 2005
Hung Thang Commune
14
Dong Dinh
2848/QD-UBNovember 21, 2002
Vinh Quang Commune
15
President's Memorial HouseTon Duc Thang
177/QD-UBJanuary 28, 2005
NT Quy Cao
Ha Dai Temple
Ben Vua Temple
Tien Lang hot spring
div.maincontent .p { color: black; font-family:"Times New Roman", serif; font-style: normal; font-weight: normal; text-decoration: none; font-size: 14pt; margin:0pt; } div.maincontent p { color: black; font-family:"Times New Roman", serif; font-style: normal; font-weight: normal; text-decoration: none; font-size: 14pt; margin:0pt; } div.maincontent .s1 { color: black; font-family:"Times New Roman", serif; font-style: normal; font-weight: normal; font-size: 16pt; } div.maincontent .s2 { color: black; font-family:"Times New Roman", serif; font-style: italic; font-weight: bold; text-decoration: none; font-size: 14pt; } div.maincontent .s3 { color: black; font-family:"Times New Roman", serif; font-style: italic; font-weight: normal; text-decoration: none; font-size: 14pt; } div.maincontent .s4 { color: black; font-family:"Times New Roman", serif; font-style: normal; font-weight: normal; font-size: 14pt; } div.maincontent .s5 { color: black; font-family:"Times New Roman", serif; font-style: normal; font-weight: bold; font-size: 14pt; } div.maincontent .s6 { color: black; font-family:"Times New Roman", serif; font-style: normal; font-weight: normal; text-decoration: none; font-size: 14pt; } div.maincontent .s7 { color: black; font-family:"Times New Roman", serif; font-style: normal; font-weight: bold; text-decoration: none; font-size: 14pt; } div.maincontent .s8 { color: black; font-family:"Times New Roman", serif; font-style: normal; font-weight: normal; text-decoration: none; font-size: 9pt; vertical-align: 6pt; } div.maincontent .s9 { color: black; font-family:"Times New Roman", serif; font-style: normal; font-weight: bold; text-decoration: none; font-size: 12pt; } div.maincontent .s11 { color: black; font-family:"Times New Roman", serif; font-style: normal; font-weight: normal; tex
Solutions for tourism development in Tien Lang - 10
zt2i3t4l5ee
zt2a3gstourism, tourism development
zt2a3ge
zc2o3n4t5e6n7ts
- District People's Committees and authorities of communes with tourist attractions should support, promote, and provide necessary information to people, helping them improve their knowledge about tourism. Raise tourism awareness for local people.
*
* *
Due to limited knowledge and research time, the thesis inevitably has shortcomings. Therefore, I look forward to receiving guidance from teachers, experts as well as your comments to make the thesis more complete.
Chapter III Conclusion
Through the issues presented in Chapter II, we can come to some conclusions:
Based on the strengths of available tourism resources, the types of tourism in Tien Lang that need to be promoted in the coming time are sightseeing and resort tourism, discovery tourism, weekend tourism. To improve the quality and diversify tourism products, Tien Lang district needs to combine with local cultural tourism resources, at the same time combine with surrounding areas, build rich tourism products. The strengths of Tien Lang tourism are eco-tourism and cultural tourism, so developing Tien Lang tourism must always go hand in hand with restoring and preserving types of cultural tourism resources. Some necessary measures to support and improve the efficiency of exploiting tourism resources in Tien Lang are: strengthening the construction of technical facilities and labor force serving tourism, actively promoting and advertising tourism, and expanding forms of capital mobilization for tourism development.
CONCLUDE
I Conclusion
1. Based on the results achieved within the framework of the thesis's needs, some basic conclusions can be drawn as follows:
Tien Lang is a locality with great potential for tourism development. The relatively abundant cultural tourism resources and ecological tourism resources have great appeal to tourists. Based on this potential, Tien Lang can build a unique tourism industry that is competitive enough with other localities within Hai Phong city and neighboring areas.
In recent years, the exploitation of the advantages of resources to develop tourism and build tourist routes in Tien Lang has not been commensurate with the available potential. In terms of quantity, many resource objects have not been brought into the purpose of tourism development. In terms of time, the regular service time has not been extended to attract more visitors. Infrastructure and technical facilities are still weak. The labor force is still thin and weak in terms of expertise. Tourism programs and routes have not been organized properly, the exploitation content is still monotonous, so it has not attracted many visitors. Although resources have not been mobilized much for tourism development, they are facing the risk of destruction and degradation.
2. Based on the results of investigation, analysis, synthesis, evaluation and selective absorption of research results of related topics, the thesis has proposed a number of necessary solutions to improve the efficiency of exploiting tourism resources in Tien Lang such as: promoting the restoration and conservation of tourism resources, focusing on investment and key exploitation of ecotourism resources, strengthening the construction of infrastructure and tourism workforce. Expanding forms of capital mobilization. In addition, the thesis has built a number of tourist routes of Hai Phong in which Tien Lang tourism resources play an important role.
Exploiting Tien Lang tourism resources for tourism development is currently facing many difficulties. The above measures, if applied synchronously, will likely bring new prospects for the local tourism industry, contributing to making Tien Lang tourism an important economic sector in the district's economic structure.
REFERENCES
1. Nhuan Ha, Trinh Minh Hien, Tran Phuong, Hai Phong - Historical and cultural relics, Hai Phong Publishing House, 1993
2. Hai Phong City History Council, Hai Phong Gazetteer, Hai Phong Publishing House, 1990.
3. Hai Phong City History Council, History of Tien Lang District Party Committee, Hai Phong Publishing House, 1990.
4. Hai Phong City History Council, University of Social Sciences and Humanities, VNU, Hai Phong Place Names Encyclopedia, Hai Phong Publishing House. 2001.
5. Law on Cultural Heritage and documents guiding its implementation, National Political Publishing House, Hanoi, 2003.
6. Tran Duc Thanh, Lecture on Tourism Geography, Faculty of Tourism, University of Social Sciences and Humanities, VNU, 2006
7. Hai Phong Center for Social Sciences and Humanities, Some typical cultural heritages of Hai Phong, Hai Phong Publishing House, 2001
8. Nguyen Ngoc Thao (editor-in-chief, Tourism Geography, Hai Phong Publishing House, two volumes (2001-2002)
9. Nguyen Minh Tue and group of authors, Hai Phong Tourism Geography, Ho Chi Minh City Publishing House, 1997.
10. Nguyen Thanh Son, Hai Phong Tourism Territory Organization, Associate Doctoral Thesis in Geological Geography, Hanoi, 1996.
11. Decision No. 2033/QD – UB on detailed planning of Tien Lang town, Hai Phong city until 2020.
12. Department of Culture, Information, Hai Phong Museum, Hai Phong relics
- National ranked scenic spot, Hai Phong Publishing House, 2005. 13. Tien Lang District People's Committee, Economic Development Planning -
Culture - Society of Tien Lang district to 2010.
14.Website www.HaiPhong.gov.vn
APPENDIX 1
List of national ranked monuments
STT
Name of the monument
Number, year of decisiondetermine
Location
1
Gam Temple
938 VH/QĐ04/08/1992
Cam Khe Village- Toan Thang commune
2
Doc Hau Temple
9381 VH/QĐ04/08/1992
Doc Hau Village –Toan Thang commune
3
Cuu Doi Communal House
3207 VH/QĐDecember 30, 1991
Zone II of townTien Lang
4
Ha Dai Temple
938 VH/QĐ04/08/1992
Ha Dai Village –Tien Thanh commune
APPENDIX II
STT
Name of the monument
Number, year of decision
Location
1
Phu Ke Pagoda Temple
178/QD-UBJanuary 28, 2005
Zone 1 - townTien Lang
2
Trung Lang Temple
178/QD-UBJanuary 28, 2005
Zone 4 – townTien Lang
3
Bao Khanh Pagoda
1900/QD-UBAugust 24, 2006
Nam Tu Village -Kien Thiet commune
4
Bach Da Pagoda
1792/QD-UB11/11/2002
Hung Thang Commune
5
Ngoc Dong Temple
177/QD-UBNovember 27, 2005
Tien Thanh Commune
6
Tomb of Minister TSNhu Van Lan
2848/QD-UBSeptember 19, 2003
Nam Tu Village -Kien Thiet commune
7
Canh Son Stone Temple
2160/QD-UBSeptember 19, 2003
Van Doi Commune –Doan Lap
8
Meiji Temple
2259/QD-UBSeptember 19, 2002
Toan Thang Commune
9
Tien Doi Noi Temple
477/QD-UBSeptember 19, 2005
Doan Lap Commune
10
Tu Doi Temple
177/QD-UBJanuary 28, 2005
Doan Lap Commune
11
Duyen Lao Temple
177/QD-UBJanuary 28, 2005
Tien Minh Commune
12
Dinh Xuan Uc Pagoda
177/QD-UBJanuary 28, 2005
Bac Hung Commune
13
Chu Khe Pagoda
177/QD-UBJanuary 28, 2005
Hung Thang Commune
14
Dong Dinh
2848/QD-UBNovember 21, 2002
Vinh Quang Commune
15
President's Memorial HouseTon Duc Thang
177/QD-UBJanuary 28, 2005
NT Quy Cao
Ha Dai Temple
Ben Vua Temple
Tien Lang hot spring
div.maincontent .p { color: black; font-family:"Times New Roman", serif; font-style: normal; font-weight: normal; text-decoration: none; font-size: 14pt; margin:0pt; } div.maincontent p { color: black; font-family:"Times New Roman", serif; font-style: normal; font-weight: normal; text-decoration: none; font-size: 14pt; margin:0pt; } div.maincontent .s1 { color: black; font-family:"Times New Roman", serif; font-style: normal; font-weight: normal; font-size: 16pt; } div.maincontent .s2 { color: black; font-family:"Times New Roman", serif; font-style: italic; font-weight: bold; text-decoration: none; font-size: 14pt; } div.maincontent .s3 { color: black; font-family:"Times New Roman", serif; font-style: italic; font-weight: normal; text-decoration: none; font-size: 14pt; } div.maincontent .s4 { color: black; font-family:"Times New Roman", serif; font-style: normal; font-weight: normal; font-size: 14pt; } div.maincontent .s5 { color: black; font-family:"Times New Roman", serif; font-style: normal; font-weight: bold; font-size: 14pt; } div.maincontent .s6 { color: black; font-family:"Times New Roman", serif; font-style: normal; font-weight: normal; text-decoration: none; font-size: 14pt; } div.maincontent .s7 { color: black; font-family:"Times New Roman", serif; font-style: normal; font-weight: bold; text-decoration: none; font-size: 14pt; } div.maincontent .s8 { color: black; font-family:"Times New Roman", serif; font-style: normal; font-weight: normal; text-decoration: none; font-size: 9pt; vertical-align: 6pt; } div.maincontent .s9 { color: black; font-family:"Times New Roman", serif; font-style: normal; font-weight: bold; text-decoration: none; font-size: 12pt; } div.maincontent .s11 { color: black; font-family:"Times New Roman", serif; font-style: normal; font-weight: normal; tex -
 Economic Structure by Sector 2005 - 2015.
 -
 Some Theoretical Models on Economic Sector Structure Shift
 -
 Proportion of Some Economic Indicators of Business Sectors in the Period
Source: Statistical Yearbook 2000, 2007
In fact, the economic structure of Vietnam still has a large difference between countries in the region and in the world. The current economic structure of Vietnam in sector I still accounts for a high proportion of GDP at 31.57% in 2005, while this proportion in countries in the region is very low such as China accounts for 11.71%, some NIC countries such as Korea 3.41%, Singapore is 0.09% and some developed industrial countries such as the US accounts for 1.19% and Japan 1.50%. The above situation requires that for sector I in our country, there must be policies and measures to reduce the proportion of sector I in the coming time, reaching the target of 15-16% in 2010 (see table 2.4).
Table 2.4: Proportion of three economic sectors according to GDP of some countries in the region and in the world in 2005 (%)
Water
Area I | Region II | Region III | |
America | 1.19 | 22.84 | 75.97 |
Japan | 1.50 | 29.88 | 68.61 |
Singapore | 0.09 | 33.77 | 66.14 |
Korea | 3.41 | 40.27 | 56.32 |
Thailand | 9.83 | 41.18 | 45.85 |
China | 11.71 | 47.52 | 39.94 |
Vietnam (2005) | 31.57 | 20.63 | 47.80 |
Vietnam (2007) | 30.05 | 21.38 | 48.57 |
Source: General Statistics Office 2007
For region II, the proportion is low compared to other countries in the region. In fact, our country has a lot of potential to develop region II, but due to not fully exploiting the strengths of the regions in the country, the proportion in 2005 was low at 20.36% compared to China's 47.52% and South Korea's 40.27%. The above situation requires mechanisms, policies and measures to promote the processing industry in our country to develop more strongly; reduce the proportion for region I and narrow the gap with other countries in the region. Region III in our country has improved in the years of renovation but is still far behind other countries in the region and the world; the low growth rate from 47.80% in 2005 to 48.57% in 2007. Compared to Japan's 68.61% and Korea's 56.32%, our country's sector III is still lagging behind, leading to slow economic restructuring.
According to the United Nations sectoral classification, the economic structure shift in our country is slow and backward, the proportion of GDP in the agricultural sector is still too high and in the processing industry is too low, the service sector is growing slowly. The above reality poses challenges to our country's economy, the goal of striving for our country to basically become an industrialized country by 2020 becomes difficult.
2.3. Internal restructuring of sectors in the national economy
2.3.1. Internal restructuring of agriculture, forestry and fishery sectors
2.3.1.1. According to the sub-sector of the General Statistics Office
During the years of renovation, the GDP structure within the agricultural sector continued to have positive shifts, the internal structure of the agricultural, forestry and fishery sectors has changed, reducing the proportion of agriculture and forestry and increasing the proportion of the fishery sector; it has been gradually exploited and promoted, contributing to promoting production development and improving growth quality (see table 2.5).
Table 2.5: GDP structure of agriculture, forestry and fishery in the economy (%)
Year
% of GDP of the whole industry in the economy | Agriculture | Forestry | Seafood | |
1995 | 27.18 | 23.03 | 1.24 | 2.91 |
2000 | 24.53 | 19.82 | 1.34 | 3.37 |
2001 | 23.25 | 18.26 | 1.27 | 3.72 |
2002 | 23.03 | 18.02 | 1.21 | 3.80 |
2003 | 22.54 | 17.34 | 1.27 | 3.93 |
2004 | 21.81 | 16.65 | 1.32 | 3.84 |
2005 | 20.94 | 15.85 | 1.20 | 3.89 |
2006 | 20.40 | 15.36 | 1.11 | 3.93 |
2007 | 20.30 | 15.22 | 1.05 | 4.02 |
2008 | 21.99 | 16.98 | 1.07 | 3.94 |
Source: General Statistics Office, Statistical Yearbook from 1995 to 2008
Table 2.6: GDP structure of the entire agriculture, forestry and fishery sector (%)
Year
GDP total branch | Agriculture | Forestry | Seafood | |
1995 | 100 | 84.73 | 4.60 | 10.70 |
2000 | 100 | 80.80 | 5.50 | 13.70 |
2001 | 100 | 78.50 | 5.50 | 16.00 |
2002 | 100 | 78.25 | 5.25 | 16.50 |
2003 | 100 | 76.93 | 5.63 | 17.44 |
2004 | 100 | 76.34 | 6.05 | 17.61 |
2005 | 100 | 75.69 | 5.73 | 18.58 |
2006 | 100 | 75.30 | 5.44 | 19.26 |
2007 | 100 | 75.00 | 5.20 | 19.80 |
2008 | 100 | 77.21 | 4.87 | 17.92 |
Source: General Statistics Office, Statistical Yearbook from 1995 to 2008
Although, within the agricultural sector there has been a shift, from 1995 to now the proportion of agriculture in GDP has decreased, specifically in 1995 it was 23.03%, in 2007 it was 15.22% but in 2008 it increased to 16.98%. The proportion of forestry decreased from 1.24% in 1995 to 1.05% in 2007 while forestry still has a lot of potential in terms of forests and forest land. Meanwhile, the proportion of aquaculture in GDP has increased from 2.91% in 1995 to 4.02% in 2007 but the growth rate is still low.
The restructuring of the agriculture, forestry and fishery sector is shifting from raising and cultivating low-value-added plants and animals to high-value-added plants and animals to increase income; shifting from producing products with supply exceeding demand to products with large consumer markets. The structure of the production value of the agriculture, forestry and fishery sector has also shifted. In the total production value of the agriculture, forestry and fishery sector, the proportion of the agricultural sector has decreased from 87.1%
in 1991 to 78.3% in 2002, at the same time the proportion of the forestry sector decreased from 5.6% to 3.9%; the proportion of the fishery sector increased from 7.3% to 17.8%.
Within the agricultural sector, the livestock sector continues to be focused on development and promoted to become the main production sector. As of 2008, the production value of the agricultural, forestry and fishery sector at 1994 comparable prices was estimated at nearly 212 trillion VND, an increase of 5.6% compared to 2007, of which agriculture increased by 5.4%, forestry increased by 2.2% and fishery increased by 6.7%. [31].
- In agriculture
The agricultural sector has begun to shift the structure of crops and livestock towards producing products with high quality and added value, ensuring food safety and hygiene.
The development of agriculture and the change in its structure have created new opportunities and conditions for the development of industry and services in rural areas, promoting the process of economic restructuring in general. The development of agriculture has gone into depth, rice output and productivity have increased continuously over the years, no longer purely due to increased area and labor but have begun to shift to increased output thanks to increased productivity.
Table 2.7: Rice area and output in the period 1995 - 2008
Unit: thousand tons, thousand hectares
Year
1995 | 1996 | 2000 | 2002 | 2006 | 2007 | 2008 | |
Output | 24963.7 | 26396.7 | 32529.5 | 34447.2 | 35849.5 | 35876.5 | 38000.6 |
Acreage | 6765.6 | 7003.8 | 7666.3 | 7504.3 | 7324.8 | 7201.0 | 7400.5 |
Source: Statistical Yearbook 2007, page 239
From 1991 to 2000, rice output increased mainly due to increased area and labor. From 2002 to present, rice output increased labor productivity, rice growing area decreased from 7666.2 thousand hectares in 2000 to
7,201.0 thousand hectares in 2007. The high rice productivity is due to the conversion of unstable, low-yield, high-cost rice cultivation areas to aquaculture and other effective crops. In the Central Highlands, the low-yield and low-efficiency food growing land area has been converted to industrial crops with high export value such as coffee, pepper, etc.
In 2007, the output of many annual industrial crops such as jute, sugarcane, peanuts, and soybeans increased in both area and yield compared to the previous year. These crops have become key crops, growing steadily and having export markets. The output of high-value export crops such as rubber, pepper, cashew, and tea increased from 8.3 to 14.4% due to expanded area and increased yield. In particular, although the area of coffee increased by 1.9%, due to pests and diseases, the yield was low, resulting in a 2.4% decrease in output.
In particular, Vietnam is considered to be the country with the highest pepper productivity in the world today at a common level of 4-5 tons/ha compared to the world average of about 0.8-1.2 tons/ha. Our country is currently the world leader in exporting this product, having exported about 16,000 tons and reaching a turnover of 55 million USD.
However, the proportion of the crop sector has decreased, but the output and growth rate have still begun to develop rapidly towards commodity agriculture and export. The growth rate of the crop sector is uneven, with a tendency to decrease in food and industrial crops, and increase in fruit trees and vegetables.
Table 2.8: Production value of crop production in the period 1996 - 2007
[ Year
Total production value (VND) | Production value growth rate (%) | |||||
Total | Food | Vegetables, beans | CN tree | Fruit tree | ||
1996 | 66183.4 | 6.9 | 6.0 | 2.1 | 14.9 | 2.0 |
1997 | 70778.8 | 7.0 | 5.1 | 6.9 | 13.2 | 7.8 |
2000 | 90858.2 | 5.2 | 8.3 | 2.5 | 9.4 | - 0.4 |
2003
101786.3 | 3.8 | 2.4 | 3.3 | 8.7 | 1.8 | |
2004 | 106422.5 | 4.6 | 4.2 | 3.2 | 5.9 | 4.8 |
2006 | 111613.0 | 3.4 | 0.5 | 5.1 | 11.1 | 0.8 |
2007 | 114333.2 | 2.4 | 0.8 | 8.2 | 2.6 | 8.8 |
Source: Statistical Yearbook 2007
The internal structural transformation of the crop cultivation industry is evident in the growth rate of industrial crops, reaching 11.1% in 2006 and decreasing to 2.6% in 2007; for vegetables and beans, from 2000 to now, the growth rate over the years has been relatively steady, and especially fruit trees in 2007 grew at 8.8%, high-value fruit growing areas associated with the processing industry and serving exports have developed rapidly: lychee in Hai Duong, mango in the South, Vinh Long, green-skinned grapefruit... Through the table above, we can see that the total production value of the crop cultivation industry accounts for a large proportion, increases steadily every year and is higher than the aquaculture industry.
- Livestock sector
Livestock is an important economic sector in agricultural production, meeting the daily food demand in society and is also a source of income for millions of people today. Currently, livestock has not developed on a large scale; therefore, the quality and variety of livestock products are still low, prices are not high, and have not met the requirements of both domestic and export markets.
Livestock and poultry farming is gradually recovering from the damage caused by natural disasters and epidemics. In our country, as of 2006, livestock and poultry herds were diverse, but the food source from these livestock and poultry herds was not enough to meet the current consumption demand of 24.5 kg/person/year. Therefore, the Party and the Government have set out policies to develop the economy, promote industrialization,