decreased and the amount of FDI capital into this country also decreased significantly. However, in 2003, the situation improved and FDI capital inflow into Singapore reached 11.4 billion USD, this figure also continued to increase to 20.1 billion USD in 2004. Although in 2005 FDI into this country decreased compared to 2004, by 2006 FDI capital increased and reached a record number of 24.2 billion USD.
The chart below will show more clearly the movement of FDI capital flows into Singapore over the years.
Chart 2: FDI flows into Singapore over the years
24.2
20.1
14.8
13.2
12.4
10.9
11.4
7.5
7.6
4.5
25
20
Billion USD
15
10
5
0
1985-
1995
1998 1999 2000 2001 2002 2003 2004 2005 2006
Year
Source: World Investment Report 2003-2007 - UNCTAD
3. FDI capital structure in Singapore
3.1. By investment partner
Table 2: FDI into Singapore by main investment partners
Year
Total (Million SGD) | % | Major investing countries | |||
Older brother | America | Japan | Netherlands | ||
Maybe you are interested!
-
 Strengthening the attraction of foreign direct investment (FDI) into Nghe An province - 26
 -
 Applying some statistical methods to analyze the economic efficiency of foreign direct investment FDI in Vietnam - 20
 -
 Local marketing to attract foreign direct investment FDI in Quang Nam province - 2
 -
 Foreign direct investment (FDI) and economic restructuring of Thai Nguyen province - 26
 -
 Local marketing to attract foreign direct investment FDI in Quang Nam province - 24
1997
125,274 | 19.3 | 11.2 | 18.7 | 17.0 | 5.7 | |
1998 | 144,197 | // | 12.2 | 15.8 | 18.1 | 6.6 |
1999 | 170,820 | 18.5 | 6.9 | 14.5 | 16.8 | 13.4 |
2000 | 195,023 | 14.2 | 4.6 | 16.3 | 15.0 | 14.9 |
2001 | 222,318 | 14.0 | 6.6 | 16.7 | 13.5 | 16.1 |
2002 | 235,105 | 5.8 | 14.0 | 14.9 | 14.1 | 10.8 |
2003 | 251,652 | 7.0 | 15.6 | 15.0 | 13.5 | 11.0 |
2004 | 285,876 | 13.6 | 15.8 | 15.8 | 13.1 | 11.3 |
2005 | 311,084 | 8.8 | 16.1 | 13.7 | 13.2 | 10.2 |
Source: Singapore Institute of Statistics. www.singstat.gov.sg/pubn/reence/sh2007.pdf
In general, Singapore's main partners are investors from the US, the Netherlands, Japan, and the UK (specific figures can be seen in the table above). These are also the strategic investors that Singapore always aims for in attracting FDI. Singapore wants to not only take advantage of investment capital but also their technology, techniques, and high management level.
In recent years, investment from Japan has tended to decrease in total investment capital compared to other investors, partly due to the strong competition of some countries in the region to attract FDI capital from Japan (such as China, India, Vietnam ...), while investment from the UK in Singapore has tended to increase. To learn more, we can specify Singapore's main investment partners in each region according to the data tables below:
Table 3: Major Investors from North America
2004 ($ million) | 2005 ($ million) | % increase/decrease | |
North America | 48,107 | 45,336 | -5.6 |
America | 45,152 | 42,755 | -5.3 |
Canada
2,866 | 2,581 | -9.9 |
Source: www.singstat.gov.sg/stats/themes/economy/biz/feisummary.pdf
The US is the largest investor in North America investing in Singapore with an investment capital of 45,107 million USD (2004) and 42,755 million USD (2005). During the 70s until now, the highest record of US investment in Singapore compared to other investors was in 1975, FDI from the US accounted for 28.1% of Singapore's FDI, this figure in 1980 was 22.5% and 1990 was 12.2%. FDI capital from the US has increased and decreased but has always been one of the major investors in Singapore.
Table 4: Main investors from the European region
Water
2004 ($ million) | 2005 (Million $) | % increase/decrease | |
Europe | 121,906 | 134,017 | 9.9 |
Older brother | 45,195 | 50,134 | 10.9 |
Netherlands | 32,263 | 31,726 | -1.7 |
Switzerland | 16,547 | 21,651 | 30.8 |
Naoway | 6,238 | 7,852 | 25.9 |
Virtue | 7,322 | 7,569 | 3.4 |
France | 5,575 | 5,650 | 1.3 |
Source: www.singstat.gov.sg/stats/themes/economy/biz/feisummary.pdf
Europe is the region that invests the most in Singapore (always accounting for nearly 50% of total FDI in this country). When talking about investors from Europe, we cannot fail to mention the UK - Singapore's traditional investor. In 1970, capital flows from the UK accounted for 30% of total FDI in Singapore, and the UK has always been considered by Singapore as a major and strategic investment partner. It can be seen that FDI from the UK in 2005 was 50,134 million USD, an increase compared to 2005.
2004 ($45.195 million) - still holds the number one position as the investor from Europe. The Netherlands is second with an investment capital of $32.263 million in 2004 and $31.726 million in 2005. The next positions belong to Switzerland, Nao-uay, Germany and finally France.
Table 5: Major investors from Asia region
2004 ($ million) | 2005 ($ million) | % increase/decrease | |
Asia | 64,215 | 73,975 | 15.2 |
Japan | 37,514 | 41,123 | 9.6 |
Malaysia | 5,146 | 7,156 | 39.1 |
Taiwan | 5,732 | 7,140 | 24.6 |
Hong Kong | 4,585 | 4,890 | 6.7 |
Indonesia | 1,097 | 1,259 | 14.8 |
Thailand | 1,046 | 1,189 | 13.7 |
Source: www.singstat.gov.sg/stats/themes/economy/biz/feisummary.pdf Japan is the largest investor in the Asian region investing in Singapore. Since the 1970s, Japan has been Singapore's strategic partner in attracting FDI. In 1970, Japan accounted for 8.2% of total FDI in Singapore, by 1990, this figure was 20.6%, in 2000 it was 15.5% and in the following years, although the amount of investment capital decreased in terms of total FDI, Japan is still a major investor in Singapore. Based on the above data, it can be seen that Japan accounts for over 50% of FDI in the Asian region in Singapore with capital of 37.514 million USD (2004) and 41.123 million USD (2005). Malaysia is second, but the investment capital is much more modest than Japan.
This figure was only 5.146 million USD (2004) and 7.156 million USD (2005).
The chart below shows more clearly the FDI inflows (2005) into Singapore from regions around the world.
Chart 3.
FDI flows from regions to Singapore in 2005
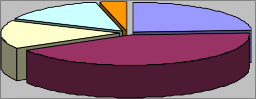
14.6% 3.5%
23.8%
Asia Europe
Central, South America & Caribbean North America
Other areas
15.1%
43.0%
Source: Singapore Statistical Institute.
By the end of 2005, 2/5 of FDI capital in Singapore came from European Union countries (134 billion USD), followed by the UK (50 billion USD), the Netherlands (32 billion USD), which are also the main investors from Europe. Asian investors accounted for nearly 24% of total FDI in Singapore, in which Japan held the position of number 1 investor in this region with a total capital of 74 billion USD. Investment from the region
North America accounts for 15% of total FDI in Singapore (45 billion USD), with the US leading with a total investment capital of 43 billion USD. 15
3.2. By investment sector
Attracting foreign investment in Singapore has always been closely linked to the country's economic development strategy. During the period from 1965 to the 1970s, Singapore implemented an export-prioritized industrialization strategy, and especially encouraged labor-intensive industries such as food processing and garment industries. Therefore, Singapore focused on attracting FDI into manufacturing industries.
15 Singapore 2007, statistical highlights / Department of Statics, Ministry of Trade and Industry, Republic of Singapore
Since the 1970s, the manufacturing industry accounted for 50% of total FDI capital in Singapore. By the early 1980s, FDI capital in these industries continued to increase and accounted for over 50% of Singapore's total FDI capital. During this period, the service and financial industries accounted for a modest proportion of FDI attraction, 19.1% in 1970 and 21.7% in 1975.
In the late 1980s, after the 1986 crisis, with the shift in priority to diversifying industrial and service activities, foreign direct investment in the service and financial sectors gradually increased in total FDI capital. In 1990, it accounted for 33.9%, and in 1995, it was 37.3% of total FDI capital.
Currently, FDI in the financial services industry has increased rapidly and tends to surpass the manufacturing industry.
Looking at the table below will give us a more specific view of the changes in FDI flows into the two main sectors of the Singapore economy: manufacturing and services.
Table 6: FDI into Singapore by manufacturing and services sector
(Unit: %)
Year
Manufacture | Services, Finance | Other | |
1970 | 50.0 | 19.1 | 30.9 |
1975 | 50.3 | 21.7 | 28.0 |
1980 | 56.6 | 16.5 | 25.9 |
1990 | 41.4 | 33.9 | 24.7 |
1995 | 38.2 | 37.3 | 24.5 |
2000 | 35.8 | 36.3 | 27.9 |
2005 | 33.3 | 38.3 | 28.4 |
According to data from: Yearbook of statistics Singapore 2007 www.singstat.gov.sg/pubn/reference/yos/statsT-income.pdf
Table 7: FDI by sector in Singapore
(Unit: million SGD)
Year
2001 | 2002 | 2003 | 2004 | 2005 | |
Manufacturing industry | 81,870.1 | 85,949.4 | 91,717.1 | 96,923.8 | 103,600 |
Build | 1,719.9 | 1,949.7 | 1,409.4 | 1,129.0 | 1,049.8 |
Business, customer hotel, restaurant | 34,107.9 | 38,065.5 | 40,091 | 45,995.6 | 48,808.3 |
Transportation | 8,182.9 | 8,730.8 | 10,233.2 | 13,118.1 | 16,914 |
Telecommunications | 2,047.8 | 3,132.7 | 3,121.6 | 3,456 | 3,469 |
Financial services | 80,964.2 | 82,543.1 | 89,626.7 | 108,637.9 | 119,141 |
Real estate and for real estate rental | 7,110.1 | 7,983.7 | 7,517.3 | 8,239.8 | 8,149.6 |
Technology and engineering services technical, administrative and support | 5,983.8 | 6,595.2 | 7,783.7 | 8,225.4 | 9,792 |
Other industries | 331.9 | 155.1 | 7,783 | 151.0 | 158.6 |
Total | 222,318 | 235,105 | 251,652 | 285,876.7 | 311,084 |
Yearbook of statistics Singapore 2007 www.singstat.gov.sg/pubn/reference/yos/statsT-income.pdf
Looking at the above data table, we can see that, in the two manufacturing and service sectors, FDI attraction in the service sector tends to increase rapidly.
Especially in the service industry, financial and banking services are a strength of Singapore, in 2005 it accounted for more than 1/3 of the total FDI capital in Singapore's economic sectors. This is also understandable because the Singaporean Government's policy is to turn this country into a regional commercial and financial center and this attraction is an extremely positive sign, a success of Singapore in implementing the FDI attraction strategy for the purpose of economic development according to the direction of this country.
Besides financial services, the hotel, tourism and transportation service industries also attract the attention of many investors.
Foreign direct investment, expressed as FDI capital flows into these industries, also ranks second and third compared to FDI flows into the financial services industry.
In the manufacturing industry, electronic component manufacturing is Singapore's strength, it is one of the leading countries in the field of manufacturing this item.
In 2003, along with the global IT recovery, multinational companies announced a series of new investment projects in Singapore's electronics sector. Typical examples include:
- Hewlett Packard announced in January 2004 that it plans to invest $1 billion in Singapore over the next five years, including the transfer of its “superdome” servers from the US to Singapore. HP, which employs 6,000 people in Singapore, has reported that its manufacturing output in Singapore has increased by 30% each year since 1998.
- Along with HP, Seagate is also investing $300 million in Singapore over the next five years. The company also set up an executive headquarters in Singapore in November 2003.
- UMC - Taiwanese semiconductor manufacturer has increased its capital contribution in UMC Singapore from 75% to 85% by acquiring shares from EDBi.
- Semiconductor maker Infineon AG announced plans to spend $88 million to expand its IC testing programs in Singapore by 25%.
- Japanese electronics company Matsushita has invested an additional amount to produce high-end microprocessors for devices such as digital cameras, CD and DVD players, etc.
In addition, other manufacturing sectors also saw rapid increases in investment capital in Singapore.
Siemens is spending US$29 million to manufacture its Siplace equipment in Singapore. This additional investment will increase Siemens' total investment in Singapore to more than US$412 million.