3.1.3. Inoculating microorganisms on improved EBB substrate
After casting and drying the product for 24 hours, the EBB block is soaked and washed to remove dirt on the block and layers of cement dust that have not yet hardened on the EBB block.


improve and put into the culture tank
Figure 3.5. Improved EBB before and after VSV implantation
microorganisms using Sagi-Bio 2 preparation (see figure 3.4). The expected time for inoculating microorganisms onto EBB blocks from Sagi-Bio preparation is about 10 days. The EBB pellets are put into plastic pots with a capacity of 50 liters. With a microbial density of 10 8 CFU/ml, the study
Figure 3.4. Inoculation of microorganisms into improved EBB
Add 50ml of Sagi-Bio preparation to the microbial culture tank, along with a pump to mix water inside the pot to enhance the adhesion and growth of microorganisms, add food for microorganisms at the ratio of COD:N:P of 100:5:1 and monitor daily. Qualitative results are shown in Figure 3.5.
a. Number of aerobic microorganisms
The total aerobic microbial count (in CFU/g) at 1 day, 5 days and 10 days is shown in Table 3.3.
Table 3.3. Total aerobic microorganisms (CFU/g)
Day 1
Day 5 | Day 10 | |
5.4 x 10 5 | 4.1 x 10 7 | 3.7 x 10 7 |
Maybe you are interested!
-
 Study on the effectiveness of hospital wastewater treatment by anaerobic (AO) method using improved ECO - BIO - BLOCK (EBB) biological media - 10
 -
 Study on the effectiveness of hospital wastewater treatment by anaerobic (AO) method using improved ECO - BIO - BLOCK (EBB) biological media - 2
 -
 Evaluation of Online Marketing Activities of Philip Entertainment Media and Entertainment Company Limited - 1
 -
 Evaluation of the effectiveness of selective tibial nerve resection in the treatment of lower limb muscle spasticity sequelae - 19
 -
 Study on chemical composition, toxicity and some biological effects supporting the treatment of gastric and duodenal ulcers of Sanchezia nobilis Hook.F. leaves - 2
Thus, from the results of the analysis of microbial density on the first day, that is, within 24 hours, the number of microorganisms increased significantly and after 5 days, aerobic microorganisms increased quite rapidly from 10 5 to 10 7. On the 10th day, the density of aerobic microorganisms showed a stagnation phenomenon, which is also consistent with the development law of microorganisms adhering to the improved EBB substrate.
b. Number of anaerobic microorganisms
The total anaerobic microbial counts (in CFU/g) at 1 day, 5 days and 10 days are shown in Table 3.4.
Table 3.4. Total anaerobic microorganisms (CFU/g)
Day 1
Day 5 | Day 10 | |
3.5 x 10 2 | 2.1 x 10 3 | 1.6 x 10 5 |
From table 3.2, from the first day to the 10th day, the density of anaerobic microorganisms has increased more than 2 times. Thus, the density of adherent microorganisms on the improved EBB block will ensure the requirements for implementing the next research steps.
3.1.4. Improved EBB production process
Improved EBB production technology process for hospital wastewater treatment
is shown in Figure 3.6.
Material mixing ratio
12% Sand
38%
Kazemzit
11% Xi
bamboo shoots
18% Carbonized coal
21% Zeolite
Stir the dry mixture evenly, stirring time is about 10 minutes.
Mix well wet, time
Mixing time about 15 minutes 120 ml water/300gr material
Pouring material into the mold
Compressive force from 10 to 20 kg/cm 2
After 1 hour, remove the mold to get the product.
Figure 3.6. Technological process for producing improved EBB material (used for hospital wastewater treatment)
The improved EBB product for hospital wastewater treatment has been manufactured at the Institute of Environmental Technology, Vietnam Academy of Science and Technology (see Figure 3.7).
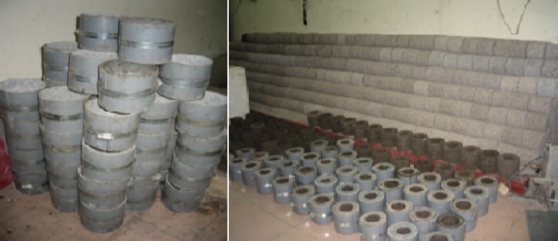
Figure 3.7. Improved EBB product
3.2. Evaluation of COD, Ammonium, TSS treatment efficiency on AO system using improved EBB biological media.
Anaerobic experimental system combined with EBB biological substrate as shown in Figure 3.8.


Figure 3.8. AO experimental system
- Medical wastewater is taken from the equalization tank of E Hospital - Hanoi with COD concentration from 200 to 390 mg/L and ammonium concentration from 10 to 40 mg/L, put into a 120 liter tank, the wastewater is put into the anaerobic column by a dosing pump.
- Maintain DO from 4.0 mg/l to 10mg/l to provide oxygen for biological processes. Maintain pH between 6.5 - 8.5.
- Adjust the dosing pump with flow rate of 0.5 l/h, 1 l/h, 2 l/h to 3 l/h Volume of each column:
V 1 = V 2 = π. R 2 .h = 3.14.(0.5) 2 . 5.25 = 4.122 (dm 3 )
Each column contains two EBB tablets Volume of water in each column:
V n1 = V n1 = 0.4122 – 0.0586.2 = 4.0048 (dm 3 )
- So with flow rate of 0.5 l/h, 1 l/h, 2 l/h to 3 l/h , equivalent to retention time T of 16 hours, 8 hours, 4 hours and 2.7 hours respectively.
The results of wastewater analysis of hospital E on April 11, 2015 and April 15, 2015 are shown in table 3.5.
Table 3.5. Composition of pollutants in wastewater of Hospital E
TT
Indicator name | Test method | Unit | Results April 11, 2015 | Results April 15, 2015 | QCVN 28:2010/ BTNMT (column B) | |
1 | pH | TCVN 6492:1999 | - | 7.6 | 7.3 | 6.5 – 8.5 |
2 | BOD5 ( 20 0 C) | TCVN 6001-1:2008 | mg/l | 135 | 142 | 50 |
3 | COD | TCVN 6491:1999 | mg/l | 270 | 284 | 100 |
4 | TSS | TCVN 6625:2000 | mg/l | 152 | 132 | 100 |
5 | NH 4 + - N | TQKT/BYT 1993 | mg/l | 17.14 | 15.53 | 10 |
6 | NO 3 - - N | SMEWW 4500 | mg/l | 1.26 | 1, 65 | 50 |
The results of the experimental system are shown in Table 1, Table 2, Table 3 of the Appendix.
3.2.1. Evaluation of COD treatment efficiency on AO system using improved EBB.
a. COD treatment results in anaerobic column
T=16 hours
T=8 hours
T=4 h
T=2.7 h
Figure 3.9. COD concentration and treatment efficiency through anaerobic column
T=16 hours
T=8 hours
T=4 h
T=2.7 h
Figure 3.10. COD treatment load through anaerobic column
Figure 3.9 shows the concentration and COD removal efficiency through the anaerobic column at different retention times and flow rates. Figure 3.10 shows the treatment load of the anaerobic column corresponding to different retention times.
The figure shows that the influent COD concentration ranges from 192 mg/l to 388 mg/l. This concentration range is consistent with the typical properties of hospital wastewater.
- At a flow rate of 0.5 l/hour corresponding to a retention time of 16 hours, the input COD has an average value of about 295.2 mg/l. The output COD has an average value of about 148 mg/l. The COD treatment efficiency in the anaerobic column ranges from 37.2% to 64.3% and has an average value of 49.1%. The average treatment load is about 0.44 kg/m 3 /day. That gives
The improved EBB treatment performance is found to be promising for further research.
- At a flow rate of 1 l/hour, corresponding to a retention time of 8 hours, the input COD has an average value of about 272 mg/l. The output COD has an average value of about 175.3 mg/l. The COD treatment efficiency in the anaerobic column ranges from 32.9% to 38.3% and has an average value of 35.5%. The average treatment load is about 0.58 kg/m3 / day. Thus, with a retention time of 8 hours, the COD treatment efficiency through the anaerobic column is quite high.
- In the 2 l/hour flow mode, corresponding to the 4-hour retention time, the input COD has an average value of 284 mg/l and the output has an average value of about 238.6 mg/l. The COD treatment efficiency in the anaerobic column ranges from 10.4% to 19.6% and has an average value of 16%. The average treatment load is about 0.54 kg/m3 / day, this treatment load does not change much compared to the treatment load in the 8-hour retention time mode. With a retention time of 4 hours, the COD treatment efficiency through the anaerobic column is low.
- At a flow rate of 3 l/hour, corresponding to a retention time of 2.7 hours, the input COD has an average value of 276.8 mg/l, the output has an average value of about 247.1 mg/l. The COD treatment efficiency in the anaerobic column has an average value of 10.4%. The average treatment load is about 0.54 kg/m 3 /day, this treatment load does not change much compared to the load
Treatment efficiency at 8-hour and 4-hour retention time modes. With 2.7-hour retention time, COD treatment efficiency through anoxic columns is low.
b. COD treatment results in aerobic column
T = 16 hours
T = 8 hours
T = 4 h
T = 2.7 h
Figure 3.11. COD concentration and treatment efficiency through aerobic column
T = 16 hours
T = 4 h
T = 8 hours
T = 2.7 h
Figure 3.12. COD treatment load through aerobic column