- Winter-Spring crop 2017 - 2018:
Results of Table 3.18 show that the green wilt disease appeared and caused damage simultaneously in all three stages of growth and development of peanut plants. In the seedling stage, the green wilt disease accounted for a rate of 0.10% (formula II, formula III and formula VI) to 0.41% (control formula). The formulas did not have statistically significant differences compared to the control formula.
At the flowering and fruiting stage, the rate of green wilt disease ranged from 0.10% (formula II) to 1.67% (control formula), the experimental formulas all had statistically significant differences compared to the control formula. This showed that applying BaD-S20D12 was effective in limiting green wilt disease at the flowering and fruiting stage, in which the advantage was applying 10 kg/ha of BaD-S20D12. Besides, at the harvest stage, green wilt disease still caused damage from 0.10% (formula II and formula III) to 1.10% (control formula), the formulas applying the product (from formula I to formula VI) all had statistically significant differences compared to the control formula. AUDPC treatment showed that formula II was the lowest (7.86), the highest was formula VII (control) without treatment (86.23), this difference was statistically significant. Through table 3.18, we see that formula II achieved the highest technical efficiency in managing the green wilt disease on peanut variety L23 in Thang Binh district, Quang Nam province.
Research on the effectiveness of limiting wilt disease on peanuts by Le Nhu Cuong (2019)
[15] In the two bacterial strains BaD-S20D12 and BaD-S18F11, it was shown that the bacterial strain BaD-S20D12 had better disease suppression ability than the control formula without bacteria, however, the number of treatments did not significantly affect the level of disease suppression.
- Spring Summer 2018:
Table 3.18 shows that the green wilt disease appeared and caused damage simultaneously in all three growth and development stages of peanuts in the Spring-Summer crop of 2018. In the seedling stage, the green wilt disease accounted for a rate of 0.10% (treatment II, treatment III) to 0.11% (control treatment). The treatments did not have statistically significant differences compared to the control treatment.
At the flowering and fruiting stage, the rate of green wilt disease ranged from 0.20% (formula II) to 1.55% (control formula), the experimental formulas from formula I to formula V all had statistically significant differences compared to the control formula. This showed that the application of BaD-S20D12 was effective in limiting green wilt disease at the flowering and fruiting stage, in which the advantage was the application of 10 kg/ha of BaD-S20D12 at the sowing stage. Besides, at the harvest stage, green wilt disease still caused damage from 0.10% (formula II, formula III) to 0.97% (control formula), the formulation application formulas (from formula I to formula V) all had statistically significant differences compared to the control formula. Similar to the 2017-2018 Winter-Spring crop, in the 2018 Spring-Summer crop, disease response was assessed throughout the crop.
The development process also showed that formula II was the lowest (11.10) and the highest was formula VII without precipitate treatment (77.33), this difference was statistically significant. AUDPC in other formulas varied from 20.86 to 45.65.
Author Le Nhu Cuong (2004) [5] when using different preparations to prevent wilt disease on peanuts in Thua Thien Hue province also showed that using the preparations significantly limited the rate of wilt disease. With different methods, the effectiveness is also different. In which, when using the preparation to water the soil before sowing, the disease prevention efficiency is the highest. Another study by author Le (2011) [92] showed that on PDA agar medium, 06 strains of Bacillus bacteria isolated from peanut root collars (S1A1, S1F3, S13E2, S13E3, S18F11, S20D12) limited the growth of Sclerotium rolfsii mycelium more than 07 other strains of bacteria isolated from peanut roots.
:Conrath et al. (2002) [61] also suggested that the effectiveness of biological control of diseases by Bacillus species is related to the effect of antibiotics in preventing the establishment of pathogens in plant tissues , stimulating systemic disease resistance, with structural and biochemical changes in plants, helping to reduce the incidence and severity of diseases in many crops. Along with the effectiveness of biological control, treatment with Bacillus spp. often helps stimulate plant growth (Lugtenberg et al., 2009; Ramprasad et al., 2014) [98], [114]. Not only on peanuts, some other plants also show that applying biological products will have a positive effect in limiting the development of pests and microorganisms that are harmful to plants. According to the study of Duong Minh (2010) [34], Trichoderma strains in the experiment were all able to control Fusarium solani causing citrus root rot in garden soil conditions with low pH (4.0 - 4.4).
3.2.3. Effects on yield components and peanut yield
The effects of using Bacillus preparations on yield components and peanut yield are shown in Table 3.18, Figure 3.18 and Figure 3.19.
Table 3.19. Factors contributing to yield and peanut yield
Recipe
experiment
Density (trees/ m2 ) | Number of fruits solid/tree | P 100 pieces (g) | NSLT (tons/ha) | NSTT (tons/ha) | |
Winter-Spring crop 2017 – 2018 | |||||
Formula I | 27 | 16.27a | 130.00 a | 43.00 b | 21.00 b |
Formula II | 28 | 15.77 ab | 136.67a | 45.90a | 25.30 a |
Formula III | 28 | 14.03 ab | 128.67a | 37.90 d | 21.30b |
Formula IV | 27 | 15.37 ab | 131.80a | 41.00 c | 19.70b |
Formula V | 27 | 12.50 b | 131.33a | 33.30 f | 19.70b |
Formula VI | 28 | 13.80 ab | 124.18a | 36.00 e | 22.30b |
Formula VII (address) | 27 | 13.43 ab | 129.00 a | 35.10 e | 20.30b |
Maybe you are interested!
-
 Grouping of Researched Pumpkin Varieties According to Yield Components
 -
 Evaluation of the effect of DH fertilizer on growth, yield and quality of some fruit trees at Thai Nguyen University of Agriculture and Forestry - 2
 -
 Evaluation of the effect of DH fertilizer on growth, yield and quality of some fruit trees at Thai Nguyen University of Agriculture and Forestry - 1
 -
 Correlation Between Riek and Sugarcane Yield - Sugarcane Crop 2
 -
 Effects of infection with edwardsiella ictaluri bacteria and cyrus pesticide on changes in some hematological parameters of striped catfish (pangasianodon hypophthalmus) - 2
Recipe
experiment
Density (trees/ m2 ) | Number of fruits solid/tree | P 100 pieces (g) | NSLT (tons/ha) | NSTT (tons/ha) | |
Spring Summer 2018 | |||||
Formula I | 27 | 14.67 ab | 121.33 bc | 36.10b | 20.30 ab |
Formula II | 28 | 16.33a | 126.33b | 43.30a | 23.00 a |
Formula III | 28 | 13.33b | 124.67 ab | 34.90 bc | 20.00 ab |
Formula IV | 27 | 13.67b | 121.00 bc | 35.30 bc | 18.30 c |
Formula V | 27 | 13.33b | 120.33 c | 32.50 bc | 19.00 c |
Formula VI | 28 | 16.67a | 125.67 b | 44.00 b | 20.07 bc |
Formula VII (address) | 24 | 13.00 b | 120.00 c | 28.10 c | 19.70 c |
NSLT NSTT
50
45
40
35
30
25
20
15
10
5
0
I
II
III
IV
V
VI
VII
Experimental formula
Yield (tons/ha)
Note: Different letters in the same column are statistically different at P < 0.05.
NSLT NSTT
50
45
40
35
30
25
20
15
10
5
0
I
II
III
IV
V
VI
VII
Experimental formula
Yield (tons/ha)
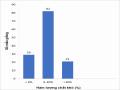
Figure 3.18. Peanut yield in Winter-Spring crop 2017 - 2018
Figure 3.19. Peanut yield in Spring-Summer crop 2018
- Winter-Spring crop 2017 - 2018:
The results in Table 3.19 show that the dosage and time of treatment of the preparation affected the yield components and the yield of L23 peanuts. The highest number of firm fruits/tree was formula I (16.27 firm fruits/tree), the lowest was formula V (12.50 firm fruits/tree), however this difference was not significant compared to the remaining formulas. The weight of 100 fruits between the formulas varied from 124.18 - 136.67 g but there was no statistical difference between the formulas. The theoretical yield between the formulas varied from 33.33 - 45.90 quintals/ha, the highest was formula II (45.90 quintals/ha), formula II also had the highest actual yield (25.30 quintals/ha) and the difference was significant compared to the remaining formulas.
- Spring Summer 2018:
In this crop, the dosage and time of treatment of the preparation had a more significant effect on the experimental formulas than in the Winter-Spring crop of 2017 - 2018 on the peanut variety L23. The formulas using the preparation BaD-S20D12 had a higher growth rate than the control formula, leading to a higher number of plants/m 2 (27 - 28 plants/m 2 ), while the control formula was 24 plants/m 2 . The number of firm fruits/plant varied from 13.00 - 16.67 fruits/plant, however, the formulas did not differ significantly from the control (except for formula II and formula VI). The theoretical yield of the formulas varied from 28.10 (control formula) - 44.00 quintals/ha (formula VI). The actual yield of the formulas varied from 18.30 - 23.00 tons/ha, but there was no statistical difference between the formulas compared to the control formula (except for formula II).
Research by Le Nhu Cuong et al. (2019) [14] also showed that using the Bacillus sp. BaD-S20D12 strain applied once before sowing was clearly effective in stimulating growth and increasing peanut yield in Thua Thien Hue compared to the control with a 26.8% increase in yield.
Thus, through the research results, we found that the dosage and time of Bacillus BaD-S20D12 treatment affected the growth, development and yield of peanut variety L23 in the Winter-Spring crop 2017 - 2018 and Spring-Summer crop 2018 in Quang Nam. The formula using Bacillus sp BaD-S20D12 at a dosage of 10 kg/ha and applied at sowing time was shown to be effective in stimulating growth, increasing the number of plant nodules and having higher yields than other experimental formulas. This result shows that when beneficial microorganisms are added early to the soil, the growth of pathogenic microorganisms will be limited, and nutrients will also be added to the crop due to the activity of beneficial microorganisms.
3.3. APPLICATION OF RESEARCH RESULTS IN PEANUT PRODUCTION IN QUANG NAM
The model was implemented in Binh Chanh commune, Thang Binh district, Quang Nam province with experimental formulas including the formula using BaD product produced from Bacillus sp . BaD-S20D12 bacteria isolated from peanuts in Central Vietnam, the formula using the commercial product Biota Max and the control formula not using the product.
3.3.1. Effect of the preparation on growth and development of peanuts
3.3.1.1. Effect on growth rate
The results in Table 3.20 show that there is no difference in the germination rate in the experimental formulas and the peanuts also have a very high germination rate of up to over 90% in all experimental formulas. Although all 3 formulas have no statistical difference, however, the bacterial preparation Bacillus BaD-S20D12 (CT1 - BaD) tends to increase the germination rate of peanuts. Peanuts grow faster and have a higher germination rate when treated with the preparation, which may be related to stimulating the germination ability of the seeds or these bacteria have the ability to limit diseases on peanuts during the germination stage, making peanuts grow better (Le et al., 2012a; Tonelli et al., 2011) [93], [129].
Evaluation of the growth stimulating ability of three different bacterial strains on peanut varieties in the Central Highlands in light loam and sandy soil also showed that the bacterial preparation Bacillus sp. BaD-S20D12 gave the best results, increasing the germination rate compared to the control by 8%. In addition, the bacterial preparation Bacillus sp. BaD-S20D12 also showed to increase the germination rate on some vegetable plants such as tomatoes (Thai Thi Huyen et al., 2014) [31], chili and green cabbage (Le Nhu Cuong, 2015) [8].
Table 3.20. Growth rate of peanuts in experimental model
Unit: %
Experimental formula
Growth rate | |
Address | 92.3a |
CT1 - BaD | 94.3a |
CT2 - Biota | 91.3a |
Note: Different letters in the same column are statistically different at P < 0.05.
3.3.1.2. Effects on growth and nodulation parameters of peanuts
The research results showed that the preparation BaD-S20D12 (CT1 - BaD) increased plant height, branch length and the number of nodules at the young fruit stage compared to the control (Table 3.21). However, the formula using Biota preparation (CT2 - Biota) did not have a clear difference compared to the control.
The indicators of plant height, length of first-order branches and number of nodules in the formula using BaD-S20D12 (CT1 - BaD) were all higher than the control and the formula using commercial products (CT2 - Biota). Specifically, the plant height of CT1 - BaD was 53.4 cm, the length of the first first-order branches was 51.6 cm, the number of nodules in the flowering stage was 139 nodules/plant and the number of nodules in the young fruit stage was 169 nodules/plant, in each indicator, this difference was statistically significant compared to other formulas. From the results of Table 3.21, it was confirmed that the Bacillus BaD- S20D12 bacterial preparation has the ability to stimulate growth for peanut plants.
Table 3.21. Some indicators related to growth and development of peanuts in experimental formulas
Experimental formula
Tree height (cm) | Length of first pair of primary branches (cm) | Number of leaves on main stem (leaves/stem) | Number of nodules at flowering stage (nodule/plant) | Number of nodules at fruiting stage (nodules/plant) | |
Address | 44.1b | 48.0b | 11.8a | 116a | 125b |
CT1 – BaD | 53.4a | 51.6a | 12.1a | 139a | 169 a |
CT2 – Biota | 47.7b | 50.3 ab | 11.7a | 121a | 136b |
Note: Different letters in the same column are statistically different at P < 0.05.
3.3.1.3. Effects on flowering characteristics
The results of Table 3.22 show that all 3 formulas had a total flowering time of 24 days and had 2 peak flowering periods. However, the number of flowers in the first 10 days in the formula using BaD-S20D12 (CT1 - BaD) was 23.7 flowers/tree, increasing the number of flowers in the first 10 days compared to the control and the formula using Biota (CT2 - Biota), this difference is statistically significant. Although the total number of flowers per tree between the formulas ranged from 48.7 to 53.3 flowers/tree and this difference is not statistically significant, the number of flowers that bloom early will increase the number of firm fruits on the tree (Nguyen Minh Hieu et al., 2003) [28], because late-blooming fruits may not have enough nutrients when harvested, so they are flat or have low seed mass.
Table 3.22. Effect of bacterial preparations on flowering characteristics of peanuts
Experimental formula
Total flowering time (days) | Number of flowering periods (batch) | Number of flowers in the first 10 days (flowers/plant) | Number of flowers in the first 20 days (flowers/plant) | Total number of flowers on plant (flowers) | |
Address | 24 | 2 | 19.1b | 43.3a | 48.7a |
CT1 – BaD | 24 | 2 | 23.7a | 47.9a | 53.5a |
CT2 – Biota | 24 | 2 | 21.0b | 45.8a | 49.2a |
Note: Different letters in the same column are statistically different at P < 0.05.
3.3.2. Impact on peanut wilt disease group
The results of Table 3.23 show that collar rot and gray moldy root wilt do not cause damage to peanut fields. Some major wilt diseases were recorded. Of which, black moldy root wilt, white moldy root wilt and pale green wilt, in the formula using BaD-S20D12 (CT1 - BaD) all have the ability to limit the disease, the lowest plant death rate among the formulas. Specifically, in the formula CT1 - BaD, the plant death rate due to black moldy root wilt was 0.71%, white moldy root wilt was 0.92% and pale green wilt was 1.30%, this difference is statistically significant compared to the control formula and the formula using commercial products. The data in Table 3.23 also show that white moldy root wilt causes more damage, but using BaD-S20D12 (CT1 - BaD) significantly reduces the disease rate compared to the control.
Table 3.23. Plant death rate due to some major wilt diseases on peanuts
Unit: %
Recipe
Wilted black mold | Wilted white mold | Withered and pale | |
Address | 3.01 c | 6.28b | 2.11b |
CT1 – BaD | 0.71a | 0.92a | 1.30 a |
CT2 – Biota | 2.81b | 1.00 a | 1.75a |
Note: Different letters in the same column are statistically different at P < 0.05.
3.3.3. Productivity and economic efficiency
Whether a product can be commercialized or not, in addition to its technical efficiency, must also bring economic efficiency. Although determining the cost of the experimental product will be difficult and not completely accurate. However, based on the materials and production process of the product as well as the selling price of the products on the market, we can preliminarily evaluate the economic efficiency of using the product through Table 3.24.
Table 3.24. Economic efficiency of using Bacillus products for peanuts in Quang Nam
Experimental formula
Actual yield (kg/ha) | Difference yield (kg/ha) | Additional cost (1,000 VND/ha) | Selling price (1,000) VND/kg) | Total revenue (1,000) VND/ha) | Additional income (1,000 VND/ha) | |
Address | 2,150 | - | - | 20 | 43,000 | - |
CT1 - BaD | 2,550 | 400 | 2,000 | 20 | 51,000 | 6,000 |
CT2 - Biota | 2,300 | 150 | 2,000 | 20 | 46,000 | 1,000 |
From Table 3.24., it can be seen that the BaD-S20D12 preparation (CT1 - BaD) clearly increased productivity and economic efficiency compared to the formulas using Biota (CT2 - Biota) and the control formula without using biological preparations at the end of the 2018 - 2019 Winter-Spring crop.
The research results showed that compared to the control without using the product, the formula using the product BaD-S20D12 (CT1 - BaD) increased the yield by 400 kg/ha, reaching 18.6% and increased by 150 kg/ha, reaching 7.0% compared to the experimental formula using the commercial product (CT2 - Biota). The total revenue in the formula using the product BaD- S20D12 (CT1 - BaD) was also the highest (51,000,000 VND), leading to an additional income of 6,000,000 VND compared to the control and 5,000,000 VND compared to the formula using the commercial product (CT2 - Biota).
Thus, the preparation BaD–S20D12 (CT1 - BaD) clearly increased productivity and economic efficiency in peanut production compared to the formulas using Biota (CT2 - Biota) and the control without using biological preparations.