RIE K (%)
Yield (ton/ha)
Figure 3.16. Correlation between RIE K and sugarcane yield - sugarcane crop 2
RIE K (%)
Yield (ton/ha)
Figure 3.17. Correlation between RIE K and sugarcane yield - average of 3 crops
Table 3.30. K use efficiency at different fertilization levels
Recipe
Sugarcane crop | Total K 2 O accumulation (kg K 2 O/ha) | Difference compared to no K 2 O fertilization (%) | K utilization coefficient in mineral fertilizers RE K (%) | |
1. Background | Sugarcane | 64.72 | - | - |
Sugarcane root 1 | 70.93 | - | - | |
Sugarcane root 2 | 76.99 | - | - | |
TB | 70.88 | - | - | |
2. Background | Sugarcane | 116.08 | 51.36 | 41.45 |
+ 100 K 2 O | Sugarcane root 1 | 124.42 | 53.49 | 46.67 |
Sugarcane root 2 | 132.04 | 55.05 | 47.14 | |
TB | 124.18 | 53.30 | 45.09 | |
3. Background | Sugarcane | 133.82 | 69.10 | 39.46 |
+ 150 K 2 O | Sugarcane root 1 | 143.00 | 72.07 | 43.50 |
Sugarcane root 2 | 152.75 | 75.76 | 45.23 | |
TB | 143.19 | 72.31 | 42.73 | |
4. Background | Sugarcane | 148.38 | 83.66 | 36.88 |
+ 200 K 2 O | Sugarcane root 1 | 159.61 | 88.68 | 40.93 |
Sugarcane root 2 | 170.88 | 93.89 | 42.99 | |
TB | 159.63 | 88.75 | 40.27 | |
5. Background | Sugarcane | 160.23 | 95.51 | 34.24 |
+ 250 K 2 O | Sugarcane root 1 | 168.27 | 97.34 | 36.21 |
Sugarcane root 2 | 177.46 | 100.47 | 37.02 | |
TB | 168.64 | 97.76 | 35.82 | |
6. Background | Sugarcane | 163.87 | 99.15 | 29.75 |
+ 300 K 2 O | Sugarcane root 1 | 171.61 | 100.68 | 31.29 |
Sugarcane root 2 | 181.80 | 104.81 | 32.30 | |
TB | 172.43 | 101.55 | 31.11 |
Maybe you are interested!
-
 Correlation Chart Between Inflation Fluctuation and Loan-to-Assets Dispersion
 -
 Evaluation of the effect of DH fertilizer on growth, yield and quality of some fruit trees at Thai Nguyen University of Agriculture and Forestry - 2
 -
 Evaluation of the effect of DH fertilizer on growth, yield and quality of some fruit trees at Thai Nguyen University of Agriculture and Forestry - 1
 -
 Correlation Between Oil Prices and Rubber Prices in the Period 2006-2016
 -
 Correlation Between Some Clinical and Paraclinical Factors With Asmih Reduction
Figure 3.18. Some images of field experiments on K fertilizer application
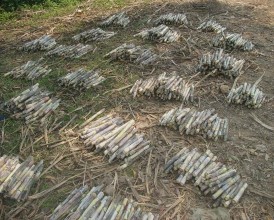
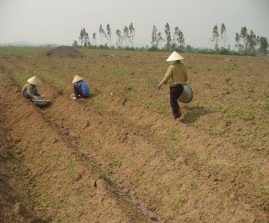
Preparing cuttings - Experimenting on K fertilizer dosage Basal fertilizer before planting - Experimenting on K fertilizer dosage
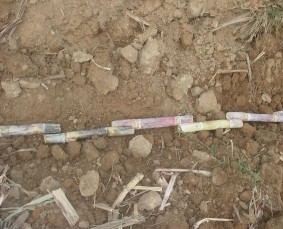
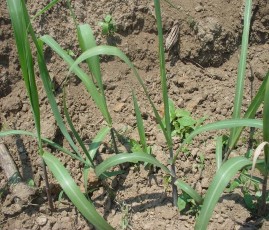
Sugarcane cultivation - Experiment on K fertilizer dosage Sugarcane growth - Experiment on K fertilizer dosage
Sugarcane growth - Experimental K fertilizer dose
Sugarcane Harvesting - Experimental K Fertilizer Dose
3.4. Balance K and determine the appropriate amount of K fertilizer for sugarcane based on nutritional balance in Lam Son area
3.4.1. K balance for sugarcane at different K fertilization levels
Based on the research results on the relationship between the amount of K fertilizer and the yield, quality of sugarcane, sugar yield and the amount of K lost according to the harvested product; the results of determining the amount of K supplied by rainwater; the amount of K lost due to erosion; the amount of K lost due to leaching, the K balance for sugarcane at different fertilizer levels (0; 100; 150; 200; 250 and 300 kg K 2 O / ha), the MY 55-14 sugarcane variety, grown on typical gray soil, fertilized with 200 N + 100 P 2 O 5 , without irrigation in Lam Son area is specifically determined as follows:
General equilibrium equation : F K + K R = K GY + K E + K L .
In there
F K: amount of K from mineral fertilizer application (kg K 2 O/ha)
K R : amount of K supplied by rainwater (K 2 O/ha/year)
K GY : amount of K lost according to harvested products (kg K 2 O/ha/crop). KE : amount of K lost due to erosion (kg K 2 O/ha/year)
K L : amount of K lost due to leaching (kg K 2 O/ha/year)
The results of the balance calculation presented in Table 3.31 (Figure 3.19- 3.21) show that: under cultivation conditions without returning NLM after harvest, without K fertilization, the negative K balance is at an average of 127 K 2 O/ha/crop. With mineral K fertilization, the K balance decreases from minus 74.6 kg K 2 O/ha at the fertilization level of 100 kg K 2 O/ha to minus 0.4 kg K 2 O at the fertilization level of 200 kg K 2 O/ha. A positive K balance is achieved at the fertilization level of 250 kg K 2 O/ha or more: positive 47.5 kg K 2 O/ha and 93.6 kg K 2 O/ha at the fertilization levels of 250 kg K 2 O/ha and 300 kg K 2 O/ha, respectively.
From the above K balance calculation results, it can be seen that to ensure that the K reserve in the soil does not decrease, the minimum amount of K needed to fertilize sugarcane is 200 K 2 O/ha/crop. This result is completely consistent with the result of determining the amount of K to fertilize from the correlation equation according to Lecompt (1962).
110
Table 3.31. K balance for sugarcane at different K fertilizer rates
Recipe
Sugarcane crop | Quantity | K | head | enter | Quantity | K | output | Balance | K | |
Due to division Mineral supply | By water rain supply | Lost by sugarcane products | Lost by NLM harvest | Lost due to surface erosion | Loss due to depth leaching | |||||
Sugarcane | - | 9.91 | 41.46 | 23.26 | 31.63 | 43.35 | -129.66 | |||
1. Background | Sugarcane root 1 Sugarcane root 2 | - - | 6.82 7.91 | 50.38 56.63 | 20.55 20.36 | 30.90 21.68 | 36.76 28.65 | -131.72 -119.38 | ||
TB | - | 8.21 | 49.49 | 21.39 | 28.07 | 36.25 | -126.94 | |||
Sugarcane | 100 | 9.91 | 74.70 | 41.38 | 24.26 | 42.13 | -72.61 | |||
2. Background + 100K 2 O | Sugarcane root 1 Sugarcane root 2 | 100 100 | 6.82 7.91 | 80.54 90.11 | 43.88 41.93 | 26.99 18.81 | 35.72 27.84 | -80.35 -70.86 | ||
TB | 100 | 8.21 | 81.78 | 42.40 | 23.45 | 35.23 | -74.55 | |||
Sugarcane | 150 | 9.91 | 87.35 | 46.47 | 21.16 | 38.81 | -33.88 | |||
3. Base + 150 K 2 O | Sugarcane root 1 Sugarcane root 2 | 150 150 | 6.82 7.91 | 95.41 105.42 | 47.59 47.33 | 24.08 16.87 | 32.90 25.64 | -43.16 -37.35 | ||
TB | 150 | 8.21 | 96.06 | 47.13 | 20.70 | 32.45 | -38.14 | |||
Sugarcane | 200 | 9.91 | 99.60 | 48.78 | 18.96 | 36.66 | 5.93 | |||
4. Base + 200 K 2 O | Sugarcane root 1 Sugarcane root 2 | 200 200 | 6.82 7.91 | 108.84 119.48 | 50.77 51.40 | 21.34 14.75 | 31.08 24.22 | -5.22 -1.93 | ||
TB | 200 | 8.21 | 109.31 | 50.32 | 18.35 | 30.65 | -0.41 | |||
Sugarcane | 250 | 9.91 | 106.58 | 53.65 | 16.69 | 30.28 | 52.69 | |||
5. Base + 250 K 2 O | Sugarcane root 1 Sugarcane root 2 | 250 250 | 6.82 7.91 | 117.85 123.80 | 50.42 53.66 | 19.72 13.67 | 25.67 20.00 | 43.11 46.76 | ||
TB | 250 | 8.21 | 116.07 | 52.57 | 16.69 | 25.32 | 47.51 | |||
Sugarcane | 300 | 9.91 | 107.73 | 56.14 | 15.57 | 28.69 | 101.77 | |||
6. Base + 300 K 2 O | Sugarcane root 1 Sugarcane root 2 | 300 300 | 6.82 7.91 | 120.61 126.71 | 51.00 55.09 | 21.04 17.82 | 24.32 18.95 | 89.78 89.33 | ||
TB | 300 | 8.21 | 118.35 | 54.08 | 18.14 | 23.99 | 93.60 | |||
K balance
Potassium fertilizer formula
Figure 3.19. Potassium balance at different K 2 O fertilization rates - young sugarcane crop
K balance
Potassium fertilizer formula
Figure 3.20. Potassium balance at different K 2 O fertilizer doses - sugarcane crop 1
K balance
Potassium fertilizer formula
Figure 3.21. Potassium balance at different K 2 O fertilizer doses - sugarcane crop 2
3.4.2. K balance for sugarcane under current production conditions
3.4.2.1. Balance diagram
Based on the results of the investigation and assessment of basic conditions and current status of sugarcane production, the relationship between input and output K sources of K balance for sugarcane under current production conditions in Lam Son Thanh Hoa region is determined and presented in Figure 3.22.
Input
Potassium supplied from mineral fertilizers (IN1)
Potassium provided from organic fertilizer (IN2 )
Potassium supplied from rainwater
(IN 3)
Intermediary
Potassium nutrition stored in soil
Output
Potassium loss due to depth leaching (OUT 4)
Potassium loss due to surface erosion (OUT 3)
Potassium loss by raw sugarcane product (OUT1)
Potassium loss in sugarcane leaves after harvest (OUT 2)
Complete potassium balance (IN1 + IN2 + IN 3) –
(OUT1 + OUT 2 + OUT 3 + OUT 4)
Potassium balance by product (IN1 + IN2 + IN 3) – (OUT1 + OUT 2)
Balance
Figure 3.22. Diagram of the relationship between input and output sources of K balance for sugarcane under current production conditions in Lam Son region
3.4.2.2. Amount of input and output K nutrient sources
 Input K source
IN1 : K provided from mineral fertilizers:
Under current sugarcane production conditions, with an average fertilization rate of 2,000 kg/ha of Lam Son NPK fertilizer (6.4 - 3.2 - 6.6 - HC 9.5), the amount of K input from mineral fertilizer is 132 kg K 2 O /ha.
IN2 : K provided from organic fertilizers:
To determine the amount of K provided from organic sources in the composition of Lam Son NPK fertilizer, we analyzed the chemical composition of organic raw materials for fertilizer production (sugar factory sludge), the results are presented in Table 3.32.
Table 3.32. Chemical composition of organic raw materials for producing Lam Son NPK fertilizer
Ingredient
pH (KCl) | Dry matter (%) | N | P2O5 | K2O | |
(% dry weight ) | |||||
Sugar factory sludge | 7.1 | 31.5 | 1.76 | 1.91 | 1.28 |
With the chemical composition listed in Table 3.32 and the fertilizer amount of 2,000 kg/ha, the amount of K provided from organic sources in Lam Son NPK fertilizer is 4.2 kg K 2 O. In addition, 5.8 kg N and 6.3 kg P 2 O 5 are added to the soil .
IN 3 : K supplied from rain: 8.2 kg K 2 O/ha.
 Output K source
OUT 1 + OUT 2: K loss according to raw sugarcane products and post-harvest NLM, determined on the basis of sugarcane yield and RIE K .
- Productivity: calculated based on the productivity of newly planted sugarcane on hilly land through investigation,
average 62 tons/ha.
- RIE K (%): determined by the equation: RIE K = 0.007X - 0.327. In which X is sugarcane yield. RIE K : 107 kg K 2 O/ha
OUT 3: K loss due to erosion: 17.7 kg K 2 O/ha
OUT 4 : K loss due to leaching: 26.7 kg K 2 O/ha