and reference [15] shows that the content of these elements in seafood is very small and does not affect the determination of arsenic content in seafood.
H 2 S also strongly affects the process of forming color compounds with Silver diethyldithiocarbamate solution, however, in this study, we analyzed Arsenic in seafood. During the analysis, the sample must be mineralized before determining the Arsenic content with a mixture of strong oxidizing acids. In this environment, because H 2 S is a weak acid, it was removed from the sample before analyzing Arsenic.
3.2.4. Construction of standard curve for determination of Arsenic.
After examining the conditions and factors affecting the formation of color compounds, we selected the optimal conditions to construct the standard curve as follows:
+ Optimal wavelength: 520nm.
+ Optimal time: 20 minutes.
+ Optimal pH: 1.
+ Volume of Silver diethyldithiocarbamate reagent: 4ml.
+ Volume of standard Arsenic solution: 50ml.
Construction of standard curve for determination of Arsenic
Prepare a series of solutions with varying concentrations of arsenic as shown in the table.
2.5. The above solutions are prepared from 10ppm Arsenic standard solution, put into the reaction vessel of the Asin generation system, add 1ml of 10% KI solution, 10ml of 15% HCl solution, and 4g of Zn. Stirring the reaction vessel for 20 minutes creates Asin vapor, which is led into the absorption vessel to react with 4ml of Silver diethyldithiocarbmate reagent solution to create a colored compound, then measure the optical density of the colored compound at a wavelength of 520nm with the comparison solution of chloroform. The dependence of the absorbance of the colored compounds on the concentration of Asin is given in the table
3.5 and the standard curve is shown in Figure 3.6.
Table 3.5 . Dependence of absorbance on arsenic concentration
TT
1 | 2 | 3 | 4 | 5 | 6 | |
C Arsenic(III) ( g/l) | 5 | 10 | 20 | 50 | 75 | 100 |
A | 0.042 | 0.091 | 0.181 | 0.368 | 0.552 | 0.789 |
Maybe you are interested!
-
 Effect of Initial Glyphosate Concentration on Processability of Electrochemical Fenton Process
 -
 Comparison of the effects of two methods of complete intravenous anesthesia with Propofol with and without target concentration control - 2
 -
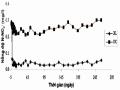 N-No2- Concentration (Mg/l) of Treatment Area and Control Area During the Test Period: (♦) Treatment Area, (■) Control Area.
 -
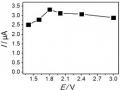 Effects of Voltage (A); Kcl Concentration (B); Electrolysis Time (C); and Stirring Time (D) on Hg Signal (Ii)
 -
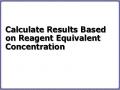 Calculate Results Based on Reagent Equivalent Concentration
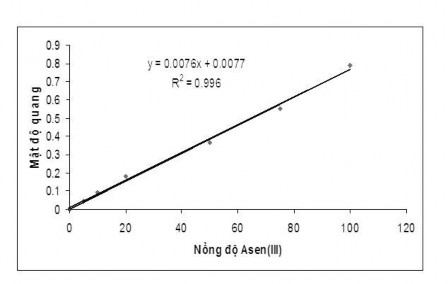
Figure 3.6. Dependence of absorbance on arsenic concentration
The equation of the standard line is: Y= 0.0076X + 0.0077
Correlation coefficient R 2 = 0.996
In summary, the Arsenic Standard Curve has a high correlation coefficient and a wide linear range, thus allowing the analysis of very small trace amounts of Arsenic.
3.2.5. Method detection limit
The method detection limit is the lowest detectable concentration that is greater than the blank sample with 99% confidence.
In this study, we determined the detection limit of the method by measuring 7 times the arsenic solution sample with a concentration of 10( g/l), conditions
The conditions for determining the standard curve are the same as when establishing the standard curve, accepting that the difference between the standard deviation of the sample and the blank sample is negligible. The results are given in Table 3.6.
Table 3.6. Survey of Arsenic recovery
TT
Arsenic content ( )g/l) | Recovery (%) | |
1 | 11.02 | 110.2 |
2 | 10, 11 | 101.1 |
3 | 11.13 | 111.3 |
4 | 8.87 | 88.7 |
5 | 11.06 | 110.6 |
6 | 9.78 | 97.8 |
7 | 8.52 | 85.2 |
TB | 10.07 | 100.7 |
From the results in table 3.6 we have: Average value: 10.07
Standard deviation(S): 0.154 Degrees of freedom(n-1): 6
T-value with 6 degrees of freedom and 99% confidence level: 3.143 Detection limit (GHPH): GHPH= S xt = 0.5( g/l)
3.3. Total Arsenic Analysis Procedure.
3.3.1 Investigation of the effect of acid composition and concentration on the mineralization process of the sample.
The process of decomposing seafood samples after freeze-drying requires the use of strong acids as agents to decompose and oxidize the samples. Therefore, the composition and ratio of acids must be selected so that the sample decomposition process is thorough but does not lose the amount of arsenic in the analyzed sample.
Concentrated HNO 3 acid and HClO 4 acid have strong oxidizing properties but low boiling points, respectively: 121 0 C and 203 0 C. If only one of these two acids is used to mineralize the sample in an open system, the sample will not be completely decomposed due to heat.
The boiling points of these two acids are low. On the other hand, if only HClO 4 acid is used to treat the sample, it can easily cause fire or explosion. Concentrated H 2 SO 4 acid has strong oxidizing properties and has a much higher boiling point than the two acids above: 339 0 C. However, if concentrated H 2 SO 4 is used alone , the sample will boil slowly, the organic substances will burn to form carbon residue, causing low recovery efficiency because Arsenic is absorbed on the carbon residue. Therefore
We use a mixture of the above acids to decompose the sample.
To investigate the effect of acids on the sample decomposition process, we mineralized 0.1g of clams in a reaction flask with 20ml of As(III) 10( ) standard solution added to the arsenic.g / l ) , then we proceed to mineralize the sample with a mixture of acids with different compositions and ratios as shown in Table 3.7. Then add 1ml of 10% KI solution to convert As(V) to As(III), 10ml of 15% HCl solution, 4g of clean zinc to reduce As(III) to Asin. Stirring the reaction vessel for 20 minutes creates Asin vapor, the Asin vapor is led into the absorption vessel and reacts with 4ml of Silver diethyldithiocarbmate reagent solution in the absorption vessel to create a colored compound, then measure the optical density of the colored compound at a wavelength of 520nm with the comparison solution of chloroform.
The efficiency of acid mixtures was evaluated through recovery. The effect of acid and acid concentration on recovery efficiency is given in Table 3.7 Table 3.7 . Effect of acid and acid concentration on recovery efficiency
Concentrated acids (ml)
Temperature ( 0 C) | Recovery (%) | |||
HNO 3 | HClO 4 | H 2 SO 4 | ||
10 | 0 | 0 | 250 | 22.5 |
5 | 5 | 0 | 250 | 42.6 |
0 | 0 | 5 | 250 | 20 |
5 | 0 | 5 | 250 | 75.2 |
1 | 1 | 1 | 250 | 80.8 |
1
1 | 3 | 250 | 86.5 | |
1 | 1 | 5 | 250 | 97.8 |
The results obtained in table 3.7 show that:
*When only using 98% concentrated H 2 SO 4 , the recovery rate is 20%. When only using HNO 3 acid , the recovery rate of Arsenic is only 22.5% at 250 0 C. When only using a mixture of 5ml HNO 3 and 5ml concentrated HClO 4 , the recovery rate is 42.6%. The following survey results show that when using a mixture of acids with
The ratio: HNO 3 : HClO 4 : H 2 SO 4 is 1:1:5, the best recovery efficiency is 97.8% in the sample decomposition time of 30 minutes.
Therefore, we used a mixture of these three acids with the above composition and ratio to mineralize the sample throughout the research process.
3.3.2 Investigation of the efficiency of the sample mineralization process.
To evaluate the accuracy of the method and the efficiency of the sterilization process of seafood samples, we proceed as follows:
Take 50ml of 50ppb Arsenic (V) solution and put it in the reaction vessel. Add 1ml of 10% KI solution to convert As(V) to As(III), 10ml of 15% HCl solution, 4g of clean zinc, stir magnetically in the reaction vessel for 20 minutes to create Asin vapor, the Asin vapor is led into the absorption vessel to react with 4ml of Silver diethyldithiocarbmate reagent solution in the absorption vessel to create a colored compound, then measure the optical density of the colored compound at a wavelength of 520nm with the comparison solution of chloroform.
- Use a pipette to accurately draw 0.25ml of 10ppm Arsenic solution, put it in a 50ml volumetric flask, add 1ml of distilled water, 2ml of HNO 3 : HClO 4 (1:1) mixture, 5ml of concentrated H 2 SO 4 solution . Then, boil at 250 0 C for 30 minutes, let cool, make up to the mark with distilled water, shake well, then put it in the flask.
reaction, add 1ml of 10% KI solution to convert As(V) to As(III), 10ml of 15% HCl solution, 4g of clean zinc, stir magnetically in the reaction flask for 20 minutes to create Asin vapor, the released Asin vapor reacts with 4ml of Silver diethyldithiocarbmate reagent solution in the absorption flask to create a colored compound, then
Then, measure the optical density of the colored compound at 520nm wavelength with chloroform as a comparison solution.
- Pipette exactly 0.25ml of DMA 10ppm dimethylasinic acid solution into a 50ml volumetric flask, add 1ml of distilled water, 2ml of HNO 3 :HClO 4 (1:1) mixture, 5ml of concentrated H 2 SO 4 , boil at 250 0 C for 30 minutes, shake well and let cool, then put into the reaction flask, add 1ml of 10% KI solution, 10ml of
15% HCl solution; 4g clean zinc, magnetic stirring in the reaction vessel for 20 minutes to produce Arsenic vapor, Arsenic vapor is led into the absorption vessel and reacts with 4ml of Silver diethyldithiocarbmate reagent solution in the absorption vessel to create a colored compound, next, measure the optical density of the colored compound at 520nm wavelength with chloroform as a comparison solution.
The results of the experiments to investigate the recovery of Arsenic are given in Table 3.8.
Table 3.8. Investigation of Arsenic recovery during sample mineralization
STT
Standard solution | Concentration (ppb) | Optical density (A) | Efficiency (%) | |
1 | As +5 | 50 | 0.364 | 98.37 |
2 | As +5 (no oxidation) | 50 | 0.370 | 100 |
3 | DMA | 50 | 0.362 | 97.83 |
From the results shown in Table 3.8, it can be seen that when mineralizing the standard Arsenic solution and the Dimethylasinic Acid-DMA solution, the concentration is the same.
The absorbance of the colored compounds of the above solutions is approximately equal to the absorbance of the unoxidized As +5 standard solution.
Thus, the efficiency of the sample mineralization process is quite high, and the sample mineralization process with the volume ratio of HNO 3 : HClO 4 : H 2 SO 4 (concentrated) = 1: 1: 5 does not affect the optical absorption of the colored compound. The amount of arsenic lost during the sample mineralization process is negligible. Therefore, we use the above sample mineralization process to conduct the mineralization of seafood samples in
research process
3.3.3. Total Arsenic Analysis Procedure.
From the survey results and selection of optimal conditions: types of acids, acid concentrations, effects of sample mineralization process, the Arsenic analysis process is given as follows:
The seafood sample is washed with distilled water twice, stored in the freezer until completely frozen, then dried by vacuum freeze-drying. Next, the sample is crushed and weighed accurately at 0.1g.
Put into a 50ml reaction flask, add 1ml of double distilled water, 2ml of concentrated HNO 3 : HClO 4 mixture (1 : 1), 5ml of concentrated H 2 SO 4 solution , boil at 250 0 C for 30 minutes.
After the sample has completely decomposed, let it cool, and make up to 50ml, then convert As(V) to As(III) with 1ml of 10% KI solution, reduce As(III) to Asin with 10ml of 15% HCl solution, 4g of zinc, Asin vapor is led into the absorption flask and will react with 4ml of Silver diethyldithiocarbmate reagent solution in the absorption flask to create a colored compound, then measure the optical density of the colored compound at a wavelength of 520nm with chloroform as a comparison solution.
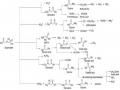
The total arsenic analysis procedure is summarized in the following diagram:
Seafood sample
Cleaning Freeze Drying Grinding
0.1g sample
2ml HNO 3 and HClO 4 . 5ml H 2 SO 4.
Heat at 250 0 C
within 30 minutes.
The sample has been sterilized.
Make up to 50ml.
Solution
1 ml KI 10%,
10ml 15% HCl,
4 g Zn.
Asin
4ml Silver diethyldithiocarbamate
Color Compound
Optical measurement
Figure 3.7 . Total Arsenic Analysis Procedure