- -
The variation of nitrite concentration of Hoa Muc lake water during the survey period from April 2011 to December 2011 is shown in Figure 3.48. Nitrite concentration of the control area is always greater than the Vietnamese standard for surface water quality, the B2 limit of N - NO2 is 0.5 mg/l. After treatment, the N - NO3 concentration of the treatment area decreased rapidly in the first day, then continued to decrease and remained below 0.5 mg/l.
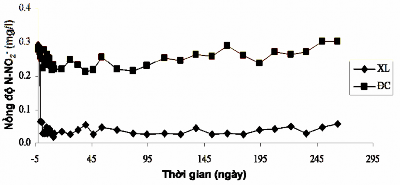
Figure 3.48. N-NO2- concentration (mg/l) of the treatment area and the control area during the test period: (♦) treatment area, (■) control area .
The variation of TN concentration over time is shown in Figure 3.49. From Figure
3.49 found that TN concentration decreased sharply after treating the lake with B90-La during the period from April 2011 to December 2011.
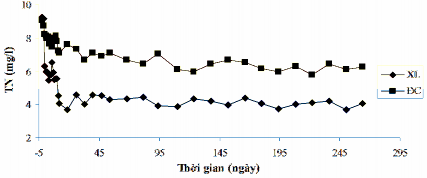
Figure 3.49. Changes in TN values (mg/l) of the treatment area and the control area during the test period: (♦) treatment area, (■) control area .
Along with phosphorus (P), nitrogen (N) is also a factor that determines the eutrophication of water bodies. Nitrogen and phosphorus are called “limiting factors” for eutrophication. However, depending on the concentration of N and P in water and the ratio of TN/TP, either the element N or the element P will determine the eutrophication of water bodies. The change of the ratio of TN/TP of Hoa Muc lake water over time is shown in Figure 3.50.
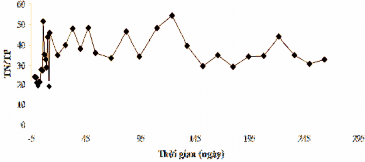
Figure 3.50. TN/TP ratio according to processing time .
From Figure 3.50, it can be seen that the TN/TP ratio of Hoa Muc lake water when treated with B90-La material fluctuates over time between 19 and 55. In general, in the treated area, the TN/TP ratio tends to increase. At some times, the TN/TP ratio is greater than 50 (on the 6th and 124th days after spraying). This can confirm that phosphorus is the limiting factor of Hoa Muc lake water in the months of the study. Thus, the phosphorus treatment strategy to prevent eutrophication of Hoa Muc lake is more effective than the nitrogen treatment strategy.
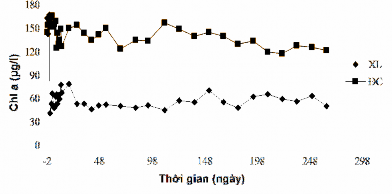
Figure 3.51. Chl a concentration (µg/l) of the treated area and the control area during the test period: (♦) treated area, (■) control area .
Chl a concentration of Hoa Muc lake water changes over time as shown in Figure 3.51. According to Chapman [31], Chl a concentration in eutrophic water bodies ranges from 5 – 140 µg/L, while Chl a concentration in nutrient-poor water bodies rarely exceeds 2.5 µg/L. The Chl a value of Hoa Muc lake at the beginning of the survey ranged from 145 – 160 µg/L (April 2011). After treatment with B90-La, Chl a concentration decreased to 50 µg/L and remained at this level throughout.
time until December 2011. Meanwhile, in the control area, there was little change and it remained at a high level (about 140 µg/L). This can confirm that B90-La not only has the ability to adsorb PHT, but also reduces the amount of algae cells in the lake.
3.7.3.2. pH factor
pH is also an important indicator of water that needs to be determined. The pH of Hoa Muc lake water depends on many factors such as the seasons of the year, rainfall, water flow from the sewers, etc. In the summer, the pH of the lake increases compared to the other seasons of the year, due to the development of algae blooms in the lake around June - July in 2011. The change in pH value of the lake water before and after 12 days of treatment shown in Figure 3.52 shows that the pH value of the treated area and the control area changed similarly during the treatment period. After B90-La treatment, the pH value in the treated area decreased rapidly compared to the control area. After 24 hours, the pH decreased from 8.85 to 8.12, then the pH continued to decrease to 7.55 (12 days after spraying B90-La).
Figure 3.52. pH values of treated and control areas 2 days before treatment and 12 days after treatment: (♦) treated area (■) control area .
The change in pH value of the treated area and the control area during the test period from April 2011 to December 2011 is shown in Figure 3.53, showing that after 40 days of treatment, the pH of the treated area and the control area increased during the summer months. In the summer, when the water temperature increased during the months from May 2011 to October 2011, the growth rate of algae increased, increasing the pH of the two areas. In general, the pH of Hoa Muc lake changed little and fluctuated between 7.5 - 8.8; within the limit B1 of the Vietnamese Standard on surface water quality.
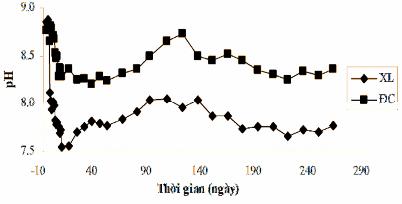
Figure 3.53. pH values of the treatment area and the control area during the test period: (♦) treatment area (■) control area .
3.7.3.3. Temperature
As we know, water temperature depends a lot on the season and time of day. According to research, the water temperature of Hoa Muc Lake fluctuates from 16 - 30oC. When the temperature drops (about 15 - 17oC), algae begin to die and release nutrients (nitrogen, phosphorus, etc. including toxins contained in algae cells) into the water column. The results of measuring the water temperature of Hoa Muc Lake from April 2011 to December 2011 are presented in Figure 3.54, showing that in the control area, when the water temperature begins to decrease in winter (222 days after treatment), the PHT concentration and nitrate concentration increase (Figure 3.44 and Figure 3.47). Meanwhile, in the treatment area, the PHT concentration and nitrate concentration remain almost unchanged during this time.
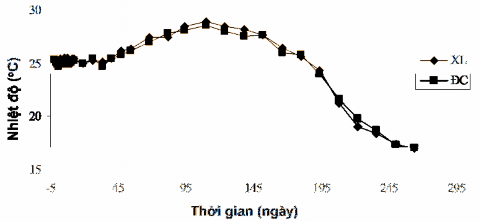
Figure 3.54. Water temperature of Hoa Muc lake in the treatment area and control area during the test period: (♦) treatment area, (■) control area .
3.7.3.4. DO and organic matter (COD and BOD5)
Dissolved oxygen in water plays an important role in the metabolism of aquatic plants and animals. The oxygen content affects the respiration and photosynthesis of aquatic organisms in ponds, lakes, rivers, etc. Especially in shallow lakes, where there is no movement of water flow, the dissolved oxygen content is small, affecting the aquatic organisms. The dissolved oxygen content in the treated area and the control area changes over the test period as shown in Figure 3.55, showing that the dissolved oxygen concentration gradually increases during the first 40 days, especially on the 40th day after treatment (DO concentration is 3.03 mg/l). When the lake water temperature begins to increase in the summer, the DO concentration gradually decreases, due to the respiration and photosynthesis of plants and animals in the lake. When the temperature started to decrease in winter, DO concentration increased again in the treatment area, while the control area showed little change and was in an anaerobic state (DO concentration < 1 mg/l).
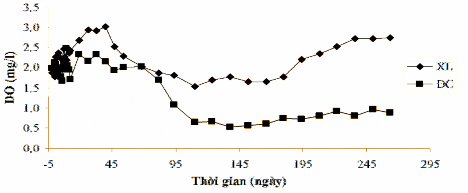
Figure 3.55. Dissolved oxygen (DO) concentration of the treatment area and the control area during the test period: (♦) treatment area, (■) control area .
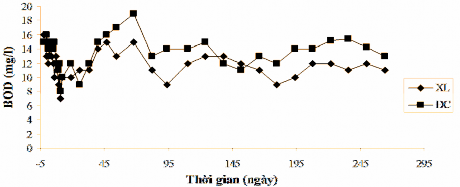
Figure 3.56. BOD fluctuation (mg/l) of the treatment area and the control area during the test period: (♦) treatment area, (■) control area .
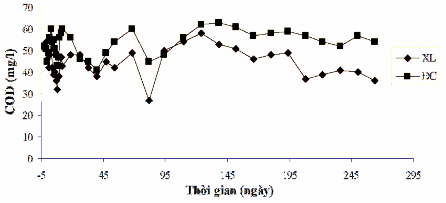
Figure 3.57. COD fluctuation (mg/l) of the treatment area and the control area during the test period: (♦) treatment area, (■) control area .
The variation of BOD5 and COD concentrations is shown in Figure 3.56 and Figure
3.57. According to Vietnam's water quality standards, only the BOD5 concentration of Hoa Muc lake meets good quality for domestic water use. In the treatment area, the BOD5 value remains at < 15 mg/l, however, in the control area, the BOD5 concentration exceeds this value. The COD value in the treatment area is usually < 50 mg/l, while the COD value is usually higher than 50 mg/l in the control area.
3.7.3.5. Metal concentrations in water and bottom mud of Hoa Muc lake after treatment
The results of metal content analysis in water samples and bottom mud samples of Hoa Muc after treatment with B90-La material are shown in Table 3.39.
Table 3.39. Metal concentration of Hoa Muc lake water after spraying B90-La
Target
Unit | Metal concentration | Target | Unit | Metal concentration | |
La | mg/l | 0.003 | As | mg/l | < 0.001 |
Na | mg/l | 26.72 | Cr | mg/l | < 0.001 |
K | mg/l | 13.45 | Cu | mg/l | < 0.001 |
Song | mg/l | 37.63 | Fe | mg/l | 0.052 |
Mg | mg/l | 7,840 | Pb | mg/l | < 0.001 |
Three | mg/l | 0.001 | Si | mg/l | < 0.01 |
Zn | mg/l | 0.046 | Al | mg/l | 0.04 |
Ni | mg/l | 0.023 | Mn | mg/l | < 0.001 |
CD | mg/l | 0.030 | ( December 13, 2011 ) | ||
Maybe you are interested!
-

 Research on treatment of rotator cuff tears using modified Mason-Allen tendon endoscopic suturing technique and creating micro-damage at the attachment area - 2
 -
 Standard Nitrogen Solution (1Ml Contains 0.05 Mg N; Prepared As In The External Nitrogen Determination Section)
 -
 Car body electrical practice - 8
zt2i3t4l5ee
zt2a3gs
zt2a3ge
zc2o3n4t5e6n7ts
If the voltage is out of specification, replace the wire or connector.
If the voltage is within specification, install the front fog light relay and follow step 5.
Step 5 Check the front fog light switch
- Remove the D4 connector of the fog light switch
- Use a multimeter to measure the resistance of the front fog light switch.
Measurement location
Condition
Standard
D4-3 (BFG) -D4-4 (LFG)
Light switchFront Fog OFF
>10kΩ
D4-3 (BFG) -D4-4 (LFG)
Front fog light switchON
<1 Ω
- Standard resistor
D4 connector is located on the combination switch assembly.
If the resistance is out of specification, replace the combination switch (the fog light switch is located in the combination switch).
If the resistance is within specification, follow step 6.
Step 6 Check wiring and connectors (front fog light relay-light selector switch)
- Disconnect connector D4 of the combination switch assembly
- Use a voltmeter to measure the voltage value of jack D4 on the wire side.
Measurement location
Control modecontrol
Standard
D4-3 (BFG) - (-) AQ
TAIL
11 to 14 V
D4 connector for the wiring of the combination switch assembly
If the voltage does not meet the standard, replace the wire or connector.
If the voltage is within standard, there may have been an error in the previous measurements.
Step 7 Check the front fog lights
- Remove the front fog light electrical connector.
- Supply battery voltage to the fog lamp terminals
Jack 8, B9 of front fog lamp on the electrical side
blind first.
Power supply location
Terms and Conditions
Battery positive terminal - Terminal 2Battery negative terminal - Terminal 1
Fog lightsbefore morning
- If the light does not come on, replace the bulb.
If the light is on, re-plug the jack and continue to step 8.
Step 8 Check wiring and connectors (relay and front fog lights)
- Disconnect the B8 and B9 connectors of the front fog lights.
- Use a voltmeter to measure voltage at the following locations:
Measurement location
Switch location
Terms and Conditions
B8-2 - (-) AQ
Electric lock ON TAIL size switchFog switch ON
11 to 14 V
B9-2 - (-) AQ
Electric lock ONTAIL size switch Fog switch ON
11 to 14 V
B8 and B9 connectors on the front fog lamp wiring side
Voltage is not up to standard, repair or replace the jack. If up to standard, there may have been an error in the measurement process.
2.2.4. Procedure for removing, installing and adjusting fog lights 1. Procedure for removing
- Remove the front inner ear pads
Use a screwdriver to remove the 3 screws and remove the front part of the front inner ear liner
-Remove the fog light assembly
+ Disconnect the connector.
+ Use a screwdriver to remove 3 screws to remove the fog light cover
2. Installation sequence
-Rotate the fog lamp bulb in the direction indicated by the arrow as shown in the figure and remove the fog lamp from the fog lamp assembly.
-Rotate the fog light bulb in the direction indicated by the arrow as shown in the figure and install the light into the fog light assembly.
- Use a screwdriver to install the fog light cover
-Install the electrical connector
Attention: Be careful not to damage the plastic thread on the lamp assembly.
- Install the front inner ear pads
Use a screwdriver to install the front inner bumper with 3 screws.
3. Prepare the vehicle to adjust the fog light convergence. Prepare the vehicle:
- Make sure there is no damage or deformation to the vehicle body around the fog lights.
- Add fuel to the fuel tank
- Add oil to standard level.
- Add engine coolant to standard level.
- Inflate the tire to standard pressure.
- Place spare tire, tools and jack in original design position
- Do not leave any load in the luggage compartment.
- Let a person weighing about 75 kg sit in the driver's seat.
4. Prepare to check the fog light convergence
a/ Prepare the vehicle status as follows:
- Place the car in a dark enough place to see the lines. The lines are the dividing line, below which the light from the fog lights can be seen but above which it cannot.
- Place the car perpendicular to the wall.
- Keep a distance of 7.62 m between the center of the fog lamp and the wall.
- Park the car on level ground.
- Press the car down a few times to stabilize the suspension.
Note: A distance of approximately 7.62 m is required between the vehicle (fog lamp center) and the wall to adjust the convergence correctly. If the distance of 7.62 m cannot be achieved, set the correct distance of 3 m to check and adjust the fog lamp convergence. (Since the target area varies with the distance, please follow the instructions as shown in the figure.)
b/ Prepare a piece of thick white paper about 2 m high and 4 m wide to use as a screen.
c/ Draw a vertical line through the center of the screen (line V).
d/ Set the screen as shown in the picture. Note:
- Keep the screen perpendicular to the ground.
- Align the V line on the screen with the center of the vehicle.
e/Draw the reference lines (H, V LH and V RH lines) on the screen as shown in the figure.HINT:
Mark the center of the fog lamp on the screen. If the center mark cannot be seen on the fog lamp, use the center of the fog lamp or the manufacturer's name mark on the fog lamp as the center mark.
H line (fog light height):
Draw a line across the screen so that it passes through the center mark. Line H should be at the same height as the center mark of the fog light bulb.
Line V LH, V RH (center mark position of left fog lamp LH and right fog lamp RH):
Draw two lines so that they intersect line H at the center marks.
5. Check the fog light convergence
a/ Cover the fog lamp or remove the connector of the other side fog lamp to prevent light from the unchecked fog lamp from affecting the fog lamp convergence test.
b/ Start the engine.
c/ Turn on the fog lights and make sure that the dividing line is outside the standard area as shown in the drawing.
6. Adjust the fog light convergence
Use a screwdriver to adjust the fog light to the standard area by turning the toe adjustment screw.
Note: If the screw is adjusted too far, loosen it and then tighten it again, so that the last rotation of the light adjustment screw is clockwise.
3. Self-study questions
1. Describe the operating principle of the lighting system with automatic headlight function
2. Describe the operating principle of the lighting system with the function of rotating headlights when turning
3. Draw diagram and connect lighting system on Hyundai Porter car
4. Draw diagram and connect lighting system on Honda Accord 1992
5. Draw the lighting circuit on a 1993 Toyota Lexus
LESSON 3 MAINTENANCE AND REPAIR OF SIGNAL SYSTEM
I. IMPLEMENTATION GOAL
After completing this lesson, students will be able to:
- Distinguish between types of signals on cars
- Correctly describe common symptoms and suspected areas causing damage.
- Connecting signal circuits ensures technical requirements
- Disassemble, install, check, maintain and repair the signal system to ensure technical requirements.
- Ensure safety in work and industrial hygiene
II. LESSON CONTENT
1. General description
The signal system equipped on cars aims to create signals to notify other vehicles participating in traffic about the vehicle's operating status such as: stopping, parking, braking, reversing, turning...
Signals are used either by light such as headlamps, brake lights, turn signals….. or by sound such as horns, reverse music….
Just like the lighting system. A signal system circuit usually consists of: battery, fuse, wire, relay, electrical load and control switch. Only some switches of the signal system are on the combination switch. The switches of other signals are usually located in different locations such as in the gearbox or brake pedal……
2. Maintenance and repair
2.1. Turn signals and hazard lights
The installation location of the turn signal is shown in Figure 3.1. The turn signal control switch is located in the combination switch under the steering wheel. Turning this switch to the right or left will make the turn signal turn right or left.
The hazard light switch is used when the vehicle has a problem while participating in traffic. When the hazard light switch is turned on, all the turn signals on the vehicle will light up at a certain frequency. The hazard light switch is usually placed separately from the turn signal switch (some old cars integrate the hazard and turn signal switches on the same combination switch cluster).
Figure 3.1 Turn signal switch Figure 3.2 Hazard switch
The part that generates the flashing frequency for the lights is called a turn signal relay. The turn signal relay usually has 3 terminals: B (positive power supply); E (negative power supply); L (providing the turn signal switch to distribute to the
lamp)
2.1.1. Circuit diagram
To generate the frequency for the turn signal, a turn signal relay is used in the turn signal circuit. The current from the turn signal relay will be sent to the turn signal switch assembly to distribute the current to the turn signal lights for the driver's purpose.
Figure 3.3. Schematic diagram of a turn signal circuit without a hazard switch
1. Battery; 2. Electric lock; 3. Turn signal relay; 4. Turn signal switch; 5. Turn signal lamp; 6. Turn signal lamp; 7. Hazard switch
Figure 3.4 Schematic diagram of turn signal circuit with hazard switch
1. Battery; 2. Combination switch cluster; 3. Turn signal;
4. Turn signal light; 5. Turn signal relay
Today's cars no longer use three-pin turn signal relays (B, L, E) but use eight-pin turn signal relays (figure 3.5) (pin number 8 is used for hazard lights).
For this type, the current supplying the turn signal lights is supplied directly from the turn signal relay to the lights.
div.maincontent .p { color: black; font-family:"Times New Roman", serif; font-style: normal; font-weight: normal; text-decoration: none; font-size: 14pt; margin:0pt; } div.maincontent p { color: black; font-family:"Times New Roman", serif; font-style: normal; font-weight: normal; text-decoration: none; font-size: 14pt; margin:0pt; } div.maincontent .s1 { color: black; font-family:"Times New Roman", serif; font-style: normal; font-weight: normal; text-decoration: none; font-size: 13pt; } div.maincontent .s2 { color: black; font-family:"Times New Roman", serif; font-style: italic; font-weight: normal; text-decoration: none; font-size: 14pt; } div.maincontent .s3 { color: black; font-family:"Times New Roman", serif; font-style: normal; font-weight: normal; text-decoration: none; font-size: 14pt; } div.maincontent .s4 { color: black; font-family:"Times New Roman", serif; font-style: normal; font-weight: normal; text-decoration: none; font-size: 13pt; } div.maincontent .s5 { color: black; font-family:"Times New Roman", serif; font-style: normal; font-weight: normal; text-decoration: none; font-size: 13pt; vertical-align: 1pt; } div.maincontent .s6 { color: black; font-family:"Times New Roman", serif; font-style: normal; font-weight: normal; text-decoration: none; font-size: 11pt; } div.maincontent .s7 { color: black; font-family:"Times New Roman", serif; font-style: normal; font-weight: normal; text-decoration: none; font-size: 14pt; vertical-align: -9pt; } div.maincontent .s8 { color: black; font-family:"Times New Roman", serif; font-style: normal; font-weight: normal; text-decoration: none; font-size: 11pt; } div.maincontent .s9 { color: #008000; font-family:"Times New Roman", serif; font-style: normal; font-weight: normal; text-decoration: none; font-size: 14pt; } div.maincontent .s10 { color: black; font-family:"Times New Roman", serif; font-style: italic; font-weight: normal; te
Car body electrical practice - 8
zt2i3t4l5ee
zt2a3gs
zt2a3ge
zc2o3n4t5e6n7ts
If the voltage is out of specification, replace the wire or connector.
If the voltage is within specification, install the front fog light relay and follow step 5.
Step 5 Check the front fog light switch
- Remove the D4 connector of the fog light switch
- Use a multimeter to measure the resistance of the front fog light switch.
Measurement location
Condition
Standard
D4-3 (BFG) -D4-4 (LFG)
Light switchFront Fog OFF
>10kΩ
D4-3 (BFG) -D4-4 (LFG)
Front fog light switchON
<1 Ω
- Standard resistor
D4 connector is located on the combination switch assembly.
If the resistance is out of specification, replace the combination switch (the fog light switch is located in the combination switch).
If the resistance is within specification, follow step 6.
Step 6 Check wiring and connectors (front fog light relay-light selector switch)
- Disconnect connector D4 of the combination switch assembly
- Use a voltmeter to measure the voltage value of jack D4 on the wire side.
Measurement location
Control modecontrol
Standard
D4-3 (BFG) - (-) AQ
TAIL
11 to 14 V
D4 connector for the wiring of the combination switch assembly
If the voltage does not meet the standard, replace the wire or connector.
If the voltage is within standard, there may have been an error in the previous measurements.
Step 7 Check the front fog lights
- Remove the front fog light electrical connector.
- Supply battery voltage to the fog lamp terminals
Jack 8, B9 of front fog lamp on the electrical side
blind first.
Power supply location
Terms and Conditions
Battery positive terminal - Terminal 2Battery negative terminal - Terminal 1
Fog lightsbefore morning
- If the light does not come on, replace the bulb.
If the light is on, re-plug the jack and continue to step 8.
Step 8 Check wiring and connectors (relay and front fog lights)
- Disconnect the B8 and B9 connectors of the front fog lights.
- Use a voltmeter to measure voltage at the following locations:
Measurement location
Switch location
Terms and Conditions
B8-2 - (-) AQ
Electric lock ON TAIL size switchFog switch ON
11 to 14 V
B9-2 - (-) AQ
Electric lock ONTAIL size switch Fog switch ON
11 to 14 V
B8 and B9 connectors on the front fog lamp wiring side
Voltage is not up to standard, repair or replace the jack. If up to standard, there may have been an error in the measurement process.
2.2.4. Procedure for removing, installing and adjusting fog lights 1. Procedure for removing
- Remove the front inner ear pads
Use a screwdriver to remove the 3 screws and remove the front part of the front inner ear liner
-Remove the fog light assembly
+ Disconnect the connector.
+ Use a screwdriver to remove 3 screws to remove the fog light cover
2. Installation sequence
-Rotate the fog lamp bulb in the direction indicated by the arrow as shown in the figure and remove the fog lamp from the fog lamp assembly.
-Rotate the fog light bulb in the direction indicated by the arrow as shown in the figure and install the light into the fog light assembly.
- Use a screwdriver to install the fog light cover
-Install the electrical connector
Attention: Be careful not to damage the plastic thread on the lamp assembly.
- Install the front inner ear pads
Use a screwdriver to install the front inner bumper with 3 screws.
3. Prepare the vehicle to adjust the fog light convergence. Prepare the vehicle:
- Make sure there is no damage or deformation to the vehicle body around the fog lights.
- Add fuel to the fuel tank
- Add oil to standard level.
- Add engine coolant to standard level.
- Inflate the tire to standard pressure.
- Place spare tire, tools and jack in original design position
- Do not leave any load in the luggage compartment.
- Let a person weighing about 75 kg sit in the driver's seat.
4. Prepare to check the fog light convergence
a/ Prepare the vehicle status as follows:
- Place the car in a dark enough place to see the lines. The lines are the dividing line, below which the light from the fog lights can be seen but above which it cannot.
- Place the car perpendicular to the wall.
- Keep a distance of 7.62 m between the center of the fog lamp and the wall.
- Park the car on level ground.
- Press the car down a few times to stabilize the suspension.
Note: A distance of approximately 7.62 m is required between the vehicle (fog lamp center) and the wall to adjust the convergence correctly. If the distance of 7.62 m cannot be achieved, set the correct distance of 3 m to check and adjust the fog lamp convergence. (Since the target area varies with the distance, please follow the instructions as shown in the figure.)
b/ Prepare a piece of thick white paper about 2 m high and 4 m wide to use as a screen.
c/ Draw a vertical line through the center of the screen (line V).
d/ Set the screen as shown in the picture. Note:
- Keep the screen perpendicular to the ground.
- Align the V line on the screen with the center of the vehicle.
e/Draw the reference lines (H, V LH and V RH lines) on the screen as shown in the figure.HINT:
Mark the center of the fog lamp on the screen. If the center mark cannot be seen on the fog lamp, use the center of the fog lamp or the manufacturer's name mark on the fog lamp as the center mark.
H line (fog light height):
Draw a line across the screen so that it passes through the center mark. Line H should be at the same height as the center mark of the fog light bulb.
Line V LH, V RH (center mark position of left fog lamp LH and right fog lamp RH):
Draw two lines so that they intersect line H at the center marks.
5. Check the fog light convergence
a/ Cover the fog lamp or remove the connector of the other side fog lamp to prevent light from the unchecked fog lamp from affecting the fog lamp convergence test.
b/ Start the engine.
c/ Turn on the fog lights and make sure that the dividing line is outside the standard area as shown in the drawing.
6. Adjust the fog light convergence
Use a screwdriver to adjust the fog light to the standard area by turning the toe adjustment screw.
Note: If the screw is adjusted too far, loosen it and then tighten it again, so that the last rotation of the light adjustment screw is clockwise.
3. Self-study questions
1. Describe the operating principle of the lighting system with automatic headlight function
2. Describe the operating principle of the lighting system with the function of rotating headlights when turning
3. Draw diagram and connect lighting system on Hyundai Porter car
4. Draw diagram and connect lighting system on Honda Accord 1992
5. Draw the lighting circuit on a 1993 Toyota Lexus
LESSON 3 MAINTENANCE AND REPAIR OF SIGNAL SYSTEM
I. IMPLEMENTATION GOAL
After completing this lesson, students will be able to:
- Distinguish between types of signals on cars
- Correctly describe common symptoms and suspected areas causing damage.
- Connecting signal circuits ensures technical requirements
- Disassemble, install, check, maintain and repair the signal system to ensure technical requirements.
- Ensure safety in work and industrial hygiene
II. LESSON CONTENT
1. General description
The signal system equipped on cars aims to create signals to notify other vehicles participating in traffic about the vehicle's operating status such as: stopping, parking, braking, reversing, turning...
Signals are used either by light such as headlamps, brake lights, turn signals….. or by sound such as horns, reverse music….
Just like the lighting system. A signal system circuit usually consists of: battery, fuse, wire, relay, electrical load and control switch. Only some switches of the signal system are on the combination switch. The switches of other signals are usually located in different locations such as in the gearbox or brake pedal……
2. Maintenance and repair
2.1. Turn signals and hazard lights
The installation location of the turn signal is shown in Figure 3.1. The turn signal control switch is located in the combination switch under the steering wheel. Turning this switch to the right or left will make the turn signal turn right or left.
The hazard light switch is used when the vehicle has a problem while participating in traffic. When the hazard light switch is turned on, all the turn signals on the vehicle will light up at a certain frequency. The hazard light switch is usually placed separately from the turn signal switch (some old cars integrate the hazard and turn signal switches on the same combination switch cluster).
Figure 3.1 Turn signal switch Figure 3.2 Hazard switch
The part that generates the flashing frequency for the lights is called a turn signal relay. The turn signal relay usually has 3 terminals: B (positive power supply); E (negative power supply); L (providing the turn signal switch to distribute to the
lamp)
2.1.1. Circuit diagram
To generate the frequency for the turn signal, a turn signal relay is used in the turn signal circuit. The current from the turn signal relay will be sent to the turn signal switch assembly to distribute the current to the turn signal lights for the driver's purpose.
Figure 3.3. Schematic diagram of a turn signal circuit without a hazard switch
1. Battery; 2. Electric lock; 3. Turn signal relay; 4. Turn signal switch; 5. Turn signal lamp; 6. Turn signal lamp; 7. Hazard switch
Figure 3.4 Schematic diagram of turn signal circuit with hazard switch
1. Battery; 2. Combination switch cluster; 3. Turn signal;
4. Turn signal light; 5. Turn signal relay
Today's cars no longer use three-pin turn signal relays (B, L, E) but use eight-pin turn signal relays (figure 3.5) (pin number 8 is used for hazard lights).
For this type, the current supplying the turn signal lights is supplied directly from the turn signal relay to the lights.
div.maincontent .p { color: black; font-family:"Times New Roman", serif; font-style: normal; font-weight: normal; text-decoration: none; font-size: 14pt; margin:0pt; } div.maincontent p { color: black; font-family:"Times New Roman", serif; font-style: normal; font-weight: normal; text-decoration: none; font-size: 14pt; margin:0pt; } div.maincontent .s1 { color: black; font-family:"Times New Roman", serif; font-style: normal; font-weight: normal; text-decoration: none; font-size: 13pt; } div.maincontent .s2 { color: black; font-family:"Times New Roman", serif; font-style: italic; font-weight: normal; text-decoration: none; font-size: 14pt; } div.maincontent .s3 { color: black; font-family:"Times New Roman", serif; font-style: normal; font-weight: normal; text-decoration: none; font-size: 14pt; } div.maincontent .s4 { color: black; font-family:"Times New Roman", serif; font-style: normal; font-weight: normal; text-decoration: none; font-size: 13pt; } div.maincontent .s5 { color: black; font-family:"Times New Roman", serif; font-style: normal; font-weight: normal; text-decoration: none; font-size: 13pt; vertical-align: 1pt; } div.maincontent .s6 { color: black; font-family:"Times New Roman", serif; font-style: normal; font-weight: normal; text-decoration: none; font-size: 11pt; } div.maincontent .s7 { color: black; font-family:"Times New Roman", serif; font-style: normal; font-weight: normal; text-decoration: none; font-size: 14pt; vertical-align: -9pt; } div.maincontent .s8 { color: black; font-family:"Times New Roman", serif; font-style: normal; font-weight: normal; text-decoration: none; font-size: 11pt; } div.maincontent .s9 { color: #008000; font-family:"Times New Roman", serif; font-style: normal; font-weight: normal; text-decoration: none; font-size: 14pt; } div.maincontent .s10 { color: black; font-family:"Times New Roman", serif; font-style: italic; font-weight: normal; te -
![Pre-tax Profit of Bidv Tien Giang in the Period 2011-2015
zt2i3t4l5ee
zt2a3gsnon-credit services, joint stock commercial bank
zt2a3ge
zc2o3n4t5e6n7ts
At that time, the Branch had to set aside a provision for credit risks, which reduced the Branchs income.
Chart 2.2. Pre-tax profit of BIDV Tien Giang in the period 2011-2015
Unit: Billion VND
140
120
100
80
60
40
20
0
63.3
80.34
89.29
110.08
131.99
2011 2012 2013 2014 2015
Profit before tax
(Source: Report on the implementation of the annual business plan of the General Planning Department of BIDV Tien Giang [24])
However, through chart 2.2, it can be seen that BIDV Tien Giangs profit is still increasing continuously, and its operating efficiency is currently leaking. This is a contribution of non-credit services, and this service segment will be increasingly focused on growth by BIDV Tien Giang to ensure the highest profit safety because credit activities have many potential risks. At the same time, focusing on developing non-credit services is consistent with one of the contents of restructuring the financial activities of credit institutions in the project Restructuring the system of credit institutions in the period 2011-2015 approved by the Prime Minister in Decision No. 254/QD-TTg dated March 1, 2012 [14]: Gradually shifting the business model of commercial banks towards reducing dependence on credit activities and increasing income from non-credit services.
2.2. Current status of non-credit service development at BIDV Tien Giang.
2.2.1. BIDV Tien Giang has deployed the development of non-credit services in recent times.
Along with the development of the Head Office, BIDV Tien Giangs products and services are constantly improved and deployed in a diverse manner to ensure provision for many different customer groups in the area: individual customers, corporate customers, and financial institutions. Typical services are as follows: Payment services, treasury services, guarantee services, card services, trade finance, other services: Western Union, insurance commissions, consulting services, foreign exchange derivatives trading, e-banking services,...
2.2.1.1. Payment services:
In accordance with the Prime Ministers Project to promote non-cash payments in Vietnam [15], banks in Tien Giang province have continuously developed payment services to reduce customers cash usage habits through card services and electronic banking services such as: salary payment through accounts, focusing on developing card acceptance points, developing multi-purpose cards, paying social insurance by transfer, paying bills through banks, etc.
Chart 2.3. Net income from payment services in the period 2011-2015
Unit: Million VND
6000
5000
4000
3000
2000
1000
0
3922 4065
4720 5084 5324
2011 2012 2013 2014 2015
Net income from payment services
(Source: Report on the implementation of the annual business plan of the General Planning Department of BIDV Tien Giang [24])
Along with the technological development of the entire system, BIDV Tien Giang has a payment system with a fairly stable transaction processing speed, bringing many conveniences to customers. The results of observing chart 2.3 show that the income from payment services that the Branch has achieved has grown over the years but the speed is not high and the products are not outstanding compared to other banks. Domestic payment products such as: Online bill payment, electricity bills, water bills, insurance premiums, cable TV bills, telecommunications fees, airline tickets, etc. bring many conveniences to customers. Regarding international payment, this is an indispensable activity for foreign economic activities, BIDV Tien Giang is providing international payment methods for small enterprises producing agriculture, aquatic food and seafood that have credit relationships with banks in industrial parks in Tien Giang province such as: money transfer, collection, L/C payment.
2.2.1.2. Treasury services:
BIDV Tien Giang always focuses on ensuring treasury safety and currency security, always complies with legal regulations, and minimizes risks in operations such as: counting and collecting money from customers, receiving and delivering internal transactions, collecting from the State Bank (SBV) or other credit institutions, receiving ATM funds, bundling money, etc. BIDV Tien Giangs treasury service management department is always fully equipped with modern machinery and equipment such as: money transport vehicles, fire prevention tools, money counters, money detectors, magnifying glasses, etc. to ensure absolute safety in treasury operations, immediately identifying real and fake money and other risks that may affect people and assets of the bank and customers. In addition, implementing regulation 2480/QC dated October 28, 2008 between the State Bank of Tien Giang province and the Provincial Police on coordination in the fight against counterfeit money, in the 3-year review of implementation, BIDV Tien Giang discovered, seized and submitted to the State Bank of Tien Giang province 475 banknotes of various denominations and was commended by the Provincial Police and the State Bank of Tien Giang province [17].
Chart 2.4. Net income from treasury services in the period 2011-2015
Unit: Million VND
350
300
250
200
150
100
50
0
105 122
309 289 279
2011 2012 2013 2014 2015
Net income from treasury services
(Source: Report on the implementation of the annual business plan of the General Planning Department of BIDV Tien Giang [24])
However, as shown in Figure 2.4, income from treasury operations is not high and fluctuates. Specifically, in the period 2011-2013, net income increased and increased most sharply in 2013, then in the period 2013-2015, there was a downward trend. This fluctuation is due to the fact that fees collected from treasury services are often very low and can even be waived to attract customers to use other services.
2.2.1.3. Guarantee and trade finance services:
BIDV Tien Giang, thanks to the advantages of the province and the favorable location of the Branch, has continuously focused on developing income from guarantee services and trade finance.
Chart 2.5. Net income from guarantee and trade finance services in the period 2011-2015
Unit: Million VND
14000
12000
10000
8000
6000
4000
2000
0
5193 5695
2742 3420
8889
3992
11604 12206
5143 5312
2011 2012 2013 2014 2015
Net income from guarantee services Net income from Trade Finance
(Source: Report on the implementation of the annual business plan of the General Planning Department of BIDV Tien Giang [24])
Through chart 2.5, we can see that BIDV Tien Giangs income from guarantee services and trade finance has grown over the years. The reason is: Among BIDV Tien Giangs corporate customers, the construction industry is the industry with the highest proportion of customers after the trading industry, this is a group of customers with potential to develop guarantee services. The second group of customers is corporate customers in the fields of agricultural production, livestock and seafood processing with high import and export turnover in the area.
are the target of trade finance development. In addition, BIDV Tien Giang also focuses on continuously developing these customer groups to increase revenue for many other products and services in the future.
2.2.1.4. Card and POS services:
As a service that BIDV Tien Giang has recently developed strongly, it can be said that this is a very potential market and has the ability to develop even more strongly in the future. Card services with outstanding advantages such as fast payment time, wide payment range, quite safe, effective and suitable for the integration trend and the Project to promote non-cash payments in Vietnam. Cards have become a modern and popular payment tool. BIDV Tien Giang early identified that developing card services is to expand the market to people in society, create capital mobilized from card-opened accounts, contribute to diversifying banking activities, enhance the image of the bank, bring the BIDV Tien Giang brand to people as quickly and easily as possible. BIDV Tien Giang is currently providing card types such as: credit cards (BIDV MasterCard Platinum, BIDV Visa Gold Precious, BIDV Visa Manchester United, BIDV Visa Classic), international debit cards (BIDV Ready Card, BIDV Manu Debit Card), domestic debit cards (BIDV Harmony Card, BIDV eTrans Card, BIDV Moving Card, BIDV-Lingo Co-branded Card, BIDV-Co.opmart Co-branded Card). These cards can be paid via POS/EDC or on the ATM system. In addition, with debit cards, customers can not only withdraw money via ATMs but also perform utilities such as mobile top-up, online payment, money transfer,... through electronic banking services.
In order to attract customers with card services, BIDV Tien Giang has continuously increased the installation of ATMs. As of December 31, 2015, BIDV Tien Giang has 23 ATMs combined with 7 ATMs in the same system of BIDV My Tho, so the number of ATMs is quite large, especially in the center of My Tho City, but is not yet fully present in the districts. Basic services on ATMs such as withdrawing money, checking balances, printing short statements,... BIDV ATMs accept cards from banks in the system.
Banknetvn and Smartlink, cards branded by international card organizations Union Pay (CUP), VISA, MasterCard and cards of banks in the Asian Payment Network. From here, cardholders can make bill payments for themselves or others at ATMs, by simply entering the subscriber number or customer code, booking code that service providers notify and make bill payments.
Chart 2.6. Net income from card services in the period 2011-2015
Unit: Million VND
3500
3000
2500
2000
1500
1000
500
0
687
1023
1547
2267
3104
2011 2012 2013 2014 2015
Net income from card services
(Source: Report on the implementation of the annual business plan of the General Planning Department of BIDV Tien Giang [24])
Through chart 2.6, it can be seen that BIDV Tien Giangs card service income is constantly growing because the Branch focuses on developing businesses operating in industrial parks, which are the source of customers for salary payment products, ATMs, BSMS. Specifically, there are companies such as Freeview, Quang Viet, Dai Thanh, which are businesses with a large number of card openings at the Branch, contributing to the increase in card service fees [25].
Table 2.6. Number of ATMs and POS machines in 2015 of some banks in Tien Giang area.
Unit: Machine
STT
Bank name
Number of ATMs
Cumulative number of ATM cards
POS machine
1
BIDV Tien Giang
23
97,095
22
2
BIDV My Tho
7
21,325
0
3
Agribank Tien Giang
29
115,743
77
4
Vietinbank Tien Giang
16
100,052
54
5
Dong A Tien Giang
26
97,536
11
6
Sacombank Tien Giang
24
88,513
27
7
Vietcombank Tien Giang
15
61,607
96
8
Vietinbank - Tay Tien Giang Branch
6
46,042
38
(Source: 2015 Banking Activity Data Report of the General and Internal Control Department of the Provincial State Bank [21])
Through table 2.6, the author finds that the number of ATMs of BIDV Tien Giang is not much, ranking fourth after Agribank Tien Giang, Dong A Tien Giang, Sacombank Tien Giang. The number of POS machines of BIDV Tien Giang is very small, only higher than Dong A Tien Giang and BIDV My Tho in the initial stages of merging the BIDV system. Besides, BIDV Tien Giang has a high number of cards increasing over the years (table 2.7) but the cumulative number of cards issued up to December 31, 2015 is still relatively low compared to Agribank, Vietcombank, Dong A (table 2.6).
div.maincontent .content_head3 { color: black; font-family:Times New Roman, serif; font-style: normal; font-weight: bold; text-decoration: none; font-size: 14pt; }
div.maincontent .p { color: black; font-family:Times New Roman, serif; font-style: normal; font-weight: normal; text-decoration: none; font-size: 14pt; margin:0pt; }
div.maincontent p { color: black; font-family:Times New Roman, serif; font-style: normal; font-weight: normal; text-decoration: none; font-size: 14pt; margin:0pt; }
div.maincontent .s1 { color: black; font-family:Courier New, monospace; font-style: normal; font-weight: normal; text-decoration: none; font-size: 14pt; }
div.maincontent .s2 { color: black; font-family:Times New Roman, serif; font-style: italic; font-weight: normal; text-decoration: none; font-size: 13pt; }
div.maincontent .s3 { color: black; font-family:Times New Roman, serif; font-style: italic; font-weight: bold; text-decoration: none; font-size: 14pt; }
div.maincontent .s4 { color: black; font-family:Times New Roman, serif; font-style: italic; font-weight: normal; text-decoration: none; font-size: 14pt; }
div.maincontent .s5 { color: black; font-family:Times New Roman, serif; font-style: normal; font-weight: normal; text-decoration: none; font-size: 14pt; }
div.maincontent .s6 { color: black; font-family:Times New Roman, serif; font-style: normal; font-weight: bold; text-decoration: none; font-size: 14pt; }
div.maincontent .s7 { color: black; font-family:Times New Roman, serif; font-style: normal; font-weight: normal; text-decoration: none; font-size: 13.5pt; }
div.maincontent .s8 { color: black; font-family:Arial, sans-serif; font-style: normal; font-weight: normal; text-decoration: none; font-size: 9pt; }
div.maincontent .s9 { color: black; font-family:Arial, sans-serif; font-style: normal; font-weight: normal; text-decoration: none; font-size: 9pt; vertical-align: -2pt; }
div.maincontent .s10 { color: black; font-family:Arial, sans-serif; font-style: normal; font-weight: normal; text-decoration: none; font-size: 9pt; vertical-align: 5pt; }
div.maincontent .s11 { color: black; font-family:Arial, sans-serif; font-style: normal; font-weight: normal; text-decoration: none; font-size: 9pt; vertical-align: -5pt; }
div.maincontent .s12 { color: black; font-family:Arial, sans-serif; font-style: normal; font-weight: normal; text-decoration: none; font-size: 9pt; vertical-align: -3pt; }
div.maincontent .s13 { color: black; font-family:Arial, sans-serif; font-style: normal; font-weight: normal; text-decoration: none; font-size: 9pt; vertical-align: -4pt; }
div.maincontent .s14 { color: black; font-family:Arial, sans-serif; font-style: normal; font-weight: normal; text-decoration: none; font-size: 7.5pt; }
div.maincontent .s15 { color: black; font-family:Times New Roman, serif; font-style: italic; font-weight: normal; text-decoration: none; font-size: 14pt; }
div.maincontent .s16 { color: black; font-family:Arial, sans-serif; font-style: normal; font-weight: normal; text-decoration: none; font-size: 10.5pt; }
div.maincontent .s17 { color: black; font-family:Arial, sans-serif; font-style: normal; font-weight: normal; text-decoration: none; font-size: 9.5pt; }
div.maincontent .s18 { color: black; font-family:Arial, sans-serif; font-style: normal; font-weight: normal; text-decoration: none; font-size: 10.5pt; vertical-align: -1pt; }
div.maincontent .s19 { color: black; font-family:Arial, sans-serif; font-style: normal; font-weight: normal; text-decoration: none; font-size: 10.5pt; vertical-align: -5pt; }
div.maincontent .s20 { color: black; font-family:Arial, sans-serif; font-style: normal; font-weight: normal; text-decoration: none; font-size: 10.5pt; vertical-align: -2pt; }
div.maincontent .s21 { color: black; font-family:Arial, sans-serif; font-style: normal; font-weight: normal; text-decoration: none; font-size: 10pt; }
div.maincontent .s22 { color: black; font-family:Calibri, sans-serif; font-style: normal; font-weight: normal; text-decoration: none; font-size: 10.5pt; }
div.maincontent .s23 { color: black; font-family:Calibri, sans-serif; font-style: normal; font-weight: normal; text-decoration: none; font-size: 10.5pt; vertical-align: -3pt; }
div.maincontent .s24 { color: black; font-family:Calibri, sans-serif; font-style: normal; font-weight: normal; text-decoration: none; font-size: 10.5pt; vertical-align: -5pt; }
div.maincontent .s25 { color: black; font-family:Times New Roman, serif; font-style: normal; font-weight: normal; text-decoration: none; font-size: 10.5pt; }
div.maincontent .s26 { color: black; font-family:Calibri, sans-serif; font-style: normal; font-weight: normal; text-decoration: none; font-size: 10.5pt; vertical-align: -4pt; }
div.maincontent .s27 { color: black; font-family:Calibri, sans-serif; font-style: normal; font-weight: normal; text-decoration: none; font-size: 10.5pt; vertical-align: -6pt; }
div.maincontent .s28 { color: black; font-family:Calibri, sans-serif; font-style: normal; font-weight: normal; text-decoration: none; font-size: 10.5pt; vertical-align: -1pt; }
div.maincontent .s29 { color: black; font-family:Calibri, sans-serif; font-style: normal; font-weight: normal; text-decoration: none; font-size: 11.5pt; }
div.maincontent .s30 { color: black; font-family:Calibri, sans-serif; font-style: normal; font-weight: normal; text-decoration: none; font-size: 11pt; }
div.maincontent .s31 { color: black; font-family:Times New Roman, serif; font-style: normal; font-weight: normal; text-decoration: none; font-size: 11pt; }
div.maincontent .s32 { color: black; font-family:.VnTime, sans-serif; font-style: normal; font-weight: normal; text-decoration: none; font-size: 14pt; }
div.maincontent .s33 { color: black; font-family:Cambria, serif; font-style: normal; font-weight: normal; text-decoration: none; font-size: 10.5pt; }
div.maincontent .s34 { color: black; font-family:Cambria, serif; font-style: normal; font-weight: normal; text-decoration: none; font-size: 10.5pt; vertical-align: -4pt; }
div.maincontent .s35 { color: black; font-family:Arial, sans-serif; font-style: normal; font-weight: normal; text-decoration: none; font-size: 11.5pt; }
div.maincontent .s36 { color: black; font-family:Arial, sans-serif; font-style: normal; font-weight: bold; text-decoration: none; font-size: 14pt; }
div.maincontent .s37 { color: black; font-family:Times New Roman, serif; font-style: normal; font-weight: bold; text-decoration: none; font-size: 13pt; }
div.maincontent .s38 { color: black; font-family:Times New Roman, serif; font-style: normal; font-weight: normal; text-decoration: none; font-size: 13pt; }
div.maincontent .s39 { color: black; font-family:Times New Roman, serif; font-style: normal; font-weight: normal; text-decoration: none; font-size: 15pt; }
div.maincontent .s40 { color: black; font-family:Times New Roman, serif; font-style: normal; fo](https://tailieuthamkhao.com/uploads/2022/06/06/dich-vu-phi-tin-dung-tai-ngan-hang-thuong-mai-co-phan-dau-tu-va-phat-8-1-120x90.png) Pre-tax Profit of Bidv Tien Giang in the Period 2011-2015
zt2i3t4l5ee
zt2a3gsnon-credit services, joint stock commercial bank
zt2a3ge
zc2o3n4t5e6n7ts
At that time, the Branch had to set aside a provision for credit risks, which reduced the Branch's income.
Chart 2.2. Pre-tax profit of BIDV Tien Giang in the period 2011-2015
Unit: Billion VND
140
120
100
80
60
40
20
0
63.3
80.34
89.29
110.08
131.99
2011 2012 2013 2014 2015
Profit before tax
(Source: Report on the implementation of the annual business plan of the General Planning Department of BIDV Tien Giang [24])
However, through chart 2.2, it can be seen that BIDV Tien Giang's profit is still increasing continuously, and its operating efficiency is currently leaking. This is a contribution of non-credit services, and this service segment will be increasingly focused on growth by BIDV Tien Giang to ensure the highest profit safety because credit activities have many potential risks. At the same time, focusing on developing non-credit services is consistent with one of the contents of restructuring the financial activities of credit institutions in the project "Restructuring the system of credit institutions in the period 2011-2015" approved by the Prime Minister in Decision No. 254/QD-TTg dated March 1, 2012 [14]: "Gradually shifting the business model of commercial banks towards reducing dependence on credit activities and increasing income from non-credit services".
2.2. Current status of non-credit service development at BIDV Tien Giang.
2.2.1. BIDV Tien Giang has deployed the development of non-credit services in recent times.
Along with the development of the Head Office, BIDV Tien Giang's products and services are constantly improved and deployed in a diverse manner to ensure provision for many different customer groups in the area: individual customers, corporate customers, and financial institutions. Typical services are as follows: Payment services, treasury services, guarantee services, card services, trade finance, other services: Western Union, insurance commissions, consulting services, foreign exchange derivatives trading, e-banking services,...
2.2.1.1. Payment services:
In accordance with the Prime Minister's Project to promote non-cash payments in Vietnam [15], banks in Tien Giang province have continuously developed payment services to reduce customers' cash usage habits through card services and electronic banking services such as: salary payment through accounts, focusing on developing card acceptance points, developing multi-purpose cards, paying social insurance by transfer, paying bills through banks, etc.
Chart 2.3. Net income from payment services in the period 2011-2015
Unit: Million VND
6000
5000
4000
3000
2000
1000
0
3922 4065
4720 5084 5324
2011 2012 2013 2014 2015
Net income from payment services
(Source: Report on the implementation of the annual business plan of the General Planning Department of BIDV Tien Giang [24])
Along with the technological development of the entire system, BIDV Tien Giang has a payment system with a fairly stable transaction processing speed, bringing many conveniences to customers. The results of observing chart 2.3 show that the income from payment services that the Branch has achieved has grown over the years but the speed is not high and the products are not outstanding compared to other banks. Domestic payment products such as: Online bill payment, electricity bills, water bills, insurance premiums, cable TV bills, telecommunications fees, airline tickets, etc. bring many conveniences to customers. Regarding international payment, this is an indispensable activity for foreign economic activities, BIDV Tien Giang is providing international payment methods for small enterprises producing agriculture, aquatic food and seafood that have credit relationships with banks in industrial parks in Tien Giang province such as: money transfer, collection, L/C payment.
2.2.1.2. Treasury services:
BIDV Tien Giang always focuses on ensuring treasury safety and currency security, always complies with legal regulations, and minimizes risks in operations such as: counting and collecting money from customers, receiving and delivering internal transactions, collecting from the State Bank (SBV) or other credit institutions, receiving ATM funds, bundling money, etc. BIDV Tien Giang's treasury service management department is always fully equipped with modern machinery and equipment such as: money transport vehicles, fire prevention tools, money counters, money detectors, magnifying glasses, etc. to ensure absolute safety in treasury operations, immediately identifying real and fake money and other risks that may affect people and assets of the bank and customers. In addition, implementing regulation 2480/QC dated October 28, 2008 between the State Bank of Tien Giang province and the Provincial Police on coordination in the fight against counterfeit money, in the 3-year review of implementation, BIDV Tien Giang discovered, seized and submitted to the State Bank of Tien Giang province 475 banknotes of various denominations and was commended by the Provincial Police and the State Bank of Tien Giang province [17].
Chart 2.4. Net income from treasury services in the period 2011-2015
Unit: Million VND
350
300
250
200
150
100
50
0
105 122
309 289 279
2011 2012 2013 2014 2015
Net income from treasury services
(Source: Report on the implementation of the annual business plan of the General Planning Department of BIDV Tien Giang [24])
However, as shown in Figure 2.4, income from treasury operations is not high and fluctuates. Specifically, in the period 2011-2013, net income increased and increased most sharply in 2013, then in the period 2013-2015, there was a downward trend. This fluctuation is due to the fact that fees collected from treasury services are often very low and can even be waived to attract customers to use other services.
2.2.1.3. Guarantee and trade finance services:
BIDV Tien Giang, thanks to the advantages of the province and the favorable location of the Branch, has continuously focused on developing income from guarantee services and trade finance.
Chart 2.5. Net income from guarantee and trade finance services in the period 2011-2015
Unit: Million VND
14000
12000
10000
8000
6000
4000
2000
0
5193 5695
2742 3420
8889
3992
11604 12206
5143 5312
2011 2012 2013 2014 2015
Net income from guarantee services Net income from Trade Finance
(Source: Report on the implementation of the annual business plan of the General Planning Department of BIDV Tien Giang [24])
Through chart 2.5, we can see that BIDV Tien Giang's income from guarantee services and trade finance has grown over the years. The reason is: Among BIDV Tien Giang's corporate customers, the construction industry is the industry with the highest proportion of customers after the trading industry, this is a group of customers with potential to develop guarantee services. The second group of customers is corporate customers in the fields of agricultural production, livestock and seafood processing with high import and export turnover in the area.
are the target of trade finance development. In addition, BIDV Tien Giang also focuses on continuously developing these customer groups to increase revenue for many other products and services in the future.
2.2.1.4. Card and POS services:
As a service that BIDV Tien Giang has recently developed strongly, it can be said that this is a very potential market and has the ability to develop even more strongly in the future. Card services with outstanding advantages such as fast payment time, wide payment range, quite safe, effective and suitable for the integration trend and the Project to promote non-cash payments in Vietnam. Cards have become a modern and popular payment tool. BIDV Tien Giang early identified that developing card services is to expand the market to people in society, create capital mobilized from card-opened accounts, contribute to diversifying banking activities, enhance the image of the bank, bring the BIDV Tien Giang brand to people as quickly and easily as possible. BIDV Tien Giang is currently providing card types such as: credit cards (BIDV MasterCard Platinum, BIDV Visa Gold Precious, BIDV Visa Manchester United, BIDV Visa Classic), international debit cards (BIDV Ready Card, BIDV Manu Debit Card), domestic debit cards (BIDV Harmony Card, BIDV eTrans Card, BIDV Moving Card, BIDV-Lingo Co-branded Card, BIDV-Co.opmart Co-branded Card). These cards can be paid via POS/EDC or on the ATM system. In addition, with debit cards, customers can not only withdraw money via ATMs but also perform utilities such as mobile top-up, online payment, money transfer,... through electronic banking services.
In order to attract customers with card services, BIDV Tien Giang has continuously increased the installation of ATMs. As of December 31, 2015, BIDV Tien Giang has 23 ATMs combined with 7 ATMs in the same system of BIDV My Tho, so the number of ATMs is quite large, especially in the center of My Tho City, but is not yet fully present in the districts. Basic services on ATMs such as withdrawing money, checking balances, printing short statements,... BIDV ATMs accept cards from banks in the system.
Banknetvn and Smartlink, cards branded by international card organizations Union Pay (CUP), VISA, MasterCard and cards of banks in the Asian Payment Network. From here, cardholders can make bill payments for themselves or others at ATMs, by simply entering the subscriber number or customer code, booking code that service providers notify and make bill payments.
Chart 2.6. Net income from card services in the period 2011-2015
Unit: Million VND
3500
3000
2500
2000
1500
1000
500
0
687
1023
1547
2267
3104
2011 2012 2013 2014 2015
Net income from card services
(Source: Report on the implementation of the annual business plan of the General Planning Department of BIDV Tien Giang [24])
Through chart 2.6, it can be seen that BIDV Tien Giang's card service income is constantly growing because the Branch focuses on developing businesses operating in industrial parks, which are the source of customers for salary payment products, ATMs, BSMS. Specifically, there are companies such as Freeview, Quang Viet, Dai Thanh, which are businesses with a large number of card openings at the Branch, contributing to the increase in card service fees [25].
Table 2.6. Number of ATMs and POS machines in 2015 of some banks in Tien Giang area.
Unit: Machine
STT
Bank name
Number of ATMs
Cumulative number of ATM cards
POS machine
1
BIDV Tien Giang
23
97,095
22
2
BIDV My Tho
7
21,325
0
3
Agribank Tien Giang
29
115,743
77
4
Vietinbank Tien Giang
16
100,052
54
5
Dong A Tien Giang
26
97,536
11
6
Sacombank Tien Giang
24
88,513
27
7
Vietcombank Tien Giang
15
61,607
96
8
Vietinbank - Tay Tien Giang Branch
6
46,042
38
(Source: 2015 Banking Activity Data Report of the General and Internal Control Department of the Provincial State Bank [21])
Through table 2.6, the author finds that the number of ATMs of BIDV Tien Giang is not much, ranking fourth after Agribank Tien Giang, Dong A Tien Giang, Sacombank Tien Giang. The number of POS machines of BIDV Tien Giang is very small, only higher than Dong A Tien Giang and BIDV My Tho in the initial stages of merging the BIDV system. Besides, BIDV Tien Giang has a high number of cards increasing over the years (table 2.7) but the cumulative number of cards issued up to December 31, 2015 is still relatively low compared to Agribank, Vietcombank, Dong A (table 2.6).
div.maincontent .content_head3 { color: black; font-family:"Times New Roman", serif; font-style: normal; font-weight: bold; text-decoration: none; font-size: 14pt; }
div.maincontent .p { color: black; font-family:"Times New Roman", serif; font-style: normal; font-weight: normal; text-decoration: none; font-size: 14pt; margin:0pt; }
div.maincontent p { color: black; font-family:"Times New Roman", serif; font-style: normal; font-weight: normal; text-decoration: none; font-size: 14pt; margin:0pt; }
div.maincontent .s1 { color: black; font-family:"Courier New", monospace; font-style: normal; font-weight: normal; text-decoration: none; font-size: 14pt; }
div.maincontent .s2 { color: black; font-family:"Times New Roman", serif; font-style: italic; font-weight: normal; text-decoration: none; font-size: 13pt; }
div.maincontent .s3 { color: black; font-family:"Times New Roman", serif; font-style: italic; font-weight: bold; text-decoration: none; font-size: 14pt; }
div.maincontent .s4 { color: black; font-family:"Times New Roman", serif; font-style: italic; font-weight: normal; text-decoration: none; font-size: 14pt; }
div.maincontent .s5 { color: black; font-family:"Times New Roman", serif; font-style: normal; font-weight: normal; text-decoration: none; font-size: 14pt; }
div.maincontent .s6 { color: black; font-family:"Times New Roman", serif; font-style: normal; font-weight: bold; text-decoration: none; font-size: 14pt; }
div.maincontent .s7 { color: black; font-family:"Times New Roman", serif; font-style: normal; font-weight: normal; text-decoration: none; font-size: 13.5pt; }
div.maincontent .s8 { color: black; font-family:Arial, sans-serif; font-style: normal; font-weight: normal; text-decoration: none; font-size: 9pt; }
div.maincontent .s9 { color: black; font-family:Arial, sans-serif; font-style: normal; font-weight: normal; text-decoration: none; font-size: 9pt; vertical-align: -2pt; }
div.maincontent .s10 { color: black; font-family:Arial, sans-serif; font-style: normal; font-weight: normal; text-decoration: none; font-size: 9pt; vertical-align: 5pt; }
div.maincontent .s11 { color: black; font-family:Arial, sans-serif; font-style: normal; font-weight: normal; text-decoration: none; font-size: 9pt; vertical-align: -5pt; }
div.maincontent .s12 { color: black; font-family:Arial, sans-serif; font-style: normal; font-weight: normal; text-decoration: none; font-size: 9pt; vertical-align: -3pt; }
div.maincontent .s13 { color: black; font-family:Arial, sans-serif; font-style: normal; font-weight: normal; text-decoration: none; font-size: 9pt; vertical-align: -4pt; }
div.maincontent .s14 { color: black; font-family:Arial, sans-serif; font-style: normal; font-weight: normal; text-decoration: none; font-size: 7.5pt; }
div.maincontent .s15 { color: black; font-family:"Times New Roman", serif; font-style: italic; font-weight: normal; text-decoration: none; font-size: 14pt; }
div.maincontent .s16 { color: black; font-family:Arial, sans-serif; font-style: normal; font-weight: normal; text-decoration: none; font-size: 10.5pt; }
div.maincontent .s17 { color: black; font-family:Arial, sans-serif; font-style: normal; font-weight: normal; text-decoration: none; font-size: 9.5pt; }
div.maincontent .s18 { color: black; font-family:Arial, sans-serif; font-style: normal; font-weight: normal; text-decoration: none; font-size: 10.5pt; vertical-align: -1pt; }
div.maincontent .s19 { color: black; font-family:Arial, sans-serif; font-style: normal; font-weight: normal; text-decoration: none; font-size: 10.5pt; vertical-align: -5pt; }
div.maincontent .s20 { color: black; font-family:Arial, sans-serif; font-style: normal; font-weight: normal; text-decoration: none; font-size: 10.5pt; vertical-align: -2pt; }
div.maincontent .s21 { color: black; font-family:Arial, sans-serif; font-style: normal; font-weight: normal; text-decoration: none; font-size: 10pt; }
div.maincontent .s22 { color: black; font-family:Calibri, sans-serif; font-style: normal; font-weight: normal; text-decoration: none; font-size: 10.5pt; }
div.maincontent .s23 { color: black; font-family:Calibri, sans-serif; font-style: normal; font-weight: normal; text-decoration: none; font-size: 10.5pt; vertical-align: -3pt; }
div.maincontent .s24 { color: black; font-family:Calibri, sans-serif; font-style: normal; font-weight: normal; text-decoration: none; font-size: 10.5pt; vertical-align: -5pt; }
div.maincontent .s25 { color: black; font-family:"Times New Roman", serif; font-style: normal; font-weight: normal; text-decoration: none; font-size: 10.5pt; }
div.maincontent .s26 { color: black; font-family:Calibri, sans-serif; font-style: normal; font-weight: normal; text-decoration: none; font-size: 10.5pt; vertical-align: -4pt; }
div.maincontent .s27 { color: black; font-family:Calibri, sans-serif; font-style: normal; font-weight: normal; text-decoration: none; font-size: 10.5pt; vertical-align: -6pt; }
div.maincontent .s28 { color: black; font-family:Calibri, sans-serif; font-style: normal; font-weight: normal; text-decoration: none; font-size: 10.5pt; vertical-align: -1pt; }
div.maincontent .s29 { color: black; font-family:Calibri, sans-serif; font-style: normal; font-weight: normal; text-decoration: none; font-size: 11.5pt; }
div.maincontent .s30 { color: black; font-family:Calibri, sans-serif; font-style: normal; font-weight: normal; text-decoration: none; font-size: 11pt; }
div.maincontent .s31 { color: black; font-family:"Times New Roman", serif; font-style: normal; font-weight: normal; text-decoration: none; font-size: 11pt; }
div.maincontent .s32 { color: black; font-family:.VnTime, sans-serif; font-style: normal; font-weight: normal; text-decoration: none; font-size: 14pt; }
div.maincontent .s33 { color: black; font-family:Cambria, serif; font-style: normal; font-weight: normal; text-decoration: none; font-size: 10.5pt; }
div.maincontent .s34 { color: black; font-family:Cambria, serif; font-style: normal; font-weight: normal; text-decoration: none; font-size: 10.5pt; vertical-align: -4pt; }
div.maincontent .s35 { color: black; font-family:Arial, sans-serif; font-style: normal; font-weight: normal; text-decoration: none; font-size: 11.5pt; }
div.maincontent .s36 { color: black; font-family:Arial, sans-serif; font-style: normal; font-weight: bold; text-decoration: none; font-size: 14pt; }
div.maincontent .s37 { color: black; font-family:"Times New Roman", serif; font-style: normal; font-weight: bold; text-decoration: none; font-size: 13pt; }
div.maincontent .s38 { color: black; font-family:"Times New Roman", serif; font-style: normal; font-weight: normal; text-decoration: none; font-size: 13pt; }
div.maincontent .s39 { color: black; font-family:"Times New Roman", serif; font-style: normal; font-weight: normal; text-decoration: none; font-size: 15pt; }
div.maincontent .s40 { color: black; font-family:"Times New Roman", serif; font-style: normal; fo
Pre-tax Profit of Bidv Tien Giang in the Period 2011-2015
zt2i3t4l5ee
zt2a3gsnon-credit services, joint stock commercial bank
zt2a3ge
zc2o3n4t5e6n7ts
At that time, the Branch had to set aside a provision for credit risks, which reduced the Branch's income.
Chart 2.2. Pre-tax profit of BIDV Tien Giang in the period 2011-2015
Unit: Billion VND
140
120
100
80
60
40
20
0
63.3
80.34
89.29
110.08
131.99
2011 2012 2013 2014 2015
Profit before tax
(Source: Report on the implementation of the annual business plan of the General Planning Department of BIDV Tien Giang [24])
However, through chart 2.2, it can be seen that BIDV Tien Giang's profit is still increasing continuously, and its operating efficiency is currently leaking. This is a contribution of non-credit services, and this service segment will be increasingly focused on growth by BIDV Tien Giang to ensure the highest profit safety because credit activities have many potential risks. At the same time, focusing on developing non-credit services is consistent with one of the contents of restructuring the financial activities of credit institutions in the project "Restructuring the system of credit institutions in the period 2011-2015" approved by the Prime Minister in Decision No. 254/QD-TTg dated March 1, 2012 [14]: "Gradually shifting the business model of commercial banks towards reducing dependence on credit activities and increasing income from non-credit services".
2.2. Current status of non-credit service development at BIDV Tien Giang.
2.2.1. BIDV Tien Giang has deployed the development of non-credit services in recent times.
Along with the development of the Head Office, BIDV Tien Giang's products and services are constantly improved and deployed in a diverse manner to ensure provision for many different customer groups in the area: individual customers, corporate customers, and financial institutions. Typical services are as follows: Payment services, treasury services, guarantee services, card services, trade finance, other services: Western Union, insurance commissions, consulting services, foreign exchange derivatives trading, e-banking services,...
2.2.1.1. Payment services:
In accordance with the Prime Minister's Project to promote non-cash payments in Vietnam [15], banks in Tien Giang province have continuously developed payment services to reduce customers' cash usage habits through card services and electronic banking services such as: salary payment through accounts, focusing on developing card acceptance points, developing multi-purpose cards, paying social insurance by transfer, paying bills through banks, etc.
Chart 2.3. Net income from payment services in the period 2011-2015
Unit: Million VND
6000
5000
4000
3000
2000
1000
0
3922 4065
4720 5084 5324
2011 2012 2013 2014 2015
Net income from payment services
(Source: Report on the implementation of the annual business plan of the General Planning Department of BIDV Tien Giang [24])
Along with the technological development of the entire system, BIDV Tien Giang has a payment system with a fairly stable transaction processing speed, bringing many conveniences to customers. The results of observing chart 2.3 show that the income from payment services that the Branch has achieved has grown over the years but the speed is not high and the products are not outstanding compared to other banks. Domestic payment products such as: Online bill payment, electricity bills, water bills, insurance premiums, cable TV bills, telecommunications fees, airline tickets, etc. bring many conveniences to customers. Regarding international payment, this is an indispensable activity for foreign economic activities, BIDV Tien Giang is providing international payment methods for small enterprises producing agriculture, aquatic food and seafood that have credit relationships with banks in industrial parks in Tien Giang province such as: money transfer, collection, L/C payment.
2.2.1.2. Treasury services:
BIDV Tien Giang always focuses on ensuring treasury safety and currency security, always complies with legal regulations, and minimizes risks in operations such as: counting and collecting money from customers, receiving and delivering internal transactions, collecting from the State Bank (SBV) or other credit institutions, receiving ATM funds, bundling money, etc. BIDV Tien Giang's treasury service management department is always fully equipped with modern machinery and equipment such as: money transport vehicles, fire prevention tools, money counters, money detectors, magnifying glasses, etc. to ensure absolute safety in treasury operations, immediately identifying real and fake money and other risks that may affect people and assets of the bank and customers. In addition, implementing regulation 2480/QC dated October 28, 2008 between the State Bank of Tien Giang province and the Provincial Police on coordination in the fight against counterfeit money, in the 3-year review of implementation, BIDV Tien Giang discovered, seized and submitted to the State Bank of Tien Giang province 475 banknotes of various denominations and was commended by the Provincial Police and the State Bank of Tien Giang province [17].
Chart 2.4. Net income from treasury services in the period 2011-2015
Unit: Million VND
350
300
250
200
150
100
50
0
105 122
309 289 279
2011 2012 2013 2014 2015
Net income from treasury services
(Source: Report on the implementation of the annual business plan of the General Planning Department of BIDV Tien Giang [24])
However, as shown in Figure 2.4, income from treasury operations is not high and fluctuates. Specifically, in the period 2011-2013, net income increased and increased most sharply in 2013, then in the period 2013-2015, there was a downward trend. This fluctuation is due to the fact that fees collected from treasury services are often very low and can even be waived to attract customers to use other services.
2.2.1.3. Guarantee and trade finance services:
BIDV Tien Giang, thanks to the advantages of the province and the favorable location of the Branch, has continuously focused on developing income from guarantee services and trade finance.
Chart 2.5. Net income from guarantee and trade finance services in the period 2011-2015
Unit: Million VND
14000
12000
10000
8000
6000
4000
2000
0
5193 5695
2742 3420
8889
3992
11604 12206
5143 5312
2011 2012 2013 2014 2015
Net income from guarantee services Net income from Trade Finance
(Source: Report on the implementation of the annual business plan of the General Planning Department of BIDV Tien Giang [24])
Through chart 2.5, we can see that BIDV Tien Giang's income from guarantee services and trade finance has grown over the years. The reason is: Among BIDV Tien Giang's corporate customers, the construction industry is the industry with the highest proportion of customers after the trading industry, this is a group of customers with potential to develop guarantee services. The second group of customers is corporate customers in the fields of agricultural production, livestock and seafood processing with high import and export turnover in the area.
are the target of trade finance development. In addition, BIDV Tien Giang also focuses on continuously developing these customer groups to increase revenue for many other products and services in the future.
2.2.1.4. Card and POS services:
As a service that BIDV Tien Giang has recently developed strongly, it can be said that this is a very potential market and has the ability to develop even more strongly in the future. Card services with outstanding advantages such as fast payment time, wide payment range, quite safe, effective and suitable for the integration trend and the Project to promote non-cash payments in Vietnam. Cards have become a modern and popular payment tool. BIDV Tien Giang early identified that developing card services is to expand the market to people in society, create capital mobilized from card-opened accounts, contribute to diversifying banking activities, enhance the image of the bank, bring the BIDV Tien Giang brand to people as quickly and easily as possible. BIDV Tien Giang is currently providing card types such as: credit cards (BIDV MasterCard Platinum, BIDV Visa Gold Precious, BIDV Visa Manchester United, BIDV Visa Classic), international debit cards (BIDV Ready Card, BIDV Manu Debit Card), domestic debit cards (BIDV Harmony Card, BIDV eTrans Card, BIDV Moving Card, BIDV-Lingo Co-branded Card, BIDV-Co.opmart Co-branded Card). These cards can be paid via POS/EDC or on the ATM system. In addition, with debit cards, customers can not only withdraw money via ATMs but also perform utilities such as mobile top-up, online payment, money transfer,... through electronic banking services.
In order to attract customers with card services, BIDV Tien Giang has continuously increased the installation of ATMs. As of December 31, 2015, BIDV Tien Giang has 23 ATMs combined with 7 ATMs in the same system of BIDV My Tho, so the number of ATMs is quite large, especially in the center of My Tho City, but is not yet fully present in the districts. Basic services on ATMs such as withdrawing money, checking balances, printing short statements,... BIDV ATMs accept cards from banks in the system.
Banknetvn and Smartlink, cards branded by international card organizations Union Pay (CUP), VISA, MasterCard and cards of banks in the Asian Payment Network. From here, cardholders can make bill payments for themselves or others at ATMs, by simply entering the subscriber number or customer code, booking code that service providers notify and make bill payments.
Chart 2.6. Net income from card services in the period 2011-2015
Unit: Million VND
3500
3000
2500
2000
1500
1000
500
0
687
1023
1547
2267
3104
2011 2012 2013 2014 2015
Net income from card services
(Source: Report on the implementation of the annual business plan of the General Planning Department of BIDV Tien Giang [24])
Through chart 2.6, it can be seen that BIDV Tien Giang's card service income is constantly growing because the Branch focuses on developing businesses operating in industrial parks, which are the source of customers for salary payment products, ATMs, BSMS. Specifically, there are companies such as Freeview, Quang Viet, Dai Thanh, which are businesses with a large number of card openings at the Branch, contributing to the increase in card service fees [25].
Table 2.6. Number of ATMs and POS machines in 2015 of some banks in Tien Giang area.
Unit: Machine
STT
Bank name
Number of ATMs
Cumulative number of ATM cards
POS machine
1
BIDV Tien Giang
23
97,095
22
2
BIDV My Tho
7
21,325
0
3
Agribank Tien Giang
29
115,743
77
4
Vietinbank Tien Giang
16
100,052
54
5
Dong A Tien Giang
26
97,536
11
6
Sacombank Tien Giang
24
88,513
27
7
Vietcombank Tien Giang
15
61,607
96
8
Vietinbank - Tay Tien Giang Branch
6
46,042
38
(Source: 2015 Banking Activity Data Report of the General and Internal Control Department of the Provincial State Bank [21])
Through table 2.6, the author finds that the number of ATMs of BIDV Tien Giang is not much, ranking fourth after Agribank Tien Giang, Dong A Tien Giang, Sacombank Tien Giang. The number of POS machines of BIDV Tien Giang is very small, only higher than Dong A Tien Giang and BIDV My Tho in the initial stages of merging the BIDV system. Besides, BIDV Tien Giang has a high number of cards increasing over the years (table 2.7) but the cumulative number of cards issued up to December 31, 2015 is still relatively low compared to Agribank, Vietcombank, Dong A (table 2.6).
div.maincontent .content_head3 { color: black; font-family:"Times New Roman", serif; font-style: normal; font-weight: bold; text-decoration: none; font-size: 14pt; }
div.maincontent .p { color: black; font-family:"Times New Roman", serif; font-style: normal; font-weight: normal; text-decoration: none; font-size: 14pt; margin:0pt; }
div.maincontent p { color: black; font-family:"Times New Roman", serif; font-style: normal; font-weight: normal; text-decoration: none; font-size: 14pt; margin:0pt; }
div.maincontent .s1 { color: black; font-family:"Courier New", monospace; font-style: normal; font-weight: normal; text-decoration: none; font-size: 14pt; }
div.maincontent .s2 { color: black; font-family:"Times New Roman", serif; font-style: italic; font-weight: normal; text-decoration: none; font-size: 13pt; }
div.maincontent .s3 { color: black; font-family:"Times New Roman", serif; font-style: italic; font-weight: bold; text-decoration: none; font-size: 14pt; }
div.maincontent .s4 { color: black; font-family:"Times New Roman", serif; font-style: italic; font-weight: normal; text-decoration: none; font-size: 14pt; }
div.maincontent .s5 { color: black; font-family:"Times New Roman", serif; font-style: normal; font-weight: normal; text-decoration: none; font-size: 14pt; }
div.maincontent .s6 { color: black; font-family:"Times New Roman", serif; font-style: normal; font-weight: bold; text-decoration: none; font-size: 14pt; }
div.maincontent .s7 { color: black; font-family:"Times New Roman", serif; font-style: normal; font-weight: normal; text-decoration: none; font-size: 13.5pt; }
div.maincontent .s8 { color: black; font-family:Arial, sans-serif; font-style: normal; font-weight: normal; text-decoration: none; font-size: 9pt; }
div.maincontent .s9 { color: black; font-family:Arial, sans-serif; font-style: normal; font-weight: normal; text-decoration: none; font-size: 9pt; vertical-align: -2pt; }
div.maincontent .s10 { color: black; font-family:Arial, sans-serif; font-style: normal; font-weight: normal; text-decoration: none; font-size: 9pt; vertical-align: 5pt; }
div.maincontent .s11 { color: black; font-family:Arial, sans-serif; font-style: normal; font-weight: normal; text-decoration: none; font-size: 9pt; vertical-align: -5pt; }
div.maincontent .s12 { color: black; font-family:Arial, sans-serif; font-style: normal; font-weight: normal; text-decoration: none; font-size: 9pt; vertical-align: -3pt; }
div.maincontent .s13 { color: black; font-family:Arial, sans-serif; font-style: normal; font-weight: normal; text-decoration: none; font-size: 9pt; vertical-align: -4pt; }
div.maincontent .s14 { color: black; font-family:Arial, sans-serif; font-style: normal; font-weight: normal; text-decoration: none; font-size: 7.5pt; }
div.maincontent .s15 { color: black; font-family:"Times New Roman", serif; font-style: italic; font-weight: normal; text-decoration: none; font-size: 14pt; }
div.maincontent .s16 { color: black; font-family:Arial, sans-serif; font-style: normal; font-weight: normal; text-decoration: none; font-size: 10.5pt; }
div.maincontent .s17 { color: black; font-family:Arial, sans-serif; font-style: normal; font-weight: normal; text-decoration: none; font-size: 9.5pt; }
div.maincontent .s18 { color: black; font-family:Arial, sans-serif; font-style: normal; font-weight: normal; text-decoration: none; font-size: 10.5pt; vertical-align: -1pt; }
div.maincontent .s19 { color: black; font-family:Arial, sans-serif; font-style: normal; font-weight: normal; text-decoration: none; font-size: 10.5pt; vertical-align: -5pt; }
div.maincontent .s20 { color: black; font-family:Arial, sans-serif; font-style: normal; font-weight: normal; text-decoration: none; font-size: 10.5pt; vertical-align: -2pt; }
div.maincontent .s21 { color: black; font-family:Arial, sans-serif; font-style: normal; font-weight: normal; text-decoration: none; font-size: 10pt; }
div.maincontent .s22 { color: black; font-family:Calibri, sans-serif; font-style: normal; font-weight: normal; text-decoration: none; font-size: 10.5pt; }
div.maincontent .s23 { color: black; font-family:Calibri, sans-serif; font-style: normal; font-weight: normal; text-decoration: none; font-size: 10.5pt; vertical-align: -3pt; }
div.maincontent .s24 { color: black; font-family:Calibri, sans-serif; font-style: normal; font-weight: normal; text-decoration: none; font-size: 10.5pt; vertical-align: -5pt; }
div.maincontent .s25 { color: black; font-family:"Times New Roman", serif; font-style: normal; font-weight: normal; text-decoration: none; font-size: 10.5pt; }
div.maincontent .s26 { color: black; font-family:Calibri, sans-serif; font-style: normal; font-weight: normal; text-decoration: none; font-size: 10.5pt; vertical-align: -4pt; }
div.maincontent .s27 { color: black; font-family:Calibri, sans-serif; font-style: normal; font-weight: normal; text-decoration: none; font-size: 10.5pt; vertical-align: -6pt; }
div.maincontent .s28 { color: black; font-family:Calibri, sans-serif; font-style: normal; font-weight: normal; text-decoration: none; font-size: 10.5pt; vertical-align: -1pt; }
div.maincontent .s29 { color: black; font-family:Calibri, sans-serif; font-style: normal; font-weight: normal; text-decoration: none; font-size: 11.5pt; }
div.maincontent .s30 { color: black; font-family:Calibri, sans-serif; font-style: normal; font-weight: normal; text-decoration: none; font-size: 11pt; }
div.maincontent .s31 { color: black; font-family:"Times New Roman", serif; font-style: normal; font-weight: normal; text-decoration: none; font-size: 11pt; }
div.maincontent .s32 { color: black; font-family:.VnTime, sans-serif; font-style: normal; font-weight: normal; text-decoration: none; font-size: 14pt; }
div.maincontent .s33 { color: black; font-family:Cambria, serif; font-style: normal; font-weight: normal; text-decoration: none; font-size: 10.5pt; }
div.maincontent .s34 { color: black; font-family:Cambria, serif; font-style: normal; font-weight: normal; text-decoration: none; font-size: 10.5pt; vertical-align: -4pt; }
div.maincontent .s35 { color: black; font-family:Arial, sans-serif; font-style: normal; font-weight: normal; text-decoration: none; font-size: 11.5pt; }
div.maincontent .s36 { color: black; font-family:Arial, sans-serif; font-style: normal; font-weight: bold; text-decoration: none; font-size: 14pt; }
div.maincontent .s37 { color: black; font-family:"Times New Roman", serif; font-style: normal; font-weight: bold; text-decoration: none; font-size: 13pt; }
div.maincontent .s38 { color: black; font-family:"Times New Roman", serif; font-style: normal; font-weight: normal; text-decoration: none; font-size: 13pt; }
div.maincontent .s39 { color: black; font-family:"Times New Roman", serif; font-style: normal; font-weight: normal; text-decoration: none; font-size: 15pt; }
div.maincontent .s40 { color: black; font-family:"Times New Roman", serif; font-style: normal; fo -
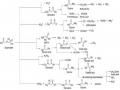 Effect of Initial Glyphosate Concentration on Processability of Electrochemical Fenton Process
Comparison of metal concentrations in lake water shown in Table 3.37 and Table 3.39 shows that the metal concentrations of Hoa Muc lake water did not change much after spraying lanthanum modified bentonite throughout the lake. The results of metal content analysis in the bottom mud of Hoa Muc lake after treatment with B90-La material are shown in Table 3.40. Comparison of metal content in the bottom mud layer before treatment (Table 3.38) and after treatment of Hoa Muc lake with B90-La material (Table 3.40) showed that the change was insignificant. This value is much lower than the Vietnamese Standard on sediment quality of the Ministry of Natural Resources and Environment.
Table 3.40. Metal content of Hoa Muc lake bottom mud sample after lake treatment
Target
Unit | Metal concentration | Target | Unit | Metal concentration | |
Zn | mg/l | 1,544 | Fe | mg/l | 20,342 |
Ni | mg/l | 0.078 | Pb | mg/l | 0.207 |
CD | mg/l | 0.004 | Ag | mg/l | 0.015 |
As | mg/l | 0.009 | Al | mg/l | 14,982 |
Cr | mg/l | 0.274 | Mn | mg/l | 0.732 |
Cu | mg/l | 0.085 | Ash content | % | 14.25 |
( April 5, 2011 )
3.7.4. Species composition and density of algae before and after treating Hoa Muc lake with B90-La material
The results of the analysis of species composition and density of algae in Hoa Muc Lake are shown in Appendix P22. Through surveys, 37 species of algae and cyanobacteria were discovered in Hoa Muc Lake belonging to 5 phyla: green algae (Chlorophyta) with 22 species, eye algae (Euglenophyta) with 4 species, siliceous algae (Bacillariophyta) with 3 species, dorsoventral algae (Cryptophyta) with 1 species and cyanobacteriophyta with 7 species.
3.7.4.1. Species composition
The changes in algae species composition in Hoa Muc lake in the control area and the area treated with B90-La over the survey period are shown in Figure 3.58. The algae species composition in Hoa Muc lake is diverse with many different species. With two dominant phyla of green algae and cyanobacteria.
From Figure 3.58, it can be seen that before the entire lake was treated, the composition of green algae and cyanobacteria was quite rich (April 5, 2011). After treatment, we can see that the number of green algae species was still quite high, although it decreased slightly on April 14, 2011 (after 7 days) and April 26, 2011 (after 14 days), but then continued to increase on May 3, 2011. On the contrary, the number of cyanobacteria species decreased significantly. In the control area, the number of green algae species decreased significantly, while the number of cyanobacteria species remained unchanged until April 26, 2011. On May 3, 2011, the number of species of all phyla in the control area decreased.
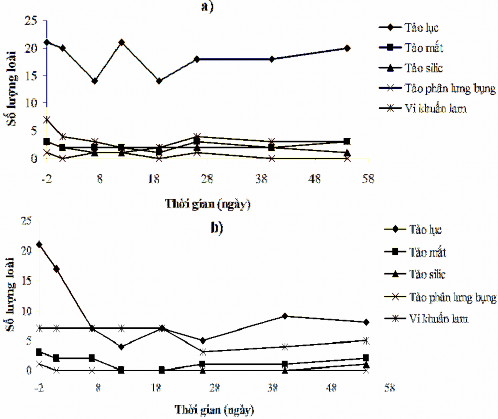
Figure 3.58. Changes in algae species composition of Hoa Muc lake water before and after treatment with B90-La: a) treated area, b) control area.
The results of species composition analysis showed that in the treated lake, the dominant species were unicellular green algae, in which the genera Pediastrum and Scenedesmus were very abundant. In contrast, cyanobacteria belonging to the genera Merismopedia and Microcystis were very common in the control area.