Glucose (mmol/L) | X ± SD | 13.21 ± 2.45 | 10.58 ± 4.18 | 13.74 ± 6.49 | 13.20 ± 6.00 | 0.195b |
HbA1C (%) | X ± SD | 12.24 ± 2.48 | 10.11 ± 2.38 | 10.82 ± 2.57 | 10.43 ± 2.17 | 0.204a |
Cholesterol (mmol/L) | X ± SD | 4.90 ± 1.01 | 5.06 ± 1.37 | 5.24 ± 1.10 | 5.64 ± 1.98 | 0.697 b |
Triglycerides (mmol/L) | X ± SD | 1.47 ± 0.72 | 2.87 ± 2.97 | 2.77 ± 2.19 | 3.97 ± 4.66 | 0.012 b |
HDL (mmol/L) | X ± SD | 1.35 ± 0.36 | 1.37 ± 0.56 | 1.05 ± 0.25 | 1.23 ± 0.76 | 0.022b |
LDL (mmol/L) | X ± SD | 2.82 ± 0.84 | 2.55 ± 1.17 | 3.04 ± 0.96 | 2.63 ± 1.01 | 0.385 b |
Creatinine (µmol/L) | X ± SD | 64.10 ± 28.73 | 63.31 ± 10.21 | 79.57 ± 30.88 | 87.62 ± 26.72 | 0.001 b |
MLCT (ml/min/1.73 m 2 ) | X ± SD | 104.61 ± 29.00 | 92.50 ± 22.81 | 88.54 ± 31.59 | 84.52 ± 37.03 | 0.137b |
≥ 60 | 6 (7.79) | 20 (25.97) | 19 (24.68) | 32 (41.56) | 0.107 c | |
< 60 | 1 (7.69) | 0 (0) | 3 (23.08) | 9 (69.23) |
Maybe you are interested!
-

 Correlation Between Some Clinical and Paraclinical Factors With Asmih Reduction
 -
 Study on Some Clinical and Paraclinical Features of Appendiceal Abscess
 -
 Epidemiological, molecular biological, clinical, paraclinical characteristics and factors affecting the effectiveness of treatment of chronic hepatitis B virus with antiviral drugs - 21
 -
 Clinical and Paraclinical Characteristics of Pregnant Women with Placenta Previa at Hanoi Obstetrics and Gynecology Hospital
 -
 Clinical and Paraclinical Features of Lacrimal Gland Tumor
a : Oneway ANOVA test; b : Kruskal Wallis Test; c : Fisher's Exact Test, d :
Chi-Square Test
Some clinical characteristics such as age, gender and HATT were different between risk groups. The age group over 60 also showed a higher risk of cardiovascular disease than the remaining age groups (p = 0.005). Characteristics such as smoking and time of diabetes detection over 10 years did not show any difference between groups. Regarding paraclinical characteristics, triglycerides had an average value that gradually increased from low risk to medium risk, high risk and very high risk; at the same time, HDL-C tended to decrease gradually, the difference was significant with p < 0.05. Cholesterol also had an average value that gradually increased according to risk levels, however, the difference was not statistically significant (p > 0.05).
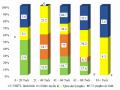
Continuing the same analysis with the WHO/ISH scale, we obtained results on the relationship between cardiovascular risk according to the WHO/ISH scale and some characteristics of the study subjects presented in Table 3.3.2.
Table 3.3.2: Correlation of some clinical and paraclinical characteristics with risk stratification according to WHO/ISH scale
Characteristic
Risk stratification | p | |||||
Short | Medium | High | Very high | |||
Age (years) n (%) | X ± SD | 57.42 ± 8.64 | 64.71 ± 8.03 | 70.23 ± 4.13 | 68.67 ± 5.75 | <0.001 b |
< 60 | 12 (63.16) | 6 (31.58) | 0 (0) | 1(5.26) | <0.001 c | |
≥ 60 | 7 (9.86) | 25 (35.21) | 13 (18.31) | 26 (36.62) | ||
Gender n (%) | Male | 7 (18.42) | 13 (34.21) | 6 (15.79) | 12 (31.58) | 0.948 d |
Female | 12 (23.07) | 18 (34.62) | 7 (13.46) | 15 (28.85) | ||
BMI (kg/m 2 ) | X ± SD | 22.41 ± 2.64 | 22.75 ± 3.05 | 23.99 ± 3.62 | 23.83 ± 3.36 | 0.316a |
HATT (mmHg) | X ± SD | 113.68 ± 8.95 | 122.42 ± 10.24 | 129.23 ± 9.54 | 136.11 ± 14.57 | <0.001 b |
Smoking n (%) | Have | 1 (14.29) | 2 (28.57) | 1 (14.29) | 3 (42.86) | 0.899 c |
Are not | 18 (21.69) | 29 (34.94) | 12 (14.46) | 24 (28.92) | ||
Time to detect diabetes n (%) | < 10 year | 13 (25.00) | 22 (42.31) | 4 (7.69) | 13 (25.00) | 0.011 d |
≥ 10 years | 6 (18.75) | 5 (15.63) | 9 (28.12) | 12 (37.50) | ||
Glucose (mmol/L) | X ± SD | 12.62 ± 4.45 | 12.17 ± 5.61 | 12.95 ± 6.22 | 13.41 ± 6.30 | 0.795 b |
HbA1C (%) | X ± SD | 10.87 ± 2.14 | 10.98 ± 2.75 | 9.84 ± 2.24 | 10.36 ± 2.09 | 0.461a |
Cholesterol (mmol/L) | X ± SD | 4.58 ± 0.61 | 5.00 ± 1.23 | 4.73 ± 1.31 | 6.61 ± 1.92 | <0.001 b |
Triglycerides (mmol/L) | X ± SD | 2.63 ± 2.17 | 2.16 ± 0.99 | 2.84 ± 1.84 | 5.10 ± 5.88 | 0.048 b |
HDL (mmol/L) | X ± SD | 1.09 ± 0.25 | 1.13 ± 0.31 | 1.14 ± 0.26 | 1.48 ± 0.98 | 0.466 b |
LDL (mmol/L) | X ± SD | 2.21 ± 0.65 | 2.84 ± 0.95 | 2.40 ± 1.03 | 3.10 ± 1.16 | 0.024 b |
Creatinine (µmol/L) | X ± SD | 67.23 ± 19.80 | 76.53 ± 26.53 | 87.45 ± 28.45 | 83.71 ± 29.76 | 0.090 b |
MLCT (ml/min/1.73 m 2 ) | X ± SD | 100.86 ± 25.36 | 91.69 ± 33.73 | 85.19 ± 47.02 | 79.24 ± 23.94 | 0.063 b |
≥ 60 | 18 (23.38) | 28 (36.36) | 10 (12.99) | 21 (27.27) | 0.259 c | |
< 60 | 1 (7.69) | 3 (23.08) | 3 (23.08) | 6 (46.15) |
a : Oneway ANOVA test; b : Kruskal Wallis Test; c : Fisher's Exact Test, d :
Chi-Square Test
Results from Table 3.3.2 show that the age group over 60 has a statistically significant difference in cardiovascular risk compared to the remaining age groups (p < 0.05). HATT increases gradually with increasing risk. Time to detect diabetes over 10 years is associated with increased cardiovascular risk. There are differences in cholesterol, triglyceride and LDL levels between risk groups (p < 0.05). Other indicators are similar between risk groups.
3.4. Assessment of agreement between the Framingham and WHO/ISH scales Table 3.4: Kappa analysis of agreement between the two scales
WHO risk stratification | kappa | P | |||||
Short (n) | Central vase (n) | High (n) | Very high (n) | ||||
Framingham risk stratification | Short (n) | 6 | 1 | 0 | 0 | 0.259 | <0.001 |
Medium (n) | 8 | 9 | 1 | 2 | |||
High (n) | 5 | 12 | 3 | 2 | |||
Very high (n) | 0 | 9 | 9 | 23 | |||
It was found that the kappa value was 0.259; therefore, the agreement between the Framingham and WHO/ISH scores was considered poor (p < 0.001).
CHAPTER 4: DISCUSSION
4.1. Characteristics of some cardiovascular risk factors
Age: In our study, the average age of patients was 65.16 ± 8.31 years, of which the group over 60 years old accounted for a significantly high percentage (78.89%). This result is equivalent to the average age and proportion of the group over 60 years old in the study of Tran Thi Truc Linh (2016) (65.6 ± 9.90 years; 68.1%) [1], higher than the study of Tran Thua Nguyen (2021) (57.62 ± 8.15 years; 40.7%) [ 6]. The older the subjects of our study, the higher the risk of cardiovascular disease. In addition, we found that the group of patients over 60 years old was mostly female and the group under 60 years old of the study subjects was mostly male, this difference was statistically significant with p
< 0.05.
Gender : The study did not have much difference in the number of men and women. The number of female patients (57.78%) was higher than that of male patients. However, in a small sample size (n = 90), this difference was only random and could not conclude a gender trend, so it did not show the relationship between gender and disease status.
Body mass index (BMI) : The average BMI of type 2 diabetic subjects was 23.20 ± 3.17 kg/m 2 ; women were higher than men, but the difference was not statistically significant. This average BMI result is similar to the study of Tran Thua Nguyen (2021) (23.93 ± 2.47 kg/m 2 ) [6], higher than the study of Tran Thi Truc Linh (2016) (22.62 ± 4.84 kg/m 2 ) [1]. The average BMI result in our study is at the upper limit of normal limits according to the classification scale of the Asian Diabetes Association. This is consistent with the statistics that most type 2 diabetic patients are overweight and obese, and good weight control plays an important role in the treatment and monitoring of diabetes [34].
Arterial blood pressure: The average HATT of the study was 125.67 ± 13.97 mmHg, lower than some other domestic studies. The study of Tran Thua Nguyen (2021) had an average HATT of 133.23 ± 16.6 mmHg [6], and that of Tran Thi Truc Linh (2016) was 143.88 ± 28.3 mmHg [ 1]. When compared with another study in the world, the average HATT in the study of Chen (2011) and colleagues on 663 patients in the project
The mean systolic blood pressure (BP) of the Framingham Heart Study was 146.9 ± 19.0 mmHg [27], and that of Yew (2019) and colleagues on patients with type 2 diabetes in Malaysia was 134.9 ± 16.7 mmHg [87]. The mean BPTT results of our study were at the pre-hypertensive level according to JNC VIII [75]. For patients with type 2 diabetes, blood pressure control plays an important role in preventing complications and disease progression because of the role of comorbid hypertension in increasing the risk of death and cardiovascular events [27].
Time of diabetes detection: The proportion of patients with diabetes detection time < 10 years accounted for 61.9%, higher than the group of patients with diabetes ≥ 10 years accounted for 38.1%. This result is equivalent to the study of Nguyen Nguyen Trang (2021) with the number of patients with diabetes detected for more than 10 years accounting for 37% [7]. According to a prospective study on Diabetes in the UK, cardiovascular complications often occur more often after 10 years [ 52].
Smoking: Although smoking accounts for only a very small proportion (7.78%), in our study, the proportion of women is higher than that of men, and 100% of the subjects who smoked were men, accounting for 13.46% of the total number of male patients, this is still a factor that deserves attention. Smoking is the main cause of doubling the risk of cardiovascular disease [ 20], a modifiable cardiovascular risk factor, largely thanks to patient awareness and health promotion. Quitting smoking brings long-term benefits to diabetic patients with many existing cardiovascular risk factors.
Glycemic control: The average fasting glucose and HbA1C levels in our study were high compared to the recommendations of ESC-EASD 2013 [76]. Specifically, only 10% of patients had fasting blood glucose levels below 7.2 mmol/L and only 7.78% of patients achieved HbA1C < 7%. This figure is lower than the rate of 16.6% of patients achieving both fasting blood glucose and HbA1C targets in the study of Tran Thua Nguyen (2021) [6], as well as lower than the rate of good control of fasting glucose (18.8%) and HbA1C (21.8%) according to the study of Nguyen Nguyen Trang (2021) [ 7].
Blood lipid profile: We found that the average values of blood lipid indices exceeded the recommendations of ESC-EASD 2013 [76], and at the same time, there was a high rate of patients who did not achieve the target of blood lipid control, especially in cholesterol, LDL-C and triglyceride indices. Only HDL-C was the index that the majority of patients (72.22%) achieved the target, there was a difference between men and women, specifically women had a higher average HDL-C than men (p < 0.05). Comparing the study of Tran Thi Truc Linh (2016) [1], we found that the indexes of total cholesterol, triglycerides, LDL-C were higher and HDL-C were lower than our study [ 1]. In general, there was a high rate of type 2 diabetes patients who did not achieve the target of blood lipid control treatment.
4.2. 10-year cardiovascular risk assessment using Framingham, WHO/ISH scores and related factors
The relationship between old age and cardiovascular events has been mentioned in many studies [30, 65, 88]. In our study, the proportion of cardiovascular risk groups was different between the two age groups above and below 60 years old, the difference was statistically significant when considering both the Framingham and WHO/ISH scales. This is consistent with the physiology of the body, the older the age, the longer the exposure time to risk factors, at the same time, other age-related diseases such as dyslipidemia, diabetes increase the negative impact on the cardiovascular system [59]. In particular, with the Framingham scale, we found that the older the age, the higher the risk level. This can be explained by calculating the Framingham score, considering age as a very important factor in estimating cardiovascular risk [62]. For example, in a male patient over 60 years old, the age-specific score is equivalent to an average risk (11.2%), the older the patient is, the higher the score and the higher the risk. The WHO/ISH score also has a statistically significant difference when comparing risk levels by age. However, when looking at the WHO/ISH chart, it is still possible for a patient over 60, or even over 70 years old, to have a low risk level as long as this person has good control of blood pressure and blood cholesterol.
There are many studies worldwide showing the relationship between high blood pressure and cardiovascular disease [49, 69, 72]. Our study shows that the level of
Cardiovascular risk increases with the HATT value, significant with p < 0.05 when considering both scales. In general, high blood pressure is common in diabetic patients and is also a major risk factor for cardiovascular diseases. Blood pressure control plays a particularly important role in preventing cardiovascular complications in diabetic patients [86]. In addition, for the Framingham scale, according to table 3.3.1, we found that if a patient is male, the older he is, the higher the HATT, the higher the risk of cardiovascular disease. This may be because the Framingham scale calculates the score according to the age factor on male subjects with higher scores than on female subjects, even though women have a higher score for total cholesterol and HATT than men. This further emphasizes the importance of the age factor when using this scale.
Blood lipid profile is an important factor in cardiovascular risk assessment for both scales. For the WHO/ISH scale, cholesterol index is the only lipid factor for risk stratification. This is consistent with the results of our study when we found that cardiovascular risk levels increase gradually with cholesterol values. In addition, there are differences in triglyceride and LDL concentrations between risk groups (p < 0.05). For the Framingham scale, we found that triglycerides had an average value that increased gradually from low risk to medium risk, high risk and very high risk; at the same time, HDL-C tended to decrease gradually, the difference was significant (p < 0.05). The study by Ma et al. (2020) emphasized the predictive value of cardiovascular disease of triglyceride index in diabetic patients [58]. Tran Thua Nguyen's study (2021) showed that the HDL-C group that did not meet the target according to the ESC-EASD 2013 recommendations had a higher risk of coronary heart disease than the group that met the target [6]. In general, dyslipidemia plays an important role in the pathogenesis of cardiovascular complications, especially in patients with type 2 diabetes. In addition, the triglyceride index is an index that has a difference between cardiovascular risk levels when considered on both the Framingham and WHO/ISH scales. Therefore, we recommend that there should be more large studies evaluating the role of triglycerides in predicting cardiovascular risk in patients with type 2 diabetes in Vietnam.
4.3. Assessment of agreement between the Framingham and WHO/ISH scores
There was poor agreement between the two scales when considering the 4 risk levels together (k = 0.259; p < 0.001). Differences in predicting cardiovascular risk using different scales have been reported in the world literature. Many studies in the world have noted that the Framingham scale has a higher proportion of high and very high risk levels than the WHO/ISH when examining the same subjects [15, 21, 36, 62, 77]. Mettananda et al. (2020) when simultaneously applying the Framingham and WHO/ISH scales on the Sri Lankan population recorded poor agreement (k = 0.306; p < 0.001). The author calculated that the high-risk group accounted for 36.7% when considering the Framingham scale while for the WHO/ISH scale, this figure was only 9.5% [62]. Similarly, Lingkan et al. (2019) surveyed 265 premenopausal women in Bangladesh and concluded that the agreement between the two scales was very poor (k = 0.13; p = 0.013) [21]. There are many reasons for this problem. First, the Framingham score was built on the white community in the US, when compared with Vietnam, there must be many differences in genes, environment, customs, etc., leading to errors in risk estimates. Specifically, the researchers built the Framingham score using data on the white community in the US during a period when the risk of cardiovascular disease was high here and higher than in Asia [31]. Second, the Framingham score
WHO/ISH score not included
on data
of the research on food security
magic
build database
extrapolation of melon
on the frequency of circulation
cardiovascular risk factors in one region, these charts have not been validated.
demonstrate its accuracy and validity in prospective studies. Many experts
The authors argue that its value needs further verification [ 29].
Several studies evaluating the Framingham score in Asians have shown that this score overestimates the risk of cardiovascular disease. Ettiappan (2020) compared these two scores in 51 Indian women with suspected coronary artery disease who underwent myocardial perfusion imaging and found that the WHO/ISH score provided a higher level of agreement with the results of exercise myocardial perfusion imaging than the Framingham score, thereby concluding that the WHO/ISH score is a better predictor of cardiovascular disease risk in this patient group.