Data. The interview subjects are people living in the conservation area. The topic selected 30 well-off households, 30 average households and 30 poor households to conduct interviews. The total number of households surveyed was 90. For staff, 15 people were surveyed.
Investigation and direct observation on established transects: Residential areas can affect the habitats of the reserve in many ways: using resources, grazing livestock... The level of impact is often different in different areas, the level is higher for areas closer to residential areas, along roads and trails. The topic uses the method of investigating the impact of people on the reserve according to Cao Thi Ly et al. (2002) [84].
To assess the impact of people on the conservation area, the project established 3 lines/1 commune (15 lines in total). The survey line started from the last house in the village, every 500m on the survey line, data was recorded to quickly assess human impact according to the form in the appendix.
+ Tree cutting: ratio or quantity of trees (number of cut stumps), woody shrubs cut or branches cut.
+ Traces of livestock: quantity or frequency of encountering livestock feces.
+ Clearcutting: size of burned area, forest condition, extent of damage
+ Exploitation of non-timber forest products: ornamental plants, wild vegetables, medicinal plants,...
The topic then assessed the severity of the impact by scoring on a scale from 0 (no impact) to 3 (greatest impact).
0: No impact
1: Low impact, intermittent
2: High impact, no major damage yet
3: Multiple impacts, causing great damage and continuously over a long period of time
Calculate the total “impact score” for each transect for each factor. Calculate the average value of the data for each distance from all transects of a commune, and sum the overall data for all communes in the reserve.
Based on the analysis of impacts, to develop appropriate solutions to minimize those impacts.
3.2.4. Data processing method
Using mathematical statistical methods in forestry to process computer data with Excel 7.0 software.
3.2.4.1. Identify forest plant communities
Applying the UNESCO classification scale (1973) was applied by Phan Ke Loc to Vietnam (1985) [79], the basic criteria of this classification system are
structure, appearance. The highest level of classification of this system is the family class, the lowest level is below the subfamily (below the subfamily).
According to the UNESCO classification scale (1973), our country's vegetation has 4 ecosystem classes, of which 2 ecosystem classes are related to forests: dense forests and sparse forests. Each ecosystem class is divided into sub-classes, each sub-class is divided into ecosystem groups and then ecosystems. Each ecosystem is divided into sub-ecosystems and below that is the complex.
Based on this classification system, the project has determined the vegetation system in Than Sa - Phuong Hoang Nature Reserve.
3.2.4.2. Assessment of woody plant diversity
* Diversity in classification: According to Nguyen Nghia Thin (1997):
o Statistics and evaluation of species, genus, and family composition of phyla from low to high and calculate percentages.
o Calculate the diversity index at the family level (average number of species in a family) and genus level (average number of species in a genus).
o Assess the diversity of families and genera: statistics of the 10 families and 10 genera with the richest species, representing the flora.
* Assess the threat level of species
In order to have measures to protect species, in addition to the statistics of the entire species composition of the research area, it is necessary to assess the threat levels of species in that flora to have priority policies and effective protection measures. From the compiled list of plants, check the name of each species According to IUCN Red List of Threatened species, 2013 [183], Vietnam Red Book, Plants section (2007) [11], Decree No. 32/2006/ND-CP [25], CITES Convention, 2010 [16].
Building distribution maps and databases of high conservation value timber species:
Using documents on plants such as: Vietnamese forest trees, Vietnam Red Book, 2007, IUCN Red List, 2013, Decree 32/2006/ND-CP, Vietnamese and Lao forest trees by Hoang Van Sam et al., 2004 [178]... as well as documents searched on websites such as: www.vfu.edu.vn , www.botany.vn , www.ipni.org ,
…In addition, combined with field surveys to describe the identification characteristics, biological characteristics and conservation status of each rare tree species in the research area.
Build a distribution map based on GPS positioning data during field surveys, then use Mapinfor software to process the data and print the map.
* Diversity of geographical and plant factors:
The topic has determined the phytogeographic factors of the research area based on the scale of dividing geographical factors according to Nguyen Nghia Thin, 2008 [137]. Based on the document List of Vietnamese plant species [8, 156]. Then, the spectrum of phytogeographic factors was built. Details are presented in Appendix 07.
* Diversity in usage value
Statistics of valuable woody plant species from the List of woody plants of Than Sa - Phuong Hoang Nature Reserve based on the following specialized documents: Vietnamese medicinal plants and medicinal herbs [81], Dictionary of Vietnamese medicinal plants [23], Vietnamese timber resources [58], Essential oil plant resources in Vietnam [87], 1900 useful plants [83],... In addition to document search, the topic also uses interview methods about medicinal plants, food plants,... The method of assessing the value of woody plant resources is presented in the table below:
Table 3.1: Use value of woody plant species
Uses
Symbol | |
Tree for wood | W |
Medicinal plants | M |
Edible or livestock plants | F |
Ornamental plants | O |
Essential oil plants | E |
Oil tree | Oil |
Tree for resin, tannin | Sap |
Poisonous plants | P |
Plants with other uses (dyeing, fiber, soil improvement, weaving...) | U |
Maybe you are interested!
-
 Research on the diversity of woody plants in Pac Bo special-use forest area, Ha Quang district, Cao Bang province - 1
 -
 Growth Parameters of Plants in Strip No. 1 Growth Measurement Chart of Seedlings in Strip No. 1
 -
 Classification of Wood Processing Enterprises by Economic Sector
 -
 Current Status of Implementation of Export Risk Management Principles of Truong Thanh Wood Industry Group Joint Stock Company.
 -
 Distribution of Families, Genus, and Species of Medicinal Plants in Pine Plantations at Kvnc

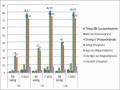
* Diversity of life forms
Life form reflects the ecological nature of the flora as well as of each ecosystem. Each ecosystem is created by species in relation to the ecological factors of that habitat. It is expressed on each individual species and those species gather to form separate communities reflecting the habitat there. The most important basis for arranging those groups of life forms is to see the difficult period for life (due to cold or dry or both) in which life form the species exists. After having made statistics based on the classification scale of Raunkiaer (1934) [196] and applied to the specific conditions of Vietnam. The topic has determined the life forms of plants with buds on woody stems in the research area into the following groups:
Table 3.2: Classification scale of woody plant life forms in the study area according to Raunkiaer's method (1934)
Life form
Symbol | |
Large shoots: are trees over 25m tall | Mg |
Medium shoots: tree height 8 - 25m | Me |
Small shoots: tree height 2 - 8m | Eye |
Dwarf shoots: shrub | Na |
Shoots on woody climbing soil over 25cm high | LP |
Woody ground shoots live parasitic - semi-parasitic | Pp |
3.2.4.3. Method for determining woody plant diversity indices
Refer to some studies on quantitative analysis of biodiversity by Ngo Kim Khoi (2002) [66], Pham Thi Kim Thoa (2012) [139], Le Quoc Huy (2005) [62]. The topic uses some of the following indexes to analyze the species diversity of woody flora in Than Sa - Phuong Hoang Nature Reserve, Thai Nguyen province.
Importance Value Index (IVI):
The IVI index of each species is calculated using the following formula:
IVI = RD + RF + RBA (Mishra, 1968) [192] (3-1)
In which: RD is relative density, RF is relative frequency of occurrence and RBA is the total relative stem cross-sectional area of each species. The IVI index of a species reaches a maximum value of 300% when the research site has only that tree species.
Density (N):
Total number of individuals of the study species present in all sample plots (3-2)
Density =
Total number of study sample cells
Relative Density (RD):
Density of the study species
Relative Density (RD) (%) = x 100 (3-3) Total Density of All Species
Frequency (F):
Number of sample plots with species present
F (%) = x 100 (3-4)
Total number of study sample cells
Relative Frequency (RF):
Frequency of occurrence of a research species
RF(%) = x 100 (3-5)
Total frequency of occurrence of all species
3.1416 x 2
Cross-sectional area of tree trunk (BA) = r 2 = Where d is diameter
4 (3-6)
Cross-sectional area of the species
RBA (%) = x 100 (3-7)
Total cross-sectional area of all species
- Simpson's diversity index (1949) [201]
s Ni 2
Cd = N
(3-8)
i 1
In there:
Cd = Dominance index or Simpson index, Ni = number of individuals of species i;
N = total number of individuals of all species
S
- Shannon-Wiener coefficient H' = - Pi * ln ( pi )
i 1
[199] (3-9)
In there:
S is the total number of species and N is the total number of individuals surveyed. Pi is the relative abundance of species i (Pi = ni/N)
- Mixed species ratio:
Hl S
N
(3-10)
S is the total number of species and N is the total number of individuals surveyed.
- Similarity index (Index of similarity or Sorensen's Index) - SI [62]
SI
2 C
A B
(3-11)
In which C: Number of species appearing in both populations A and B
A = Number of species in population A. B = Number of species in population B
- Renyi entropy index: [170]
i
ln sp
H i 1
1
(3-12)
Where s is the total number of species, pi is the relative abundance of the ith species in the OTC, is a scale parameter that can vary from 0-∞.
In this thesis, we use this coefficient to analyze the diversity of woody plants in limestone mountains, to analyze the variation of H values in the cases of = 0; 0.25; 0.5; 1; 2; 3; 4; 5; 6; 7; 8, 9 and ∞ and draw graphs describing the diversity of forest vegetation on limestone mountains.
3.2.4.4. Method of studying regeneration characteristics
a. Composition of regenerated trees
The composition ratio of each species is calculated according to the formula:
n %
now
m
now
i 1
.100
(3-12)
If: ni 5% then that species is included in the composition formula.
If n i < 5% then that species is not included in the composition formula.
b. Density of regenerated trees
Is an indicator representing the number of regenerated trees per unit area, determined by the following formula:
N / ha 10,000 n
Phone number
(3-13)
where S dt is the total area of the surveyed regeneration plots (m 2 ) and n is the number of surveyed regenerated trees.
c. Quality of regenerated trees
Research on regeneration at good and medium quality levels aims to generally assess the ongoing regeneration situation in the study area and the future development of the forest.
Chapter 4
RESEARCH RESULTS AND DISCUSSION
4.1. Characteristics of vegetation layers in Than Sa - Phuong Hoang nature reserve according to UNESCO, 1973
Up to now, in the world as well as in the country, there have been many research projects on vegetation classification. However, the classification systems that have been implemented are all local in nature, so it is difficult to apply to other regions. To overcome this situation, UNESCO (1973) published the "International Vegetation Classification and Vegetation Mapping" to provide a general classification framework for the most important vegetation types that can be shown on maps at a scale of 1:1 million and smaller. The classification includes all types of natural vegetation, regardless of whether they are primary, secondary, temporary or relatively stable, but based on structural appearance and then ecological, geographical, topographic, climatic and soil factors. This classification table has been used by a number of authors (Phan Ke Loc, 1985; Nguyen Nghia Thin, 1997; Le Dong Tan, 2000)... The thesis uses this classification table to classify the vegetation of Than Sa - Phuong Hoang Nature Reserve. The system of the classification table is arranged as follows:
I. Class of the community.
IA Classification of populations.
IA1. Population group. IA1a. Population.
IA1a (1). Subpopulation.
In the study area, the forest vegetation has many different subsystems, not clearly distinguished by boundaries due to human impact, they are distributed intertwined and mainly in the Strictly Protected Zone and the Ecological Restoration Zone. Than Sa - Phuong Hoang Nature Reserve consists of the following layers of systems and subsystems:
I. Closed forest ecosystem layer
The closed forest ecosystem has an area of 16,987.9 hectares, including the following ecosystems:
IA Classification of evergreen forest ecosystems
IA1. Group of evergreen closed seasonal rain forest ecosystems
IA1a. Lowland (<500m) evergreen closed monsoon forest ecosystem
This ecosystem is distributed on the soil mountains in the communes of Nghinh Tuong, Vu Chan and Than Sa with an area of 4,131.4 hectares. According to the geographical location, the climate and soil can be
It is confirmed that at this altitude, the forest has a very diverse composition and structure, rich in reserves and rich in species composition. However, due to impacts, the primary forest no longer exists, replaced by secondary forests that have been impacted by firewood exploitation or restoration after slash-and-burn farming.
IA1a (1). Subcommunity of evergreen closed monsoon broadleaf forest naturally recovering after exploitation on dirt mountains.
Although the forest canopy structure has been broken and valuable timber species have been exploited, the forest's characteristics are still preserved. The forest has a 5-layer structure, including 3 tree layers, 1 shrub layer and 1 fresh carpet layer.
Layer A1 is 25-30m high, including species such as Vatica chevalieri , Castanopsis chinensis , Canarium album , Gironniera subaequalis , Choerospondias axillaris , Ficus altissima ,...
Layer A2 is 20-25m high and includes Madhuca pasquieri , Vatica chevalieri , Artocarpus styracifolius , Castanopsis chinensis , Bischofia javanica , Machilus odoratissima , Endospermun chinense , Canarium album , Dipterocarpus retusus , etc.
Layer A3 is 15-20m high and includes Nephelium cuspidatum , Polyanthia sp., Machilus bonii, Phoebe lanceolata , Syzygium levinei , Dracontomelon duperreanum , Vatica chevalieri , Garcinia fagracoides , Castanopsis fissoides , Canarium album , Antiaris toxicaria ,....
Shrub layer: Species: Adina pilulifera , Psychotria rubra , Randia spinosa , Uncaria homomalla , Clausena excavate , Euodia lepta , Zanthoxylum nitidum , Sterculia tonkinensis , Pandanus tonkinensis , Ardisia elegans , Maesa perlarius , Maesa tomentella , Blastus borneensis , Melastoma affine , Aralia armata , Brassaiopsis glomerulata , Trevesia palmate .
Fresh carpet or thick layer of grass, 2-3m high, including species: Alpinia blepharocalyx , Amomum xanthioides , Barleria cristata , Amorphophalus tonkinensis , Colocasia gigantea , Rhynchospora corymbosa , Scirpus lateriflorus , Adiantum caudatum , Asplenium nidus , Christella molliuscula , Diplazium esculentum , etc.