Furniture made of metal, plastic or other materials still accounts for a very small proportion of Vietnam's total furniture exports to the United States, although demand for these items in the United States is also very large.
Table 2.6: Countries exporting wooden furniture mainly to the United States
Unit: Million USD
2003 | 2004 | 2005 | 2006 | March 2006 | March 2007 | Comparison (Q1/07- Quarter 1/06) | |
China | 8,749 | 10,910 | 13,187 | 15,171 | 3,666 | 4,157 | 13.4% |
Canada | 4,551 | 5,007 | 5,126 | 5,105 | 1,255 | 1,137 | -9.4% |
Mexico | 4,274 | 4,316 | 4,297 | 4,465 | 1,148 | 1,135 | -1.1% |
Italy | 1,362 | 1,229 | 1,088 | 944 | 219 | 238 | 8.6% |
Vietnam | 187 | 386 | 692 | 895 | 176 | 268 | 52.3% |
Taiwan | 749 | 753 | 716 | 688 | 164 | 161 | -1.8% |
Indonesia | 524 | 543 | 609 | 627 | 180 | 172 | -4.7% |
Thailand | 413 | 493 | 456 | 405 | 109 | 82 | -24.7% |
Virtue | 289 | 330 | 341 | 378 | 83 | 92 | 10.8% |
Other countries | 794 | 836 | 786 | 777 | 800 | 770 | 3.8% |
Total | 24,355 | 27,741 | 30,635 | 32,782 | 8,001 | 8,413 | 5.1% |
Maybe you are interested!
-

 Assessment of the World Trade Organization's Dispute Settlement Mechanism for Developing Countries
 -
 Prospects for Trade Cooperation Between Vietnam and Gcc Countries
 -
 Trade cooperation between Vietnam and some countries of the Gulf Cooperation Council - 1
 -
 Settlement of Disputes of Developing Countries under the Dispute Settlement Mechanism of the World Trade Organization
 -
 Experience of some countries in applying information technology to develop retail banking activities and lessons for Vietnam Joint Stock Commercial Bank for Industry and Trade - 12
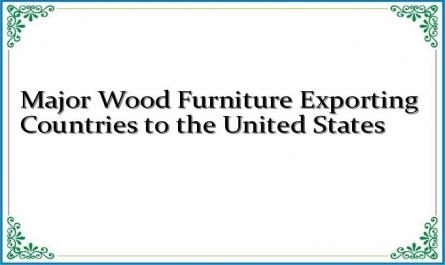
Calculations based on US Department of Commerce (USITC) sources
Compare with China
China is the largest exporter of furniture to the United States. In 2005, China's furniture exports to the United States were valued at $11.7 billion, up $2 billion from 2004, and accounted for 79 percent of the increase in the value of U.S. furniture imports during the year. In 2005, China accounted for 48 percent of U.S. furniture imports, up from 45 percent in 2004.
Imports from China increased due to: (1) low production costs while quality is increasingly improved; (2) Many foreign companies, including some leading US companies, have moved production to China.
The country took advantage of cheap labor prices, leading to an increase in its supply capacity;
(3) Some U.S. furniture manufacturers also import some labor-intensive furniture components from China to assemble into their U.S.-made products; (4) low transportation costs; (5) increasingly close relationships between manufacturers in China and U.S. retailers.
1.2.5. Some other items
Agricultural products, processed foods
- Coffee: The United States is the world's largest coffee consumer and importer. The US's coffee import demand is relatively stable at over 1 million tons per year, but due to fluctuations in world coffee prices, import values also fluctuate. Import values in 2005 and 2006 were 3.45 billion and 3.67 billion USD, respectively. About 70% of coffee imported into the United States is Arabica coffee (mainly from Colombia, Brazil, Mexico...) and the remaining 30% is Robusta coffee (mainly from Vietnam and Indonesia).
If the price and quality of Vietnamese coffee are competitive, the export of this item to the United States could increase by 10% per year, reaching about 350 million USD in 2010. However, the world coffee market often has unusual fluctuations, and the output and quality of Vietnamese coffee are often affected by weather conditions. These factors can affect Vietnam's coffee exports to the United States. Furthermore, the US market often consumes Arabica coffee, while Vietnam produces Robusta coffee on a large scale, so Vietnam needs to adjust its coffee growing program appropriately to meet the needs of major coffee importers in the world, including the United States.
- Pepper : All pepper consumed in the United States is imported. In the United States, pepper accounts for about 34% of the transaction value of all spices. The demand for pepper imports in the United States increases steadily every year. In
In 2002, the United States imported about 146 thousand tons, an increase of about 17.5% compared to 2001. Pepper imported into the United States includes black and white pepper, whole or ground, of which pepper accounts for about 40-50% of imports. Mexico, India, Indonesia, China, Brazil and Vietnam are the main exporting countries, accounting for nearly 80% of the US pepper import market.
- Tea : Vietnam has the ability to supply large quantities but the import demand of the United States is not large (each year the United States only imports about 95 - 100 tons with a value of about 160 - 170 million USD). Although the demand for tea in the United States is increasing, mainly due to scientific studies showing that tea has the effect of preventing cancer, our tea is still having many difficulties penetrating this market because it cannot compete with tea from other major exporting countries that have been present in this market for a long time such as Argentina, China, India, Sri Lanka....
- Processed food products: Vietnam's general supply capacity is still very limited in quantity. The production scale and supply capacity of each factory are even more limited, so they have not attracted the attention of large US importers, distributors and retailers. Perhaps the brightest prospect for Vietnamese businesses in this field is to penetrate the Vietnamese community in the United States. Scattered in many places in the United States, there are retail supermarkets (usually small scale) selling food products serving Asians in general and Vietnamese people in particular. There are many items that Vietnamese people in the United States buy and consume every day that are imported from other countries such as Thailand, China, Hong Kong, Malaysia, etc. Imported goods from Vietnam are also available, but still very limited. This is also a good opportunity for Vietnamese businesses to increase their market share in these supermarkets.
Handicrafts
Except for garden ceramics and indoor decorative ceramics such as flower pots, statues, animal figures, fountains, clock cases, etc. (which are products with high and increasing demand in the US market, and Vietnam is able to compete well in this market), other Vietnamese handicraft products are currently facing many difficulties in penetrating the US market.
Plastic goods:
Currently, domestically, there are still many different opinions when it comes to developing plastic products into a key export item after wood products. The reality of exporting this item also shows that the competitiveness of Vietnamese plastic products in the US market is still weak and it is very difficult to become a significant large export item in this market, at least in the next few years, the demand for importing plastic and plastic products of the US is very large. According to US statistics, each year this country imports nearly 23 billion plastic products (including plastic raw materials, industrial plastic products, consumer plastic products...). The main exporting countries to the US of the 3 groups of products mentioned above are China, Canada, Hong Kong, Taiwan, Mexico, Indonesia, Malaysia.
Like the garment, footwear, and woodworking industries, the plastics industry is heavily dependent on imported raw materials. However, the plastics industry requires more capital investment in machinery and equipment and less labor than the other three industries. Therefore, if it only relies on domestic capital, it will be difficult for the plastics industry to develop as quickly as the other three industries. The important issue for developing this industry is to improve the investment environment and do a good job of investment promotion, before focusing on trade promotion activities. If the supply source is not significantly improved, efforts to promote exports will also achieve very limited results, not commensurate with the resources spent.
The plastics industry is a toxic industry. Therefore, this industry always tends to shift production from developed countries to less developed countries. If the investment environment in Vietnam is attractive, Vietnam can welcome this shift. However, environmental protection is also an issue that needs due attention when developing this industry.
2. Current status of Vietnam importing goods from the United States
2.1. Import turnover over the years (2000-Q3/2007)
As in previous years, imports from the United States to Vietnam are mainly goods that Vietnam is not capable of producing or has a low competitive advantage, and most of these goods are imported to serve Vietnam's economic development policies and orientations. By the end of 2004, the number of imports from the United States to Vietnam was very diverse, including more than 96 groups of goods.
In 2006, US exports to Vietnam reached 1.1 billion USD. Vietnam's import trend from the US is mainly high-tech equipment and spare parts, although very expensive but cannot be purchased from other countries, or raw materials and accessories for processing export goods.
First of all, to visually perceive the fluctuations in Vietnam's import turnover from the United States over the past time, we observe the following chart:
Chart 2.4: Vietnam's import turnover of goods from the United States in the period 2000-2006
1600
1400
1200
1000
800
600
400
200
0
2000 2001 2002 2003 2004 2005 2006
Unit: Million USD
NK
Source: General Statistics Office
Looking at the chart, it can be seen that in the period from 2000-2002, the export turnover from the United States to Vietnam was relatively low, averaging about 470 million USD. By 2003, the export turnover had a breakthrough step up to 1.3 billion USD, an increase of 744 million compared to the previous year (an increase of 129% compared to 2002). After that, this export level changed insignificantly in the period from 2004-2006, averaging about 1152 million USD.
Table 2.7: Comparison of import turnover from the United States (August 2006 - August 2007)
TOTAL
August 2006 | August 2007 | Growth rate August 2007 - August 2006 | |
1,000USD | |||
TOTAL | 625,868 | 1,043,707 | 66.8% |
Source: US Department of Commerce
In the first 8 months of 2007 alone, after Vietnam joined the WTO and was granted PNTR, imports from the United States increased significantly, from 625 million USD in the first 8 months of 2006 to 1.043 billion USD in 2007 (66.8%).
Chart 2.5: Import turnover from the United States (August 2006 - August 2007)
Unit: million USD
2006
2007
170
150
130
110
90
70
50
Jan Feb Mar Apr May Jun
Jul Aug
Source: United States Department of Commerce (USITC)
Looking at the chart above, we can clearly see the growth rate of Vietnamese goods imported from the United States in the first eight months of 2007 compared to the same period in 2006. Obviously, after Vietnam joined the WTO and was granted PNTR, this growth rate has become increasingly higher.
2.2.Main imported goods
Here are 13 items that Vietnam mainly imports from the United States:
Table 2.8: Main items imported from the United States to Vietnam
Unit: million USD
Product Name
Total US Exports | Vietnam's share in total US exports (%) | US exports to Vietnam | Difference 06/05 (%) | ||||||
2004 | 2005 | 2006 | 2004 | 2005 | 2006 | 2005 | 2006 | ||
Total | 817,935 | 904,379 | 1,037,142 | 0.19 | 0.21 | 0.11 | 1919.8 | 1,100 | -42.7 |
Nuclear reactors, heating boilers, machinery and equipment | 149,068 | 116,423 | 182,034 | 0.09 | 0.098 | 0.098 | 115.15 | 174.55 | -5.5 |
Plastic and Plastic products | 33,705 | 38,096 | 42,712 | 0.14 | 0.22 | 0.22 | 84.44 | 95.75 | 56.9 |
Machines | 124,803 | 129,402 | 145,832 | 0.00 | 0.05 | 0.06 | 72.16 | 87.61 | 16.03 |
electrical equipment and accessories
Airplane and their parts | 42,122 | 49,823 | 66,753 | 1.63 | 0.69 | 0.13 | 346.12 | 87.61 | -47.4 |
Type and the wood products | 5,867 | 6,092 | 6,537 | 0.49 | 0.71 | 0.67 | 43.65 | 65.34 | 92.1 |
Measuring/testing tools investigate/analyze | 51,160 | 55,265 | 61,891 | 0.08 | 0.02 | 0.11 | 57.48 | 65.01 | -9.4 |
Vehicles of all kinds, other than railway or tramway rolling stock, spare parts | 73,308 | 83,160 | 92,702 | 0.03 | 0.05 | 0.05 | 41.37 | 48.79 | 48.6 |
Cotton | 6,371 | 5.902 | 6,465 | 0.02 | 0.83 | 0.74 | 48.8 | 47.62 | 3866.7 |
Shoes | 650 | 726 | 829 | 3.77 | 4.2 | 4.1 | 31.14 | 34.23 | 7.5 |
Other chemical products | 30,367 | 30,462 | 33,654 | 0.1 | 0.58 | 0.07 | 10.57 | 22.14 | 21.6 |
Rawhide and leather | 2,785 | 2,719 | 2,875 | 0.25 | 0.58 | 0.76 | 16.01 | 21.72 | 107.3 |
Iron and steel | 8,917 | 11,341 | 12,621 | 0.06 | 0.05 | 0.14 | 5.3 | 17.67 | 20.46 |
Paper and cardboard paper | 11,482 | 12,336 | 13,216 | 0.16 | 0.13 | 0.13 | 16.7 | 17.44 | 18.78 |
Source: Calculation based on data from the United States International Trade Commission
(USITC)
Overall, the imported goods from the United States to Vietnam can be divided into three large groups based on import turnover. The group of goods with a turnover of over 50 million USD includes aircraft and accessories; nuclear reactors, heating boilers, machinery and mechanical equipment; iron and steel; cotton; plastics and electrical machinery and equipment. The group of goods with a turnover of 10 to 50 million USD includes more than 34 groups of goods such as wood and wood products; measuring and testing instruments; vehicles of all kinds except railway or tram cars; footwear; milk and dairy products; paper and paperboard, etc. The remaining group of goods includes about 58 groups of goods with a turnover of less than 10 million USD.
The group of goods with the highest proportion is aircraft and their parts with 33.5% of the total import value. In 2003, this group of goods increased sharply by 805.06% (from 79 million USD in 2002 to 715.6 million USD in 2003) (due to the import of 2 Boeing 777 aircraft worth 362 million USD). ... the group of goods increased sharply by 805.06% (from 79 million USD in 2002 to 715.6 million USD in 2003).