Table 4.13 presents the regression results of the empirical research model with PLS, FEM, REM and REM-RSE. From the regression results of the REM-RSE model, the H-Statistic value of the Vietnamese commercial banking market is determined as H -TTNHVN = 0.543 (0.343 + 0.134 + 0.066). Thus, 0 < H-Statistic < 1, according to the Panzar - Rosse model, this is a case of monopolistic competition. All three input price variables, namely input price of mobilized capital ( w 1 ), input price of employees (w 2 ) and input price of physical capital (w 3 ) have positive and statistically significant regression coefficients. In which, the regression coefficient of the input price of mobilized capital is the highest with 0.343, meaning that a 1% change in the input price of mobilized capital will make the bank's income change by 0.343%. Next is the regression coefficient of the input price of employees with 0.134, meaning that a 1% change in the input price of employees will make the bank's income change by 0.134%, and the lowest is the regression coefficient of the input price of physical capital with 0.066, meaning that a 1% change in the input price of physical capital will make the bank's income change by 0.066%.
The H-Statistic value of the SBV group is H -SBV = 0.169 (0 + (-0.051) + 0.22) reflecting the contribution or influence of the SBV group on H -TTNHVN . In which, the regression coefficient of the input price of mobilized capital is 0, meaning that the change in the input price of mobilized capital has almost no impact on the change in the income of the SBV. The regression coefficient of the input price of employees is less than 0 (-0.051) but is not statistically significant, meaning that the input price of employees also does not affect the income of the SBV. The regression coefficient of the input price of physical capital is statistically significant with a regression coefficient value of 0.22, meaning that a 1% change in the input price of physical capital will cause the income of the SBV to change by 0.22%. The regression results reflect that the income of the SBV group is almost unaffected by the input price of mobilized capital, but only depends on physical capital.
The regression coefficient of the common asset size variable ( ln(AS) ) of the domestic and foreign banks has a value of 1.07 and is statistically significant, showing that if the asset size increases by 1%, the bank's income increases by 1.07% and vice versa, when the asset size decreases by 1%, the bank's income decreases by 1.07%. In which, the regression coefficient of the asset size variable of the foreign banks group ( ln(AS)*D ) is also greater than 0 (0.077) and has
statistical significance
Similarly, the regression coefficient of the loan-to-asset ratio variable ( ln(LO) ) of the domestic and foreign banks is 0.02 and is statistically significant, showing that if lending increases by 1%, the bank's income increases by 0.02% and vice versa, when lending decreases by 1%, the bank's income decreases by 0.02%. However, the regression coefficient of the loan-to-asset ratio variable of the foreign banks group ( ln(LO)*D ) is negative, but not statistically significant. This means that the change in the loan-to-asset ratio does not change the income of the foreign banks. This result is consistent with the analysis results of the input price variable of mobilized capital.
4.2.4. Testing hypothesis H1 and discussing research results
To test hypothesis H1 ( Penetration of foreign banks increases the competitiveness of Vietnam's commercial banking market ), the thesis uses F-test for the value of H -foreign banks estimated from Model 3.2 using the REM-RSE method presented in Table 4.13. The results of testing hypothesis H1 are presented in Table 4.14.
Table 4.14: Results of testing hypothesis H1
H-Statistic | Regression coefficient | Value |
H -TTNHVN | ( β 1 + β 2 + β 3 ) | 0.543 |
H -NHNNg | ( β 4 + β 5 + β 6 ) | 0.169 |
F-test: H -NHNNg = 0 | 4.43** (0.035) |
Maybe you are interested!
-
![Mobile Phone Usage in Hanoi Inner City Area
zt2i3t4l5ee
zt2a3gsconsumer,consumption,consumer behavior,marketing,mobile marketing
zt2a3ge
zc2o3n4t5e6n7ts
- Test the relationship between demographic variables and consumer behavior for Mobile Marketing activities
The analysis method used is the Chi-square test (χ2), with statistical hypotheses H0 and H1 and significance level α = 0.05. In case the P index (p-value) or Sig. index in SPSS has a value less than or equal to the significance level α, the hypothesis H0 is rejected and vice versa. With this testing procedure, the study can evaluate the difference in behavioral trends between demographic groups.
CHAPTER 4
RESEARCH RESULTS
During two months, 1,100 survey questionnaires were distributed to mobile phone users in the inner city of Hanoi using various methods such as direct interviews, sending via email or using questionnaires designed on the Internet. At the end of the survey, after checking and eliminating erroneous questionnaires, the study collected 858 complete questionnaires, equivalent to a rate of about 78%. In addition, the research subjects of the thesis are only people who are using mobile phones, so people who do not use mobile phones are not within the scope of the thesis, therefore, the questionnaires with the option of not using mobile phones were excluded from the scope of analysis. The number of suitable survey questionnaires included in the statistical analysis was 835.
4.1 Demographic characteristics of the sample
The structure of the survey sample is divided and statistically analyzed according to criteria such as gender, age, occupation, education level and personal income. (Detailed statistical table in Appendix 6)
- Gender structure: Of the 835 completed questionnaires, 49.8% of respondents were male, equivalent to 416 people, and 50.2% were female, equivalent to 419 people. The survey results of the study are completely consistent with the gender ratio in the population structure of Vietnam in general and Hanoi in particular (Male/Female: 49/51).
- Age structure: 36.6% of respondents are <23 years old, equivalent to 306 people. People from 23-34 years old
accounting for the highest proportion: 44.8% equivalent to 374 people, people aged 35-45 and >45 are 70 and 85 people equivalent to 8.4% and 10.2% respectively. Looking at the results of this survey, we can see that the young people - youth account for a large proportion of the total number of people participating in the survey. Meanwhile, the middle-aged people including two age groups of 35 - 45 and >45 have a low rate of participation in the survey. This is completely consistent with the reality when Mobile Marketing is identified as a Marketing service aimed at young people (people under 35 years old).
- Structure by educational level: among 835 valid responses, 541 respondents had university degrees, accounting for the highest proportion of ~ 75%, 102 had secondary school degrees, ~ 13.1%, and 93 had post-graduate degrees, ~ 11.9%.
- Occupational structure: office workers and civil servants are the group with the highest rate of participation with 39.4%, followed by students with 36.6%. Self-employed people account for 12%, retired housewives are 7.8% and other occupational groups account for 4.2%. The survey results show that the student group has the same rate as the group aged <23 at 36.6%. This shows the accuracy of the survey data. In addition, the survey results distributed by occupational criteria have a rate almost similar to the sample division rate in chapter 3. Therefore, it can be concluded that the survey data is suitable for use in analysis activities.
- Income structure: the group with income from 3 to 5 million has the highest rate with 39% of the total number of respondents. This is consistent with the income structure of Hanoi people and corresponds to the average income of the group of civil servants and office workers. Those
People with no income account for 23%, income under 3 million VND accounts for 13% and income over 5 million VND accounts for 25%.
4.2 Mobile phone usage in Hanoi inner city area
According to the survey results, most respondents said they had used the phone for more than 1 year, specifically: 68.4% used mobile phones from 4 to 10 years, 23.2% used from 1 to 3 years, 7.8% used for more than 10 years. Those who used mobile phones for less than 1 year accounted for only a very small proportion of ~ 0.6%. (Table 4.1)
Table 4.1: Time spent using mobile phones
Frequency
Ratio (%)
Valid Percentage
Cumulative Percentage
Alid
<1 year
5
.6
.6
.6
1-3 years
194
23.2
23.2
23.8
4-10 years
571
68.4
68.4
92.2
>10 years
65
7.8
7.8
100.0
Total
835
100.0
100.0
The survey indexes on the time of using mobile phones of consumers in the inner city of Hanoi are very impressive for a developing country like Vietnam and also prove that Vietnamese consumers have a lot of experience using this high-tech device. Moreover, with the majority of consumers surveyed having a relatively long time of use (4-10 years), it partly proves that mobile phones have become an important and essential item in peoples daily lives.
When asked about the mobile phone network they are using, 31% of respondents said they are using the network of Vietel company, 29% use the network of
of Mobifone company, 27% use Vinaphone companys network and 13% use networks of other providers such as E-VN telecom, S-fone, Beeline, Vietnammobile. (Figure 4.1).
Figure 4.1: Mobile phone network in use
Compared with the announced market share of mobile telecommunications service providers in Vietnam (Vietel: 36%, Mobifone: 29%, Vinaphone: 28%, the remaining networks: 7%), we see that the survey results do not have many differences. However, the statistics show that there is a difference in the market share of other networks because the Hanoi market is one of the two main markets of small networks, so their market share in this area will certainly be higher than that of the whole country.
According to a report by NielsenMobile (2009) [8], the number of prepaid mobile phone subscribers in Hanoi accounts for 95% of the total number of subscribers, however, the results of this survey show that the percentage of prepaid subscribers has decreased by more than 20%, only at 70.8%. On the contrary, the number of postpaid subscribers tends to increase from 5% in 2009 to 19.2%. Those who are simultaneously using both types of subscriptions account for 10%. (Table 4.2).
Table 4.2: Types of mobile phone subscribers
Frequency
Ratio (%)
Valid Percentage
Cumulative Percentage
Valid
Prepay
591
70.8
70.8
70.8
Pay later
160
19.2
19.2
89.9
Both of the above
84
10.1
10.1
100.0
Total
835
100.0
100.0
The above figures show the change in the psychology and consumption habits of Vietnamese consumers towards mobile telecommunications services, when the use of prepaid subscriptions and junk SIMs is replaced by the use of two types of subscriptions for different purposes and needs or switching to postpaid subscriptions to enjoy better customer care services.
In addition, the majority of respondents have an average spending level for mobile phone services from 100 to 300 thousand VND (406 ~ 48.6% of total respondents). The high spending level (> 500 thousand VND) is the spending level with the lowest number of people with only 8.4%, on the contrary, the low spending level (under 100 thousand VND) accounts for the second highest proportion among the groups of respondents with 25.4%. People with low spending levels mainly fall into the group of students and retirees/housewives - those who have little need to use or mainly use promotional SIM cards. (Table 4.3).
Table 4.3: Spending on mobile phone charges
Frequency
Ratio (%)
Valid Percentage
Cumulative Percentage
Valid
<100,000
212
25.4
25.4
25.4
100-300,000
406
48.6
48.6
74.0
300,000-500,000
147
17.6
17.6
91.6
>500,000
70
8.4
8.4
100.0
Total
835
100.0
100.0
The statistics in Table 4.3 are similar to the percentages in the NielsenMobile survey results (2009) with 73% of mobile phone users having medium spending levels and only 13% having high spending levels.
The survey results also showed that up to 31% ~ nearly one-third of respondents said they sent more than 10 SMS messages/day, meaning that on average they sent 1 SMS message for every working hour. Those with an average SMS message volume (from 3 to 10 messages/day) accounted for 51.1% and those with a low SMS message volume (less than 3 messages/day) accounted for 17%. (Table 4.4)
Table 4.4: Number of SMS messages sent per day
Frequency
Ratio (%)
Valid Percentage
Cumulative Percentage
Valid
<3 news
142
17.0
17.0
17.0
3-10 news
427
51.1
51.1
68.1
>10 news
266
31.9
31.9
100.0
Total
835
100.0
100.0
Similar to sending messages, those with an average message receiving rate (from 3-10 messages/day) accounted for the highest percentage of ~ 55%, followed by those with a high number of messages (over 10 messages/day) ~ 24% and those with a low number of messages received daily (under 3 messages/day) remained at the bottom with 21%. (Table 4.5)
Table 4.5: Number of SMS messages received per day
Frequency
Ratio (%)
Valid Percentage
Cumulative Percentage
Valid
<3 news
175
21.0
21.0
21.0
3-10 news
436
55.0
55.0
76.0
>10 news
197
24.0
24.0
100.0
Total
835
100.0
100.0
When comparing the data of the two result tables 4.4 and 4.5, we can see the reasonableness between the ratio of the number of messages sent and the number of messages received daily by the interview participants.
4.3 Current status of SMS advertising and Mobile Marketing
According to the interview results, in the 3 months from the time of the survey and before, 94% of respondents, equivalent to 785 people, said they received advertising messages, while only a very small percentage of 6% (only 50 people) did not receive advertising messages (Table 4.6).
Table 4.6: Percentage of people receiving advertising messages in the last 3 months
Frequency
Ratio (%)
Valid Percentage
Cumulative Percentage
Valid
Have
785
94.0
94.0
94.0
Are not
50
6.0
6.0
100.0
Total
835
100.0
100.0
The results of Table 4.6 show that consumers in the inner city of Hanoi are very familiar with advertising messages. This result is also the basis for assessing the knowledge, experience and understanding of the respondents in the interview. This is also one of the important factors determining the accuracy of the survey results.
In addition, most respondents said they had received promotional messages, but only 24% of them had ever taken the action of registering to receive promotional messages, while 76% of the remaining respondents did not register to receive promotional messages but still received promotional messages every day. This is the first sign indicating the weaknesses and shortcomings of lax management of this activity in Vietnam. (Table 4.7)
div.maincontent .s1 { color: black; font-family:Times New Roman, serif; font-style: italic; font-weight: normal; text-decoration: none; font-size: 14pt; } div.maincontent .s2 { color: black; font-family:Times New Roman, serif; font-style: normal; font-weight: bold; text-decoration: none; font-size: 14pt; } div.maincontent .s3 { color: black; font-family:Times New Roman, serif; font-style: normal; font-weight: bold; text-decoration: none; font-size: 14pt; } div.maincontent .p { color: black; font-family:Times New Roman, serif; font-style: normal; font-weight: normal; text-decoration: none; font-size: 14pt; margin:0pt; } div.maincontent p { color: black; font-family:Times New Roman, serif; font-style: normal; font-weight: normal; text-decoration: none; font-size: 14pt; margin:0pt; } div.maincontent .s4 { color: black; font-family:Times New Roman, serif; font-style: normal; font-weight: normal; text-decoration: none; font-size: 9.5pt; vertical-align: 6pt; } div.maincontent .s5 { color: black; font-family:Times New Roman, serif; font-style: normal; font-weight: bold; text-decoration: none; font-size: 14pt; } div.maincontent .s6 { color: black; font-family:Times New Roman, serif; font-style: normal; font-weight: bold; text-decoration: none; font-size: 14pt; } div.maincontent .s7 { color: black; font-family:Times New Roman, serif; font-style: italic; font-weight: normal; text-decoration: none; font-size: 14pt; } div.maincontent .s8 { color: black; font-family:Times New Roman, serif; font-style: italic; font-weight: bold; text-decoration: none; font-size: 14pt; } div.maincontent .s9 { color: black; font-family:Arial, sans-serif; font-style: normal; font-weight: normal; text-decoration: none; font-size: 14pt; } div.maincontent .s10 { color: black; font-family:Arial, sans-serif; font-style: normal; font-weight: normal; text-decoration: none; font-size: 12pt; } div.maincontent .s11 { color: black; font-family:Times New Roman, serif; font-style: normal; font-weight: normal; font-size: 14pt; } div.maincontent .s12 { color: black; font-family:Arial, sans-serif; font-style: normal; font-weight: normal; text-decoration: none; font-size: 14pt; } div.maincontent .s13 { color: black; font-family:Times New Roman, serif; font-style: normal; font-weight: normal; text-decoration: none; font-size: 14pt; } div.maincontent .s14 { color: black; font-family:Times New Roman, serif; font-style: normal; font-weight: bold; text-decoration: none; font-size: 13pt; } div.maincontent .s15 { color: black; font-family:Times New Roman, serif; font-style: italic; font-weight: normal; text-decoration: none; font-size: 9.5pt; vertical-align: 6pt; } div.maincontent .s16 { color: black; font-family:Times New Roman, serif; font-style: normal; font-weight: normal; text-decoration: none; font-size: 5.5pt; vertical-align: 3pt; } div.maincontent .s17 { color: black; font-family:Times New Roman, serif; font-style: normal; font-weight: normal; text-decoration: none; font-size: 8.5pt; } div.maincontent .s18 { color: black; font-family:Times New Roman, serif; font-style: italic; font-weight: bold; font-size: 14pt; } div.maincontent .s19 { color: black; font-family:Times New Roman, serif; font-style: normal; font-weight: bold; font-size: 14pt; } div.maincontent .s20 { color: black; font-family:Times New Roman, serif; font-style: italic; font-weight: normal; text-decoration: none; font-size: 13pt; } div.maincontent .s21 { color: black; font-family:Times New Roman, serif; font-style: normal; font-weight: normal; text-decoration: none; font-size: 14pt; } div.maincontent .s22 { color: black; font-family:Courier New, monospace; font-style: normal; font-weight: normal; text-decoration: none; font-size: 14pt; } div.maincontent .s23 { color: black; font-family:Times New Roman, serif; font-style: normal; font-weight: normal; text-decoration: none; font-size: 13pt; } div.maincontent .s24 { color: black; font-family:Times New Roman, serif; font-style: italic; font-weight: normal; text-decoration: none; font-size: 13pt; } div.maincontent .s25 { color: black; font-family:Times New Roman, serif; font-style: normal; font-weight: bold; text-decoration: none; font-size: 14pt; } div.maincontent .s26 { color: black; font-family:Times New Roman, serif; font-style: normal; font-weight: normal; text-decoration: none; font-size: 14pt; } div.maincontent .s27 { color: black; font-family:Times New Roman, serif; font-style: normal; font-weight: normal; text-decoration: none; font-size: 1.5pt; } div.maincontent .s28 { color: black; font-family:Times New Roman, serif; font-style: normal; font-weight: normal; text-decoration: none; font-size: 11pt; } div.maincontent .s29 { color: black; font-family:Times New Roman, serif; font-style: normal; font-weight: bold; text-decoration: none; font-size: 13pt; } div.maincontent .s30 { color: black; font-family:Times New Roman, serif; font-style: italic; font-weight: bold; text-decoration: none; font-size: 13pt; } div.maincontent .s31 { color: black; font-family:Times New Roman, serif; font-style: normal; font-weight: normal; text-decoration: none; font-size: 13pt; } div.maincontent .s32 { color: black; font-family:Arial, sans-serif; font-style: normal; font-weight: normal; text-decoration: none; font-size: 10.5pt; } div.maincontent .s33 { color: black; font-family:Arial, sans-serif; font-style: normal; font-weight: normal; text-decoration: none; font-size: 11pt; } div.maincontent .s35 { color: black; font-family:Arial, sans-serif; font-style: normal; font-weight: bold; text-decoration: none; font-size: 10.5pt; } div.maincontent .s36 { color: #F00; font-family:Arial, sans-serif; font-style: italic; font-weight: bold; text-decoration: none; font-size: 10.5pt; } div.maincontent .s37 { color: black; font-family:Arial, sans-serif; font-style: normal; font-weight: bold; text-decoration: none; font-size: 10.5pt; } div.maincontent .s38 { color: black; font-family:Times New Roman, serif; font-style: normal; font-weight: bold; text-decoration: none; font-size: 8.5pt; vertical-align: 5pt; } div.maincontent .s39 { color: black; font-family:Arial, sans-serif; font-style: normal; font-weight: normal; text-decoration: none; font-size: 10.5pt; } div.maincontent .s40 { color: black; font-family:Arial, sans-serif; font-style: normal; font-weight: normal; text-decoration: none; font-size: 7pt; vertical-align: 4pt; } div.maincontent .s41 { color: black; font-family:Arial, sans-serif; font-style: normal; font-weight: bold; text-decoration: none; font-size: 10.5pt; } div.maincontent .s42 { color: black; font-family:Arial, sans-serif; font-style: normal; font-weight: bold; text-decoration: none; font-size: 11pt; } div.maincontent .s43 { color: black; font-family:Arial, sans-serif; font-style: normal; font-weight: bold; text-decoration: none; font-size: 7.5pt; vertical-align: 5pt; } div.maincontent .s44 { color: black; font-family:Arial, sans-serif; font-style: normal; font-weight: normal; text-decoration: none; font-size: 7pt; vertical-align: 5pt; } div.maincontent .s45 { color: #F00; font-family:Arial, sans-serif; font-style: normal; font-weight: bold; text-decoration: none; font-size: 10.5pt; } div.maincontent .s46 { color: black; font-family:Arial, sans-serif; font-style: normal; font-weight: bold; text-decoration: none; font-size: 7pt; vertical-align: 5pt; } div.maincontent .s47 { color: black; font-family:Arial, sans-serif; font-style: normal; font-weight: bold; text-decoration: none; font-size: 11pt; } div.maincontent .s48 { color: black; font-family:Times New Roman, serif; font-style: normal; font-weight: normal; text-decoration: none; font-size: 14pt; } div.maincontent .s49 { color: black; font-family:Times New Roman, serif; font-style: italic; font-weight: normal; text-decoration: none; font-size: 9.5pt; vertical-align: -2pt; } div.maincontent .s50 { color: black; font-family:Times New Roman, serif; font-style: normal; font-weight: normal; text-decoration: none; font-size: 9.5pt; } div.maincontent .s51 { color: black; font-family:Times New Roman, serif; font-style: italic; font-weight: normal; text-decoration: none; font-size: 9.5pt; vertical-align: -1pt; } div.maincontent .s52 { color: black; font-family:Times New Roman, serif; font-style: normal; font-weight: normal; text-decoration: none; font-size: 9.5pt; vertical-align: -2pt; } div.maincontent .s53 { color: black; font-family:Times New Roman, serif; font-style: normal; font-weight: normal; text-decoration: none; font-size: 13pt; } div.maincontent .s54 { color: black; font-family:Times New Roman, serif; font-style: normal; font-weight: normal; text-decoration: none; font-size: 9.5pt; vertical-align: -1pt; } div.maincontent .s55 { color: black; font-family:Arial, sans-serif; font-style: normal; font-weight: normal; text-decoration: none; font-size: 10.5pt; } div.maincontent .s56 { color: #00F; font-family:Times New Roman, serif; font-style: normal; font-weight: normal; font-size: 14pt; } div.maincontent .s57 { color: #00F; font-family:Times New Roman, serif; font-style: normal; font-weight: normal; text-decoration: none; font-size: 14pt; } div.maincontent .s58 { color: #00F; font-family:Times New Roman, serif; font-style: normal; font-weight: normal; font-size: 14pt; } div.maincontent .s59 { color: #00F; font-family:Times New Roman, serif; font-style: normal; font-weight: normal; text-decoration: none; font-size: 13pt; } div.maincontent .s60 { color: #00F; font-family:Times New Roman, serif; font-style: normal; font-weight: normal; font-size: 13pt; } div.maincontent .s61 { color: black; font-family:Times New Roman, serif; font-style: normal; font-weight: bold; text-decoration: none; font-size: 14pt; } div.maincontent .s62 { color: black; font-family:Times New Roman, serif; font-style: italic; font-weight: bold; text-decoration: none; font-size: 14pt; } div.maincontent .s63 { color: black; font-family:Times New Roman, serif; font-style: italic; font-weight: bold; text-decoration: none; font-size: 14pt; } div.maincontent .content_head2 { color: #F00; font-family:Times New Roman, serif; font-style: normal; font-weight: bold; text-decoration: none; font-size: 14pt; } div.maincontent .s64 { color: black; font-family:Times New Roman, serif; font-style: italic; font-weight: bold; text-decoration: none; font-size: 13pt; } div.maincontent .s67 { color: black; font-family:Arial, sans-serif; font-style: normal; font-weight: normal; text-decoration: none; font-size: 9.5pt; } div.maincontent .s68 { color: black; font-family:Times New Roman, serif; font-style: normal; font-weight: bold; text-decoration: none; font-size: 12pt; } div.maincontent .s69 { color: black; font-family:Times New Roman, serif; font-style: italic; font-weight: normal; text-decoration: none; font-size: 12pt; } div.maincontent .s70 { color: black; font-family:Times New Roman, serif; font-style: normal; font-weight: normal; tex](https://tailieuthamkhao.com/uploads/2022/12/03/cac-nhan-to-anh-huong-den-hanh-vi-nguoi-tieu-dung-doi-voi-hoat-dong-13-1-120x90.jpg)
![Mobile Phone Usage in Hanoi Inner City Area
zt2i3t4l5ee
zt2a3gsconsumer,consumption,consumer behavior,marketing,mobile marketing
zt2a3ge
zc2o3n4t5e6n7ts
- Test the relationship between demographic variables and consumer behavior for Mobile Marketing activities
The analysis method used is the Chi-square test (χ2), with statistical hypotheses H0 and H1 and significance level α = 0.05. In case the P index (p-value) or Sig. index in SPSS has a value less than or equal to the significance level α, the hypothesis H0 is rejected and vice versa. With this testing procedure, the study can evaluate the difference in behavioral trends between demographic groups.
CHAPTER 4
RESEARCH RESULTS
During two months, 1,100 survey questionnaires were distributed to mobile phone users in the inner city of Hanoi using various methods such as direct interviews, sending via email or using questionnaires designed on the Internet. At the end of the survey, after checking and eliminating erroneous questionnaires, the study collected 858 complete questionnaires, equivalent to a rate of about 78%. In addition, the research subjects of the thesis are only people who are using mobile phones, so people who do not use mobile phones are not within the scope of the thesis, therefore, the questionnaires with the option of not using mobile phones were excluded from the scope of analysis. The number of suitable survey questionnaires included in the statistical analysis was 835.
4.1 Demographic characteristics of the sample
The structure of the survey sample is divided and statistically analyzed according to criteria such as gender, age, occupation, education level and personal income. (Detailed statistical table in Appendix 6)
- Gender structure: Of the 835 completed questionnaires, 49.8% of respondents were male, equivalent to 416 people, and 50.2% were female, equivalent to 419 people. The survey results of the study are completely consistent with the gender ratio in the population structure of Vietnam in general and Hanoi in particular (Male/Female: 49/51).
- Age structure: 36.6% of respondents are <23 years old, equivalent to 306 people. People from 23-34 years old
accounting for the highest proportion: 44.8% equivalent to 374 people, people aged 35-45 and >45 are 70 and 85 people equivalent to 8.4% and 10.2% respectively. Looking at the results of this survey, we can see that the young people - youth account for a large proportion of the total number of people participating in the survey. Meanwhile, the middle-aged people including two age groups of 35 - 45 and >45 have a low rate of participation in the survey. This is completely consistent with the reality when Mobile Marketing is identified as a Marketing service aimed at young people (people under 35 years old).
- Structure by educational level: among 835 valid responses, 541 respondents had university degrees, accounting for the highest proportion of ~ 75%, 102 had secondary school degrees, ~ 13.1%, and 93 had post-graduate degrees, ~ 11.9%.
- Occupational structure: office workers and civil servants are the group with the highest rate of participation with 39.4%, followed by students with 36.6%. Self-employed people account for 12%, retired housewives are 7.8% and other occupational groups account for 4.2%. The survey results show that the student group has the same rate as the group aged <23 at 36.6%. This shows the accuracy of the survey data. In addition, the survey results distributed by occupational criteria have a rate almost similar to the sample division rate in chapter 3. Therefore, it can be concluded that the survey data is suitable for use in analysis activities.
- Income structure: the group with income from 3 to 5 million has the highest rate with 39% of the total number of respondents. This is consistent with the income structure of Hanoi people and corresponds to the average income of the group of civil servants and office workers. Those
People with no income account for 23%, income under 3 million VND accounts for 13% and income over 5 million VND accounts for 25%.
4.2 Mobile phone usage in Hanoi inner city area
According to the survey results, most respondents said they had used the phone for more than 1 year, specifically: 68.4% used mobile phones from 4 to 10 years, 23.2% used from 1 to 3 years, 7.8% used for more than 10 years. Those who used mobile phones for less than 1 year accounted for only a very small proportion of ~ 0.6%. (Table 4.1)
Table 4.1: Time spent using mobile phones
Frequency
Ratio (%)
Valid Percentage
Cumulative Percentage
Alid
<1 year
5
.6
.6
.6
1-3 years
194
23.2
23.2
23.8
4-10 years
571
68.4
68.4
92.2
>10 years
65
7.8
7.8
100.0
Total
835
100.0
100.0
The survey indexes on the time of using mobile phones of consumers in the inner city of Hanoi are very impressive for a developing country like Vietnam and also prove that Vietnamese consumers have a lot of experience using this high-tech device. Moreover, with the majority of consumers surveyed having a relatively long time of use (4-10 years), it partly proves that mobile phones have become an important and essential item in peoples daily lives.
When asked about the mobile phone network they are using, 31% of respondents said they are using the network of Vietel company, 29% use the network of
of Mobifone company, 27% use Vinaphone companys network and 13% use networks of other providers such as E-VN telecom, S-fone, Beeline, Vietnammobile. (Figure 4.1).
Figure 4.1: Mobile phone network in use
Compared with the announced market share of mobile telecommunications service providers in Vietnam (Vietel: 36%, Mobifone: 29%, Vinaphone: 28%, the remaining networks: 7%), we see that the survey results do not have many differences. However, the statistics show that there is a difference in the market share of other networks because the Hanoi market is one of the two main markets of small networks, so their market share in this area will certainly be higher than that of the whole country.
According to a report by NielsenMobile (2009) [8], the number of prepaid mobile phone subscribers in Hanoi accounts for 95% of the total number of subscribers, however, the results of this survey show that the percentage of prepaid subscribers has decreased by more than 20%, only at 70.8%. On the contrary, the number of postpaid subscribers tends to increase from 5% in 2009 to 19.2%. Those who are simultaneously using both types of subscriptions account for 10%. (Table 4.2).
Table 4.2: Types of mobile phone subscribers
Frequency
Ratio (%)
Valid Percentage
Cumulative Percentage
Valid
Prepay
591
70.8
70.8
70.8
Pay later
160
19.2
19.2
89.9
Both of the above
84
10.1
10.1
100.0
Total
835
100.0
100.0
The above figures show the change in the psychology and consumption habits of Vietnamese consumers towards mobile telecommunications services, when the use of prepaid subscriptions and junk SIMs is replaced by the use of two types of subscriptions for different purposes and needs or switching to postpaid subscriptions to enjoy better customer care services.
In addition, the majority of respondents have an average spending level for mobile phone services from 100 to 300 thousand VND (406 ~ 48.6% of total respondents). The high spending level (> 500 thousand VND) is the spending level with the lowest number of people with only 8.4%, on the contrary, the low spending level (under 100 thousand VND) accounts for the second highest proportion among the groups of respondents with 25.4%. People with low spending levels mainly fall into the group of students and retirees/housewives - those who have little need to use or mainly use promotional SIM cards. (Table 4.3).
Table 4.3: Spending on mobile phone charges
Frequency
Ratio (%)
Valid Percentage
Cumulative Percentage
Valid
<100,000
212
25.4
25.4
25.4
100-300,000
406
48.6
48.6
74.0
300,000-500,000
147
17.6
17.6
91.6
>500,000
70
8.4
8.4
100.0
Total
835
100.0
100.0
The statistics in Table 4.3 are similar to the percentages in the NielsenMobile survey results (2009) with 73% of mobile phone users having medium spending levels and only 13% having high spending levels.
The survey results also showed that up to 31% ~ nearly one-third of respondents said they sent more than 10 SMS messages/day, meaning that on average they sent 1 SMS message for every working hour. Those with an average SMS message volume (from 3 to 10 messages/day) accounted for 51.1% and those with a low SMS message volume (less than 3 messages/day) accounted for 17%. (Table 4.4)
Table 4.4: Number of SMS messages sent per day
Frequency
Ratio (%)
Valid Percentage
Cumulative Percentage
Valid
<3 news
142
17.0
17.0
17.0
3-10 news
427
51.1
51.1
68.1
>10 news
266
31.9
31.9
100.0
Total
835
100.0
100.0
Similar to sending messages, those with an average message receiving rate (from 3-10 messages/day) accounted for the highest percentage of ~ 55%, followed by those with a high number of messages (over 10 messages/day) ~ 24% and those with a low number of messages received daily (under 3 messages/day) remained at the bottom with 21%. (Table 4.5)
Table 4.5: Number of SMS messages received per day
Frequency
Ratio (%)
Valid Percentage
Cumulative Percentage
Valid
<3 news
175
21.0
21.0
21.0
3-10 news
436
55.0
55.0
76.0
>10 news
197
24.0
24.0
100.0
Total
835
100.0
100.0
When comparing the data of the two result tables 4.4 and 4.5, we can see the reasonableness between the ratio of the number of messages sent and the number of messages received daily by the interview participants.
4.3 Current status of SMS advertising and Mobile Marketing
According to the interview results, in the 3 months from the time of the survey and before, 94% of respondents, equivalent to 785 people, said they received advertising messages, while only a very small percentage of 6% (only 50 people) did not receive advertising messages (Table 4.6).
Table 4.6: Percentage of people receiving advertising messages in the last 3 months
Frequency
Ratio (%)
Valid Percentage
Cumulative Percentage
Valid
Have
785
94.0
94.0
94.0
Are not
50
6.0
6.0
100.0
Total
835
100.0
100.0
The results of Table 4.6 show that consumers in the inner city of Hanoi are very familiar with advertising messages. This result is also the basis for assessing the knowledge, experience and understanding of the respondents in the interview. This is also one of the important factors determining the accuracy of the survey results.
In addition, most respondents said they had received promotional messages, but only 24% of them had ever taken the action of registering to receive promotional messages, while 76% of the remaining respondents did not register to receive promotional messages but still received promotional messages every day. This is the first sign indicating the weaknesses and shortcomings of lax management of this activity in Vietnam. (Table 4.7)
div.maincontent .s1 { color: black; font-family:Times New Roman, serif; font-style: italic; font-weight: normal; text-decoration: none; font-size: 14pt; } div.maincontent .s2 { color: black; font-family:Times New Roman, serif; font-style: normal; font-weight: bold; text-decoration: none; font-size: 14pt; } div.maincontent .s3 { color: black; font-family:Times New Roman, serif; font-style: normal; font-weight: bold; text-decoration: none; font-size: 14pt; } div.maincontent .p { color: black; font-family:Times New Roman, serif; font-style: normal; font-weight: normal; text-decoration: none; font-size: 14pt; margin:0pt; } div.maincontent p { color: black; font-family:Times New Roman, serif; font-style: normal; font-weight: normal; text-decoration: none; font-size: 14pt; margin:0pt; } div.maincontent .s4 { color: black; font-family:Times New Roman, serif; font-style: normal; font-weight: normal; text-decoration: none; font-size: 9.5pt; vertical-align: 6pt; } div.maincontent .s5 { color: black; font-family:Times New Roman, serif; font-style: normal; font-weight: bold; text-decoration: none; font-size: 14pt; } div.maincontent .s6 { color: black; font-family:Times New Roman, serif; font-style: normal; font-weight: bold; text-decoration: none; font-size: 14pt; } div.maincontent .s7 { color: black; font-family:Times New Roman, serif; font-style: italic; font-weight: normal; text-decoration: none; font-size: 14pt; } div.maincontent .s8 { color: black; font-family:Times New Roman, serif; font-style: italic; font-weight: bold; text-decoration: none; font-size: 14pt; } div.maincontent .s9 { color: black; font-family:Arial, sans-serif; font-style: normal; font-weight: normal; text-decoration: none; font-size: 14pt; } div.maincontent .s10 { color: black; font-family:Arial, sans-serif; font-style: normal; font-weight: normal; text-decoration: none; font-size: 12pt; } div.maincontent .s11 { color: black; font-family:Times New Roman, serif; font-style: normal; font-weight: normal; font-size: 14pt; } div.maincontent .s12 { color: black; font-family:Arial, sans-serif; font-style: normal; font-weight: normal; text-decoration: none; font-size: 14pt; } div.maincontent .s13 { color: black; font-family:Times New Roman, serif; font-style: normal; font-weight: normal; text-decoration: none; font-size: 14pt; } div.maincontent .s14 { color: black; font-family:Times New Roman, serif; font-style: normal; font-weight: bold; text-decoration: none; font-size: 13pt; } div.maincontent .s15 { color: black; font-family:Times New Roman, serif; font-style: italic; font-weight: normal; text-decoration: none; font-size: 9.5pt; vertical-align: 6pt; } div.maincontent .s16 { color: black; font-family:Times New Roman, serif; font-style: normal; font-weight: normal; text-decoration: none; font-size: 5.5pt; vertical-align: 3pt; } div.maincontent .s17 { color: black; font-family:Times New Roman, serif; font-style: normal; font-weight: normal; text-decoration: none; font-size: 8.5pt; } div.maincontent .s18 { color: black; font-family:Times New Roman, serif; font-style: italic; font-weight: bold; font-size: 14pt; } div.maincontent .s19 { color: black; font-family:Times New Roman, serif; font-style: normal; font-weight: bold; font-size: 14pt; } div.maincontent .s20 { color: black; font-family:Times New Roman, serif; font-style: italic; font-weight: normal; text-decoration: none; font-size: 13pt; } div.maincontent .s21 { color: black; font-family:Times New Roman, serif; font-style: normal; font-weight: normal; text-decoration: none; font-size: 14pt; } div.maincontent .s22 { color: black; font-family:Courier New, monospace; font-style: normal; font-weight: normal; text-decoration: none; font-size: 14pt; } div.maincontent .s23 { color: black; font-family:Times New Roman, serif; font-style: normal; font-weight: normal; text-decoration: none; font-size: 13pt; } div.maincontent .s24 { color: black; font-family:Times New Roman, serif; font-style: italic; font-weight: normal; text-decoration: none; font-size: 13pt; } div.maincontent .s25 { color: black; font-family:Times New Roman, serif; font-style: normal; font-weight: bold; text-decoration: none; font-size: 14pt; } div.maincontent .s26 { color: black; font-family:Times New Roman, serif; font-style: normal; font-weight: normal; text-decoration: none; font-size: 14pt; } div.maincontent .s27 { color: black; font-family:Times New Roman, serif; font-style: normal; font-weight: normal; text-decoration: none; font-size: 1.5pt; } div.maincontent .s28 { color: black; font-family:Times New Roman, serif; font-style: normal; font-weight: normal; text-decoration: none; font-size: 11pt; } div.maincontent .s29 { color: black; font-family:Times New Roman, serif; font-style: normal; font-weight: bold; text-decoration: none; font-size: 13pt; } div.maincontent .s30 { color: black; font-family:Times New Roman, serif; font-style: italic; font-weight: bold; text-decoration: none; font-size: 13pt; } div.maincontent .s31 { color: black; font-family:Times New Roman, serif; font-style: normal; font-weight: normal; text-decoration: none; font-size: 13pt; } div.maincontent .s32 { color: black; font-family:Arial, sans-serif; font-style: normal; font-weight: normal; text-decoration: none; font-size: 10.5pt; } div.maincontent .s33 { color: black; font-family:Arial, sans-serif; font-style: normal; font-weight: normal; text-decoration: none; font-size: 11pt; } div.maincontent .s35 { color: black; font-family:Arial, sans-serif; font-style: normal; font-weight: bold; text-decoration: none; font-size: 10.5pt; } div.maincontent .s36 { color: #F00; font-family:Arial, sans-serif; font-style: italic; font-weight: bold; text-decoration: none; font-size: 10.5pt; } div.maincontent .s37 { color: black; font-family:Arial, sans-serif; font-style: normal; font-weight: bold; text-decoration: none; font-size: 10.5pt; } div.maincontent .s38 { color: black; font-family:Times New Roman, serif; font-style: normal; font-weight: bold; text-decoration: none; font-size: 8.5pt; vertical-align: 5pt; } div.maincontent .s39 { color: black; font-family:Arial, sans-serif; font-style: normal; font-weight: normal; text-decoration: none; font-size: 10.5pt; } div.maincontent .s40 { color: black; font-family:Arial, sans-serif; font-style: normal; font-weight: normal; text-decoration: none; font-size: 7pt; vertical-align: 4pt; } div.maincontent .s41 { color: black; font-family:Arial, sans-serif; font-style: normal; font-weight: bold; text-decoration: none; font-size: 10.5pt; } div.maincontent .s42 { color: black; font-family:Arial, sans-serif; font-style: normal; font-weight: bold; text-decoration: none; font-size: 11pt; } div.maincontent .s43 { color: black; font-family:Arial, sans-serif; font-style: normal; font-weight: bold; text-decoration: none; font-size: 7.5pt; vertical-align: 5pt; } div.maincontent .s44 { color: black; font-family:Arial, sans-serif; font-style: normal; font-weight: normal; text-decoration: none; font-size: 7pt; vertical-align: 5pt; } div.maincontent .s45 { color: #F00; font-family:Arial, sans-serif; font-style: normal; font-weight: bold; text-decoration: none; font-size: 10.5pt; } div.maincontent .s46 { color: black; font-family:Arial, sans-serif; font-style: normal; font-weight: bold; text-decoration: none; font-size: 7pt; vertical-align: 5pt; } div.maincontent .s47 { color: black; font-family:Arial, sans-serif; font-style: normal; font-weight: bold; text-decoration: none; font-size: 11pt; } div.maincontent .s48 { color: black; font-family:Times New Roman, serif; font-style: normal; font-weight: normal; text-decoration: none; font-size: 14pt; } div.maincontent .s49 { color: black; font-family:Times New Roman, serif; font-style: italic; font-weight: normal; text-decoration: none; font-size: 9.5pt; vertical-align: -2pt; } div.maincontent .s50 { color: black; font-family:Times New Roman, serif; font-style: normal; font-weight: normal; text-decoration: none; font-size: 9.5pt; } div.maincontent .s51 { color: black; font-family:Times New Roman, serif; font-style: italic; font-weight: normal; text-decoration: none; font-size: 9.5pt; vertical-align: -1pt; } div.maincontent .s52 { color: black; font-family:Times New Roman, serif; font-style: normal; font-weight: normal; text-decoration: none; font-size: 9.5pt; vertical-align: -2pt; } div.maincontent .s53 { color: black; font-family:Times New Roman, serif; font-style: normal; font-weight: normal; text-decoration: none; font-size: 13pt; } div.maincontent .s54 { color: black; font-family:Times New Roman, serif; font-style: normal; font-weight: normal; text-decoration: none; font-size: 9.5pt; vertical-align: -1pt; } div.maincontent .s55 { color: black; font-family:Arial, sans-serif; font-style: normal; font-weight: normal; text-decoration: none; font-size: 10.5pt; } div.maincontent .s56 { color: #00F; font-family:Times New Roman, serif; font-style: normal; font-weight: normal; font-size: 14pt; } div.maincontent .s57 { color: #00F; font-family:Times New Roman, serif; font-style: normal; font-weight: normal; text-decoration: none; font-size: 14pt; } div.maincontent .s58 { color: #00F; font-family:Times New Roman, serif; font-style: normal; font-weight: normal; font-size: 14pt; } div.maincontent .s59 { color: #00F; font-family:Times New Roman, serif; font-style: normal; font-weight: normal; text-decoration: none; font-size: 13pt; } div.maincontent .s60 { color: #00F; font-family:Times New Roman, serif; font-style: normal; font-weight: normal; font-size: 13pt; } div.maincontent .s61 { color: black; font-family:Times New Roman, serif; font-style: normal; font-weight: bold; text-decoration: none; font-size: 14pt; } div.maincontent .s62 { color: black; font-family:Times New Roman, serif; font-style: italic; font-weight: bold; text-decoration: none; font-size: 14pt; } div.maincontent .s63 { color: black; font-family:Times New Roman, serif; font-style: italic; font-weight: bold; text-decoration: none; font-size: 14pt; } div.maincontent .content_head2 { color: #F00; font-family:Times New Roman, serif; font-style: normal; font-weight: bold; text-decoration: none; font-size: 14pt; } div.maincontent .s64 { color: black; font-family:Times New Roman, serif; font-style: italic; font-weight: bold; text-decoration: none; font-size: 13pt; } div.maincontent .s67 { color: black; font-family:Arial, sans-serif; font-style: normal; font-weight: normal; text-decoration: none; font-size: 9.5pt; } div.maincontent .s68 { color: black; font-family:Times New Roman, serif; font-style: normal; font-weight: bold; text-decoration: none; font-size: 12pt; } div.maincontent .s69 { color: black; font-family:Times New Roman, serif; font-style: italic; font-weight: normal; text-decoration: none; font-size: 12pt; } div.maincontent .s70 { color: black; font-family:Times New Roman, serif; font-style: normal; font-weight: normal; tex](data:image/svg+xml,%3Csvg%20xmlns=%22http://www.w3.org/2000/svg%22%20viewBox=%220%200%2075%2075%22%3E%3C/svg%3E) Mobile Phone Usage in Hanoi Inner City Area
zt2i3t4l5ee
zt2a3gsconsumer,consumption,consumer behavior,marketing,mobile marketing
zt2a3ge
zc2o3n4t5e6n7ts
- Test the relationship between demographic variables and consumer behavior for Mobile Marketing activities
The analysis method used is the Chi-square test (χ2), with statistical hypotheses H0 and H1 and significance level α = 0.05. In case the P index (p-value) or Sig. index in SPSS has a value less than or equal to the significance level α, the hypothesis H0 is rejected and vice versa. With this testing procedure, the study can evaluate the difference in behavioral trends between demographic groups.
CHAPTER 4
RESEARCH RESULTS
During two months, 1,100 survey questionnaires were distributed to mobile phone users in the inner city of Hanoi using various methods such as direct interviews, sending via email or using questionnaires designed on the Internet. At the end of the survey, after checking and eliminating erroneous questionnaires, the study collected 858 complete questionnaires, equivalent to a rate of about 78%. In addition, the research subjects of the thesis are only people who are using mobile phones, so people who do not use mobile phones are not within the scope of the thesis, therefore, the questionnaires with the option of not using mobile phones were excluded from the scope of analysis. The number of suitable survey questionnaires included in the statistical analysis was 835.
4.1 Demographic characteristics of the sample
The structure of the survey sample is divided and statistically analyzed according to criteria such as gender, age, occupation, education level and personal income. (Detailed statistical table in Appendix 6)
- Gender structure: Of the 835 completed questionnaires, 49.8% of respondents were male, equivalent to 416 people, and 50.2% were female, equivalent to 419 people. The survey results of the study are completely consistent with the gender ratio in the population structure of Vietnam in general and Hanoi in particular (Male/Female: 49/51).
- Age structure: 36.6% of respondents are <23 years old, equivalent to 306 people. People from 23-34 years old
accounting for the highest proportion: 44.8% equivalent to 374 people, people aged 35-45 and >45 are 70 and 85 people equivalent to 8.4% and 10.2% respectively. Looking at the results of this survey, we can see that the young people - youth account for a large proportion of the total number of people participating in the survey. Meanwhile, the middle-aged people including two age groups of 35 - 45 and >45 have a low rate of participation in the survey. This is completely consistent with the reality when Mobile Marketing is identified as a Marketing service aimed at young people (people under 35 years old).
- Structure by educational level: among 835 valid responses, 541 respondents had university degrees, accounting for the highest proportion of ~ 75%, 102 had secondary school degrees, ~ 13.1%, and 93 had post-graduate degrees, ~ 11.9%.
- Occupational structure: office workers and civil servants are the group with the highest rate of participation with 39.4%, followed by students with 36.6%. Self-employed people account for 12%, retired housewives are 7.8% and other occupational groups account for 4.2%. The survey results show that the student group has the same rate as the group aged <23 at 36.6%. This shows the accuracy of the survey data. In addition, the survey results distributed by occupational criteria have a rate almost similar to the sample division rate in chapter 3. Therefore, it can be concluded that the survey data is suitable for use in analysis activities.
- Income structure: the group with income from 3 to 5 million has the highest rate with 39% of the total number of respondents. This is consistent with the income structure of Hanoi people and corresponds to the average income of the group of civil servants and office workers. Those
People with no income account for 23%, income under 3 million VND accounts for 13% and income over 5 million VND accounts for 25%.
4.2 Mobile phone usage in Hanoi inner city area
According to the survey results, most respondents said they had used the phone for more than 1 year, specifically: 68.4% used mobile phones from 4 to 10 years, 23.2% used from 1 to 3 years, 7.8% used for more than 10 years. Those who used mobile phones for less than 1 year accounted for only a very small proportion of ~ 0.6%. (Table 4.1)
Table 4.1: Time spent using mobile phones
Frequency
Ratio (%)
Valid Percentage
Cumulative Percentage
Alid
<1 year
5
.6
.6
.6
1-3 years
194
23.2
23.2
23.8
4-10 years
571
68.4
68.4
92.2
>10 years
65
7.8
7.8
100.0
Total
835
100.0
100.0
The survey indexes on the time of using mobile phones of consumers in the inner city of Hanoi are very impressive for a developing country like Vietnam and also prove that Vietnamese consumers have a lot of experience using this high-tech device. Moreover, with the majority of consumers surveyed having a relatively long time of use (4-10 years), it partly proves that mobile phones have become an important and essential item in people's daily lives.
When asked about the mobile phone network they are using, 31% of respondents said they are using the network of Vietel company, 29% use the network of
of Mobifone company, 27% use Vinaphone company's network and 13% use networks of other providers such as E-VN telecom, S-fone, Beeline, Vietnammobile. (Figure 4.1).
Figure 4.1: Mobile phone network in use
Compared with the announced market share of mobile telecommunications service providers in Vietnam (Vietel: 36%, Mobifone: 29%, Vinaphone: 28%, the remaining networks: 7%), we see that the survey results do not have many differences. However, the statistics show that there is a difference in the market share of other networks because the Hanoi market is one of the two main markets of small networks, so their market share in this area will certainly be higher than that of the whole country.
According to a report by NielsenMobile (2009) [8], the number of prepaid mobile phone subscribers in Hanoi accounts for 95% of the total number of subscribers, however, the results of this survey show that the percentage of prepaid subscribers has decreased by more than 20%, only at 70.8%. On the contrary, the number of postpaid subscribers tends to increase from 5% in 2009 to 19.2%. Those who are simultaneously using both types of subscriptions account for 10%. (Table 4.2).
Table 4.2: Types of mobile phone subscribers
Frequency
Ratio (%)
Valid Percentage
Cumulative Percentage
Valid
Prepay
591
70.8
70.8
70.8
Pay later
160
19.2
19.2
89.9
Both of the above
84
10.1
10.1
100.0
Total
835
100.0
100.0
The above figures show the change in the psychology and consumption habits of Vietnamese consumers towards mobile telecommunications services, when the use of prepaid subscriptions and junk SIMs is replaced by the use of two types of subscriptions for different purposes and needs or switching to postpaid subscriptions to enjoy better customer care services.
In addition, the majority of respondents have an average spending level for mobile phone services from 100 to 300 thousand VND (406 ~ 48.6% of total respondents). The high spending level (> 500 thousand VND) is the spending level with the lowest number of people with only 8.4%, on the contrary, the low spending level (under 100 thousand VND) accounts for the second highest proportion among the groups of respondents with 25.4%. People with low spending levels mainly fall into the group of students and retirees/housewives - those who have little need to use or mainly use promotional SIM cards. (Table 4.3).
Table 4.3: Spending on mobile phone charges
Frequency
Ratio (%)
Valid Percentage
Cumulative Percentage
Valid
<100,000
212
25.4
25.4
25.4
100-300,000
406
48.6
48.6
74.0
300,000-500,000
147
17.6
17.6
91.6
>500,000
70
8.4
8.4
100.0
Total
835
100.0
100.0
The statistics in Table 4.3 are similar to the percentages in the NielsenMobile survey results (2009) with 73% of mobile phone users having medium spending levels and only 13% having high spending levels.
The survey results also showed that up to 31% ~ nearly one-third of respondents said they sent more than 10 SMS messages/day, meaning that on average they sent 1 SMS message for every working hour. Those with an average SMS message volume (from 3 to 10 messages/day) accounted for 51.1% and those with a low SMS message volume (less than 3 messages/day) accounted for 17%. (Table 4.4)
Table 4.4: Number of SMS messages sent per day
Frequency
Ratio (%)
Valid Percentage
Cumulative Percentage
Valid
<3 news
142
17.0
17.0
17.0
3-10 news
427
51.1
51.1
68.1
>10 news
266
31.9
31.9
100.0
Total
835
100.0
100.0
Similar to sending messages, those with an average message receiving rate (from 3-10 messages/day) accounted for the highest percentage of ~ 55%, followed by those with a high number of messages (over 10 messages/day) ~ 24% and those with a low number of messages received daily (under 3 messages/day) remained at the bottom with 21%. (Table 4.5)
Table 4.5: Number of SMS messages received per day
Frequency
Ratio (%)
Valid Percentage
Cumulative Percentage
Valid
<3 news
175
21.0
21.0
21.0
3-10 news
436
55.0
55.0
76.0
>10 news
197
24.0
24.0
100.0
Total
835
100.0
100.0
When comparing the data of the two result tables 4.4 and 4.5, we can see the reasonableness between the ratio of the number of messages sent and the number of messages received daily by the interview participants.
4.3 Current status of SMS advertising and Mobile Marketing
According to the interview results, in the 3 months from the time of the survey and before, 94% of respondents, equivalent to 785 people, said they received advertising messages, while only a very small percentage of 6% (only 50 people) did not receive advertising messages (Table 4.6).
Table 4.6: Percentage of people receiving advertising messages in the last 3 months
Frequency
Ratio (%)
Valid Percentage
Cumulative Percentage
Valid
Have
785
94.0
94.0
94.0
Are not
50
6.0
6.0
100.0
Total
835
100.0
100.0
The results of Table 4.6 show that consumers in the inner city of Hanoi are very familiar with advertising messages. This result is also the basis for assessing the knowledge, experience and understanding of the respondents in the interview. This is also one of the important factors determining the accuracy of the survey results.
In addition, most respondents said they had received promotional messages, but only 24% of them had ever taken the action of registering to receive promotional messages, while 76% of the remaining respondents did not register to receive promotional messages but still received promotional messages every day. This is the first sign indicating the weaknesses and shortcomings of lax management of this activity in Vietnam. (Table 4.7)
div.maincontent .s1 { color: black; font-family:"Times New Roman", serif; font-style: italic; font-weight: normal; text-decoration: none; font-size: 14pt; } div.maincontent .s2 { color: black; font-family:"Times New Roman", serif; font-style: normal; font-weight: bold; text-decoration: none; font-size: 14pt; } div.maincontent .s3 { color: black; font-family:"Times New Roman", serif; font-style: normal; font-weight: bold; text-decoration: none; font-size: 14pt; } div.maincontent .p { color: black; font-family:"Times New Roman", serif; font-style: normal; font-weight: normal; text-decoration: none; font-size: 14pt; margin:0pt; } div.maincontent p { color: black; font-family:"Times New Roman", serif; font-style: normal; font-weight: normal; text-decoration: none; font-size: 14pt; margin:0pt; } div.maincontent .s4 { color: black; font-family:"Times New Roman", serif; font-style: normal; font-weight: normal; text-decoration: none; font-size: 9.5pt; vertical-align: 6pt; } div.maincontent .s5 { color: black; font-family:"Times New Roman", serif; font-style: normal; font-weight: bold; text-decoration: none; font-size: 14pt; } div.maincontent .s6 { color: black; font-family:"Times New Roman", serif; font-style: normal; font-weight: bold; text-decoration: none; font-size: 14pt; } div.maincontent .s7 { color: black; font-family:"Times New Roman", serif; font-style: italic; font-weight: normal; text-decoration: none; font-size: 14pt; } div.maincontent .s8 { color: black; font-family:"Times New Roman", serif; font-style: italic; font-weight: bold; text-decoration: none; font-size: 14pt; } div.maincontent .s9 { color: black; font-family:Arial, sans-serif; font-style: normal; font-weight: normal; text-decoration: none; font-size: 14pt; } div.maincontent .s10 { color: black; font-family:Arial, sans-serif; font-style: normal; font-weight: normal; text-decoration: none; font-size: 12pt; } div.maincontent .s11 { color: black; font-family:"Times New Roman", serif; font-style: normal; font-weight: normal; font-size: 14pt; } div.maincontent .s12 { color: black; font-family:Arial, sans-serif; font-style: normal; font-weight: normal; text-decoration: none; font-size: 14pt; } div.maincontent .s13 { color: black; font-family:"Times New Roman", serif; font-style: normal; font-weight: normal; text-decoration: none; font-size: 14pt; } div.maincontent .s14 { color: black; font-family:"Times New Roman", serif; font-style: normal; font-weight: bold; text-decoration: none; font-size: 13pt; } div.maincontent .s15 { color: black; font-family:"Times New Roman", serif; font-style: italic; font-weight: normal; text-decoration: none; font-size: 9.5pt; vertical-align: 6pt; } div.maincontent .s16 { color: black; font-family:"Times New Roman", serif; font-style: normal; font-weight: normal; text-decoration: none; font-size: 5.5pt; vertical-align: 3pt; } div.maincontent .s17 { color: black; font-family:"Times New Roman", serif; font-style: normal; font-weight: normal; text-decoration: none; font-size: 8.5pt; } div.maincontent .s18 { color: black; font-family:"Times New Roman", serif; font-style: italic; font-weight: bold; font-size: 14pt; } div.maincontent .s19 { color: black; font-family:"Times New Roman", serif; font-style: normal; font-weight: bold; font-size: 14pt; } div.maincontent .s20 { color: black; font-family:"Times New Roman", serif; font-style: italic; font-weight: normal; text-decoration: none; font-size: 13pt; } div.maincontent .s21 { color: black; font-family:"Times New Roman", serif; font-style: normal; font-weight: normal; text-decoration: none; font-size: 14pt; } div.maincontent .s22 { color: black; font-family:"Courier New", monospace; font-style: normal; font-weight: normal; text-decoration: none; font-size: 14pt; } div.maincontent .s23 { color: black; font-family:"Times New Roman", serif; font-style: normal; font-weight: normal; text-decoration: none; font-size: 13pt; } div.maincontent .s24 { color: black; font-family:"Times New Roman", serif; font-style: italic; font-weight: normal; text-decoration: none; font-size: 13pt; } div.maincontent .s25 { color: black; font-family:"Times New Roman", serif; font-style: normal; font-weight: bold; text-decoration: none; font-size: 14pt; } div.maincontent .s26 { color: black; font-family:"Times New Roman", serif; font-style: normal; font-weight: normal; text-decoration: none; font-size: 14pt; } div.maincontent .s27 { color: black; font-family:"Times New Roman", serif; font-style: normal; font-weight: normal; text-decoration: none; font-size: 1.5pt; } div.maincontent .s28 { color: black; font-family:"Times New Roman", serif; font-style: normal; font-weight: normal; text-decoration: none; font-size: 11pt; } div.maincontent .s29 { color: black; font-family:"Times New Roman", serif; font-style: normal; font-weight: bold; text-decoration: none; font-size: 13pt; } div.maincontent .s30 { color: black; font-family:"Times New Roman", serif; font-style: italic; font-weight: bold; text-decoration: none; font-size: 13pt; } div.maincontent .s31 { color: black; font-family:"Times New Roman", serif; font-style: normal; font-weight: normal; text-decoration: none; font-size: 13pt; } div.maincontent .s32 { color: black; font-family:Arial, sans-serif; font-style: normal; font-weight: normal; text-decoration: none; font-size: 10.5pt; } div.maincontent .s33 { color: black; font-family:Arial, sans-serif; font-style: normal; font-weight: normal; text-decoration: none; font-size: 11pt; } div.maincontent .s35 { color: black; font-family:Arial, sans-serif; font-style: normal; font-weight: bold; text-decoration: none; font-size: 10.5pt; } div.maincontent .s36 { color: #F00; font-family:Arial, sans-serif; font-style: italic; font-weight: bold; text-decoration: none; font-size: 10.5pt; } div.maincontent .s37 { color: black; font-family:Arial, sans-serif; font-style: normal; font-weight: bold; text-decoration: none; font-size: 10.5pt; } div.maincontent .s38 { color: black; font-family:"Times New Roman", serif; font-style: normal; font-weight: bold; text-decoration: none; font-size: 8.5pt; vertical-align: 5pt; } div.maincontent .s39 { color: black; font-family:Arial, sans-serif; font-style: normal; font-weight: normal; text-decoration: none; font-size: 10.5pt; } div.maincontent .s40 { color: black; font-family:Arial, sans-serif; font-style: normal; font-weight: normal; text-decoration: none; font-size: 7pt; vertical-align: 4pt; } div.maincontent .s41 { color: black; font-family:Arial, sans-serif; font-style: normal; font-weight: bold; text-decoration: none; font-size: 10.5pt; } div.maincontent .s42 { color: black; font-family:Arial, sans-serif; font-style: normal; font-weight: bold; text-decoration: none; font-size: 11pt; } div.maincontent .s43 { color: black; font-family:Arial, sans-serif; font-style: normal; font-weight: bold; text-decoration: none; font-size: 7.5pt; vertical-align: 5pt; } div.maincontent .s44 { color: black; font-family:Arial, sans-serif; font-style: normal; font-weight: normal; text-decoration: none; font-size: 7pt; vertical-align: 5pt; } div.maincontent .s45 { color: #F00; font-family:Arial, sans-serif; font-style: normal; font-weight: bold; text-decoration: none; font-size: 10.5pt; } div.maincontent .s46 { color: black; font-family:Arial, sans-serif; font-style: normal; font-weight: bold; text-decoration: none; font-size: 7pt; vertical-align: 5pt; } div.maincontent .s47 { color: black; font-family:Arial, sans-serif; font-style: normal; font-weight: bold; text-decoration: none; font-size: 11pt; } div.maincontent .s48 { color: black; font-family:"Times New Roman", serif; font-style: normal; font-weight: normal; text-decoration: none; font-size: 14pt; } div.maincontent .s49 { color: black; font-family:"Times New Roman", serif; font-style: italic; font-weight: normal; text-decoration: none; font-size: 9.5pt; vertical-align: -2pt; } div.maincontent .s50 { color: black; font-family:"Times New Roman", serif; font-style: normal; font-weight: normal; text-decoration: none; font-size: 9.5pt; } div.maincontent .s51 { color: black; font-family:"Times New Roman", serif; font-style: italic; font-weight: normal; text-decoration: none; font-size: 9.5pt; vertical-align: -1pt; } div.maincontent .s52 { color: black; font-family:"Times New Roman", serif; font-style: normal; font-weight: normal; text-decoration: none; font-size: 9.5pt; vertical-align: -2pt; } div.maincontent .s53 { color: black; font-family:"Times New Roman", serif; font-style: normal; font-weight: normal; text-decoration: none; font-size: 13pt; } div.maincontent .s54 { color: black; font-family:"Times New Roman", serif; font-style: normal; font-weight: normal; text-decoration: none; font-size: 9.5pt; vertical-align: -1pt; } div.maincontent .s55 { color: black; font-family:Arial, sans-serif; font-style: normal; font-weight: normal; text-decoration: none; font-size: 10.5pt; } div.maincontent .s56 { color: #00F; font-family:"Times New Roman", serif; font-style: normal; font-weight: normal; font-size: 14pt; } div.maincontent .s57 { color: #00F; font-family:"Times New Roman", serif; font-style: normal; font-weight: normal; text-decoration: none; font-size: 14pt; } div.maincontent .s58 { color: #00F; font-family:"Times New Roman", serif; font-style: normal; font-weight: normal; font-size: 14pt; } div.maincontent .s59 { color: #00F; font-family:"Times New Roman", serif; font-style: normal; font-weight: normal; text-decoration: none; font-size: 13pt; } div.maincontent .s60 { color: #00F; font-family:"Times New Roman", serif; font-style: normal; font-weight: normal; font-size: 13pt; } div.maincontent .s61 { color: black; font-family:"Times New Roman", serif; font-style: normal; font-weight: bold; text-decoration: none; font-size: 14pt; } div.maincontent .s62 { color: black; font-family:"Times New Roman", serif; font-style: italic; font-weight: bold; text-decoration: none; font-size: 14pt; } div.maincontent .s63 { color: black; font-family:"Times New Roman", serif; font-style: italic; font-weight: bold; text-decoration: none; font-size: 14pt; } div.maincontent .content_head2 { color: #F00; font-family:"Times New Roman", serif; font-style: normal; font-weight: bold; text-decoration: none; font-size: 14pt; } div.maincontent .s64 { color: black; font-family:"Times New Roman", serif; font-style: italic; font-weight: bold; text-decoration: none; font-size: 13pt; } div.maincontent .s67 { color: black; font-family:Arial, sans-serif; font-style: normal; font-weight: normal; text-decoration: none; font-size: 9.5pt; } div.maincontent .s68 { color: black; font-family:"Times New Roman", serif; font-style: normal; font-weight: bold; text-decoration: none; font-size: 12pt; } div.maincontent .s69 { color: black; font-family:"Times New Roman", serif; font-style: italic; font-weight: normal; text-decoration: none; font-size: 12pt; } div.maincontent .s70 { color: black; font-family:"Times New Roman", serif; font-style: normal; font-weight: normal; tex
Mobile Phone Usage in Hanoi Inner City Area
zt2i3t4l5ee
zt2a3gsconsumer,consumption,consumer behavior,marketing,mobile marketing
zt2a3ge
zc2o3n4t5e6n7ts
- Test the relationship between demographic variables and consumer behavior for Mobile Marketing activities
The analysis method used is the Chi-square test (χ2), with statistical hypotheses H0 and H1 and significance level α = 0.05. In case the P index (p-value) or Sig. index in SPSS has a value less than or equal to the significance level α, the hypothesis H0 is rejected and vice versa. With this testing procedure, the study can evaluate the difference in behavioral trends between demographic groups.
CHAPTER 4
RESEARCH RESULTS
During two months, 1,100 survey questionnaires were distributed to mobile phone users in the inner city of Hanoi using various methods such as direct interviews, sending via email or using questionnaires designed on the Internet. At the end of the survey, after checking and eliminating erroneous questionnaires, the study collected 858 complete questionnaires, equivalent to a rate of about 78%. In addition, the research subjects of the thesis are only people who are using mobile phones, so people who do not use mobile phones are not within the scope of the thesis, therefore, the questionnaires with the option of not using mobile phones were excluded from the scope of analysis. The number of suitable survey questionnaires included in the statistical analysis was 835.
4.1 Demographic characteristics of the sample
The structure of the survey sample is divided and statistically analyzed according to criteria such as gender, age, occupation, education level and personal income. (Detailed statistical table in Appendix 6)
- Gender structure: Of the 835 completed questionnaires, 49.8% of respondents were male, equivalent to 416 people, and 50.2% were female, equivalent to 419 people. The survey results of the study are completely consistent with the gender ratio in the population structure of Vietnam in general and Hanoi in particular (Male/Female: 49/51).
- Age structure: 36.6% of respondents are <23 years old, equivalent to 306 people. People from 23-34 years old
accounting for the highest proportion: 44.8% equivalent to 374 people, people aged 35-45 and >45 are 70 and 85 people equivalent to 8.4% and 10.2% respectively. Looking at the results of this survey, we can see that the young people - youth account for a large proportion of the total number of people participating in the survey. Meanwhile, the middle-aged people including two age groups of 35 - 45 and >45 have a low rate of participation in the survey. This is completely consistent with the reality when Mobile Marketing is identified as a Marketing service aimed at young people (people under 35 years old).
- Structure by educational level: among 835 valid responses, 541 respondents had university degrees, accounting for the highest proportion of ~ 75%, 102 had secondary school degrees, ~ 13.1%, and 93 had post-graduate degrees, ~ 11.9%.
- Occupational structure: office workers and civil servants are the group with the highest rate of participation with 39.4%, followed by students with 36.6%. Self-employed people account for 12%, retired housewives are 7.8% and other occupational groups account for 4.2%. The survey results show that the student group has the same rate as the group aged <23 at 36.6%. This shows the accuracy of the survey data. In addition, the survey results distributed by occupational criteria have a rate almost similar to the sample division rate in chapter 3. Therefore, it can be concluded that the survey data is suitable for use in analysis activities.
- Income structure: the group with income from 3 to 5 million has the highest rate with 39% of the total number of respondents. This is consistent with the income structure of Hanoi people and corresponds to the average income of the group of civil servants and office workers. Those
People with no income account for 23%, income under 3 million VND accounts for 13% and income over 5 million VND accounts for 25%.
4.2 Mobile phone usage in Hanoi inner city area
According to the survey results, most respondents said they had used the phone for more than 1 year, specifically: 68.4% used mobile phones from 4 to 10 years, 23.2% used from 1 to 3 years, 7.8% used for more than 10 years. Those who used mobile phones for less than 1 year accounted for only a very small proportion of ~ 0.6%. (Table 4.1)
Table 4.1: Time spent using mobile phones
Frequency
Ratio (%)
Valid Percentage
Cumulative Percentage
Alid
<1 year
5
.6
.6
.6
1-3 years
194
23.2
23.2
23.8
4-10 years
571
68.4
68.4
92.2
>10 years
65
7.8
7.8
100.0
Total
835
100.0
100.0
The survey indexes on the time of using mobile phones of consumers in the inner city of Hanoi are very impressive for a developing country like Vietnam and also prove that Vietnamese consumers have a lot of experience using this high-tech device. Moreover, with the majority of consumers surveyed having a relatively long time of use (4-10 years), it partly proves that mobile phones have become an important and essential item in people's daily lives.
When asked about the mobile phone network they are using, 31% of respondents said they are using the network of Vietel company, 29% use the network of
of Mobifone company, 27% use Vinaphone company's network and 13% use networks of other providers such as E-VN telecom, S-fone, Beeline, Vietnammobile. (Figure 4.1).
Figure 4.1: Mobile phone network in use
Compared with the announced market share of mobile telecommunications service providers in Vietnam (Vietel: 36%, Mobifone: 29%, Vinaphone: 28%, the remaining networks: 7%), we see that the survey results do not have many differences. However, the statistics show that there is a difference in the market share of other networks because the Hanoi market is one of the two main markets of small networks, so their market share in this area will certainly be higher than that of the whole country.
According to a report by NielsenMobile (2009) [8], the number of prepaid mobile phone subscribers in Hanoi accounts for 95% of the total number of subscribers, however, the results of this survey show that the percentage of prepaid subscribers has decreased by more than 20%, only at 70.8%. On the contrary, the number of postpaid subscribers tends to increase from 5% in 2009 to 19.2%. Those who are simultaneously using both types of subscriptions account for 10%. (Table 4.2).
Table 4.2: Types of mobile phone subscribers
Frequency
Ratio (%)
Valid Percentage
Cumulative Percentage
Valid
Prepay
591
70.8
70.8
70.8
Pay later
160
19.2
19.2
89.9
Both of the above
84
10.1
10.1
100.0
Total
835
100.0
100.0
The above figures show the change in the psychology and consumption habits of Vietnamese consumers towards mobile telecommunications services, when the use of prepaid subscriptions and junk SIMs is replaced by the use of two types of subscriptions for different purposes and needs or switching to postpaid subscriptions to enjoy better customer care services.
In addition, the majority of respondents have an average spending level for mobile phone services from 100 to 300 thousand VND (406 ~ 48.6% of total respondents). The high spending level (> 500 thousand VND) is the spending level with the lowest number of people with only 8.4%, on the contrary, the low spending level (under 100 thousand VND) accounts for the second highest proportion among the groups of respondents with 25.4%. People with low spending levels mainly fall into the group of students and retirees/housewives - those who have little need to use or mainly use promotional SIM cards. (Table 4.3).
Table 4.3: Spending on mobile phone charges
Frequency
Ratio (%)
Valid Percentage
Cumulative Percentage
Valid
<100,000
212
25.4
25.4
25.4
100-300,000
406
48.6
48.6
74.0
300,000-500,000
147
17.6
17.6
91.6
>500,000
70
8.4
8.4
100.0
Total
835
100.0
100.0
The statistics in Table 4.3 are similar to the percentages in the NielsenMobile survey results (2009) with 73% of mobile phone users having medium spending levels and only 13% having high spending levels.
The survey results also showed that up to 31% ~ nearly one-third of respondents said they sent more than 10 SMS messages/day, meaning that on average they sent 1 SMS message for every working hour. Those with an average SMS message volume (from 3 to 10 messages/day) accounted for 51.1% and those with a low SMS message volume (less than 3 messages/day) accounted for 17%. (Table 4.4)
Table 4.4: Number of SMS messages sent per day
Frequency
Ratio (%)
Valid Percentage
Cumulative Percentage
Valid
<3 news
142
17.0
17.0
17.0
3-10 news
427
51.1
51.1
68.1
>10 news
266
31.9
31.9
100.0
Total
835
100.0
100.0
Similar to sending messages, those with an average message receiving rate (from 3-10 messages/day) accounted for the highest percentage of ~ 55%, followed by those with a high number of messages (over 10 messages/day) ~ 24% and those with a low number of messages received daily (under 3 messages/day) remained at the bottom with 21%. (Table 4.5)
Table 4.5: Number of SMS messages received per day
Frequency
Ratio (%)
Valid Percentage
Cumulative Percentage
Valid
<3 news
175
21.0
21.0
21.0
3-10 news
436
55.0
55.0
76.0
>10 news
197
24.0
24.0
100.0
Total
835
100.0
100.0
When comparing the data of the two result tables 4.4 and 4.5, we can see the reasonableness between the ratio of the number of messages sent and the number of messages received daily by the interview participants.
4.3 Current status of SMS advertising and Mobile Marketing
According to the interview results, in the 3 months from the time of the survey and before, 94% of respondents, equivalent to 785 people, said they received advertising messages, while only a very small percentage of 6% (only 50 people) did not receive advertising messages (Table 4.6).
Table 4.6: Percentage of people receiving advertising messages in the last 3 months
Frequency
Ratio (%)
Valid Percentage
Cumulative Percentage
Valid
Have
785
94.0
94.0
94.0
Are not
50
6.0
6.0
100.0
Total
835
100.0
100.0
The results of Table 4.6 show that consumers in the inner city of Hanoi are very familiar with advertising messages. This result is also the basis for assessing the knowledge, experience and understanding of the respondents in the interview. This is also one of the important factors determining the accuracy of the survey results.
In addition, most respondents said they had received promotional messages, but only 24% of them had ever taken the action of registering to receive promotional messages, while 76% of the remaining respondents did not register to receive promotional messages but still received promotional messages every day. This is the first sign indicating the weaknesses and shortcomings of lax management of this activity in Vietnam. (Table 4.7)
div.maincontent .s1 { color: black; font-family:"Times New Roman", serif; font-style: italic; font-weight: normal; text-decoration: none; font-size: 14pt; } div.maincontent .s2 { color: black; font-family:"Times New Roman", serif; font-style: normal; font-weight: bold; text-decoration: none; font-size: 14pt; } div.maincontent .s3 { color: black; font-family:"Times New Roman", serif; font-style: normal; font-weight: bold; text-decoration: none; font-size: 14pt; } div.maincontent .p { color: black; font-family:"Times New Roman", serif; font-style: normal; font-weight: normal; text-decoration: none; font-size: 14pt; margin:0pt; } div.maincontent p { color: black; font-family:"Times New Roman", serif; font-style: normal; font-weight: normal; text-decoration: none; font-size: 14pt; margin:0pt; } div.maincontent .s4 { color: black; font-family:"Times New Roman", serif; font-style: normal; font-weight: normal; text-decoration: none; font-size: 9.5pt; vertical-align: 6pt; } div.maincontent .s5 { color: black; font-family:"Times New Roman", serif; font-style: normal; font-weight: bold; text-decoration: none; font-size: 14pt; } div.maincontent .s6 { color: black; font-family:"Times New Roman", serif; font-style: normal; font-weight: bold; text-decoration: none; font-size: 14pt; } div.maincontent .s7 { color: black; font-family:"Times New Roman", serif; font-style: italic; font-weight: normal; text-decoration: none; font-size: 14pt; } div.maincontent .s8 { color: black; font-family:"Times New Roman", serif; font-style: italic; font-weight: bold; text-decoration: none; font-size: 14pt; } div.maincontent .s9 { color: black; font-family:Arial, sans-serif; font-style: normal; font-weight: normal; text-decoration: none; font-size: 14pt; } div.maincontent .s10 { color: black; font-family:Arial, sans-serif; font-style: normal; font-weight: normal; text-decoration: none; font-size: 12pt; } div.maincontent .s11 { color: black; font-family:"Times New Roman", serif; font-style: normal; font-weight: normal; font-size: 14pt; } div.maincontent .s12 { color: black; font-family:Arial, sans-serif; font-style: normal; font-weight: normal; text-decoration: none; font-size: 14pt; } div.maincontent .s13 { color: black; font-family:"Times New Roman", serif; font-style: normal; font-weight: normal; text-decoration: none; font-size: 14pt; } div.maincontent .s14 { color: black; font-family:"Times New Roman", serif; font-style: normal; font-weight: bold; text-decoration: none; font-size: 13pt; } div.maincontent .s15 { color: black; font-family:"Times New Roman", serif; font-style: italic; font-weight: normal; text-decoration: none; font-size: 9.5pt; vertical-align: 6pt; } div.maincontent .s16 { color: black; font-family:"Times New Roman", serif; font-style: normal; font-weight: normal; text-decoration: none; font-size: 5.5pt; vertical-align: 3pt; } div.maincontent .s17 { color: black; font-family:"Times New Roman", serif; font-style: normal; font-weight: normal; text-decoration: none; font-size: 8.5pt; } div.maincontent .s18 { color: black; font-family:"Times New Roman", serif; font-style: italic; font-weight: bold; font-size: 14pt; } div.maincontent .s19 { color: black; font-family:"Times New Roman", serif; font-style: normal; font-weight: bold; font-size: 14pt; } div.maincontent .s20 { color: black; font-family:"Times New Roman", serif; font-style: italic; font-weight: normal; text-decoration: none; font-size: 13pt; } div.maincontent .s21 { color: black; font-family:"Times New Roman", serif; font-style: normal; font-weight: normal; text-decoration: none; font-size: 14pt; } div.maincontent .s22 { color: black; font-family:"Courier New", monospace; font-style: normal; font-weight: normal; text-decoration: none; font-size: 14pt; } div.maincontent .s23 { color: black; font-family:"Times New Roman", serif; font-style: normal; font-weight: normal; text-decoration: none; font-size: 13pt; } div.maincontent .s24 { color: black; font-family:"Times New Roman", serif; font-style: italic; font-weight: normal; text-decoration: none; font-size: 13pt; } div.maincontent .s25 { color: black; font-family:"Times New Roman", serif; font-style: normal; font-weight: bold; text-decoration: none; font-size: 14pt; } div.maincontent .s26 { color: black; font-family:"Times New Roman", serif; font-style: normal; font-weight: normal; text-decoration: none; font-size: 14pt; } div.maincontent .s27 { color: black; font-family:"Times New Roman", serif; font-style: normal; font-weight: normal; text-decoration: none; font-size: 1.5pt; } div.maincontent .s28 { color: black; font-family:"Times New Roman", serif; font-style: normal; font-weight: normal; text-decoration: none; font-size: 11pt; } div.maincontent .s29 { color: black; font-family:"Times New Roman", serif; font-style: normal; font-weight: bold; text-decoration: none; font-size: 13pt; } div.maincontent .s30 { color: black; font-family:"Times New Roman", serif; font-style: italic; font-weight: bold; text-decoration: none; font-size: 13pt; } div.maincontent .s31 { color: black; font-family:"Times New Roman", serif; font-style: normal; font-weight: normal; text-decoration: none; font-size: 13pt; } div.maincontent .s32 { color: black; font-family:Arial, sans-serif; font-style: normal; font-weight: normal; text-decoration: none; font-size: 10.5pt; } div.maincontent .s33 { color: black; font-family:Arial, sans-serif; font-style: normal; font-weight: normal; text-decoration: none; font-size: 11pt; } div.maincontent .s35 { color: black; font-family:Arial, sans-serif; font-style: normal; font-weight: bold; text-decoration: none; font-size: 10.5pt; } div.maincontent .s36 { color: #F00; font-family:Arial, sans-serif; font-style: italic; font-weight: bold; text-decoration: none; font-size: 10.5pt; } div.maincontent .s37 { color: black; font-family:Arial, sans-serif; font-style: normal; font-weight: bold; text-decoration: none; font-size: 10.5pt; } div.maincontent .s38 { color: black; font-family:"Times New Roman", serif; font-style: normal; font-weight: bold; text-decoration: none; font-size: 8.5pt; vertical-align: 5pt; } div.maincontent .s39 { color: black; font-family:Arial, sans-serif; font-style: normal; font-weight: normal; text-decoration: none; font-size: 10.5pt; } div.maincontent .s40 { color: black; font-family:Arial, sans-serif; font-style: normal; font-weight: normal; text-decoration: none; font-size: 7pt; vertical-align: 4pt; } div.maincontent .s41 { color: black; font-family:Arial, sans-serif; font-style: normal; font-weight: bold; text-decoration: none; font-size: 10.5pt; } div.maincontent .s42 { color: black; font-family:Arial, sans-serif; font-style: normal; font-weight: bold; text-decoration: none; font-size: 11pt; } div.maincontent .s43 { color: black; font-family:Arial, sans-serif; font-style: normal; font-weight: bold; text-decoration: none; font-size: 7.5pt; vertical-align: 5pt; } div.maincontent .s44 { color: black; font-family:Arial, sans-serif; font-style: normal; font-weight: normal; text-decoration: none; font-size: 7pt; vertical-align: 5pt; } div.maincontent .s45 { color: #F00; font-family:Arial, sans-serif; font-style: normal; font-weight: bold; text-decoration: none; font-size: 10.5pt; } div.maincontent .s46 { color: black; font-family:Arial, sans-serif; font-style: normal; font-weight: bold; text-decoration: none; font-size: 7pt; vertical-align: 5pt; } div.maincontent .s47 { color: black; font-family:Arial, sans-serif; font-style: normal; font-weight: bold; text-decoration: none; font-size: 11pt; } div.maincontent .s48 { color: black; font-family:"Times New Roman", serif; font-style: normal; font-weight: normal; text-decoration: none; font-size: 14pt; } div.maincontent .s49 { color: black; font-family:"Times New Roman", serif; font-style: italic; font-weight: normal; text-decoration: none; font-size: 9.5pt; vertical-align: -2pt; } div.maincontent .s50 { color: black; font-family:"Times New Roman", serif; font-style: normal; font-weight: normal; text-decoration: none; font-size: 9.5pt; } div.maincontent .s51 { color: black; font-family:"Times New Roman", serif; font-style: italic; font-weight: normal; text-decoration: none; font-size: 9.5pt; vertical-align: -1pt; } div.maincontent .s52 { color: black; font-family:"Times New Roman", serif; font-style: normal; font-weight: normal; text-decoration: none; font-size: 9.5pt; vertical-align: -2pt; } div.maincontent .s53 { color: black; font-family:"Times New Roman", serif; font-style: normal; font-weight: normal; text-decoration: none; font-size: 13pt; } div.maincontent .s54 { color: black; font-family:"Times New Roman", serif; font-style: normal; font-weight: normal; text-decoration: none; font-size: 9.5pt; vertical-align: -1pt; } div.maincontent .s55 { color: black; font-family:Arial, sans-serif; font-style: normal; font-weight: normal; text-decoration: none; font-size: 10.5pt; } div.maincontent .s56 { color: #00F; font-family:"Times New Roman", serif; font-style: normal; font-weight: normal; font-size: 14pt; } div.maincontent .s57 { color: #00F; font-family:"Times New Roman", serif; font-style: normal; font-weight: normal; text-decoration: none; font-size: 14pt; } div.maincontent .s58 { color: #00F; font-family:"Times New Roman", serif; font-style: normal; font-weight: normal; font-size: 14pt; } div.maincontent .s59 { color: #00F; font-family:"Times New Roman", serif; font-style: normal; font-weight: normal; text-decoration: none; font-size: 13pt; } div.maincontent .s60 { color: #00F; font-family:"Times New Roman", serif; font-style: normal; font-weight: normal; font-size: 13pt; } div.maincontent .s61 { color: black; font-family:"Times New Roman", serif; font-style: normal; font-weight: bold; text-decoration: none; font-size: 14pt; } div.maincontent .s62 { color: black; font-family:"Times New Roman", serif; font-style: italic; font-weight: bold; text-decoration: none; font-size: 14pt; } div.maincontent .s63 { color: black; font-family:"Times New Roman", serif; font-style: italic; font-weight: bold; text-decoration: none; font-size: 14pt; } div.maincontent .content_head2 { color: #F00; font-family:"Times New Roman", serif; font-style: normal; font-weight: bold; text-decoration: none; font-size: 14pt; } div.maincontent .s64 { color: black; font-family:"Times New Roman", serif; font-style: italic; font-weight: bold; text-decoration: none; font-size: 13pt; } div.maincontent .s67 { color: black; font-family:Arial, sans-serif; font-style: normal; font-weight: normal; text-decoration: none; font-size: 9.5pt; } div.maincontent .s68 { color: black; font-family:"Times New Roman", serif; font-style: normal; font-weight: bold; text-decoration: none; font-size: 12pt; } div.maincontent .s69 { color: black; font-family:"Times New Roman", serif; font-style: italic; font-weight: normal; text-decoration: none; font-size: 12pt; } div.maincontent .s70 { color: black; font-family:"Times New Roman", serif; font-style: normal; font-weight: normal; tex -
 The Research Results of the Thesis Are Consistent with the Stated Scientific Hypothesis, and the Tasks of the Topic Have Been Solved.
 -
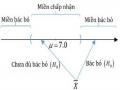 Hypothesis Testing for a Population Proportion Value.
 -
 Research on extraction and purification of conessin, kaempferol, nuciferin from medicinal herbs as reference standards in drug testing - Hoang Thi Tuyet Nhung - 30
 -
 Foreign Research on Factors Affecting Commercial Bank Business Performance

Note: P-values are shown in parentheses. (**) 5% significance level.
Source: Author calculated from research data sample using STATA software.
Through Table 4.14, the results of testing hypothesis H1 show that the H-Statistic value of the Vietnamese commercial banking market is H -TTNHVN = 0.543, in which the contribution of the foreign banks group is H -NHNNg = 0.169, greater than 0 and statistically significant at 95%, which is the basis for accepting hypothesis H1. This shows that the penetration of foreign banks increases the level of competition in the Vietnamese commercial banking market in the period 2009 - 2019.
The research results of this thesis are consistent with some international studies that have been conducted (Cho, 1990; Diallo, 2016; Jeon et al., 2011; Mulyaningsih et al., 2015; Yin, 2020).
Cho (1990) showed that the entry of foreign banks increased the competitiveness of the Indonesian banking market. The results of Jeon et al. (2011) also showed that the presence of foreign banks increased the level of competition in the banking markets of 17 emerging economies in Asia and Latin America.
Recent studies such as Mulyaningsih et al. (2015) also found that foreign bank penetration increased the competitiveness of the Indonesian banking market. Diallo’s (2016) study in 34 African countries, and (Yin, 2020) study in developing countries also showed similar results.
However, the results of this study are completely contrary to the studies of Yeyati and Micco (2007) and Poghosyan and Poghosyan (2010). The results of Yeyati and Micco (2007) showed that the increased presence of foreign banks reduces the level of competition in the banking market in 8 emerging countries in Latin America, or Poghosyan and Poghosyan (2010) argued that the penetration of foreign banks through mergers and acquisitions reduces the level of competition in the banking market of 11 transition economies in Central and Eastern Europe.
The research results on this topic can be explained based on the penetration method of foreign banks. If foreign banks penetrate by establishing new business establishments, it will increase competition in the domestic banking market; if they penetrate by acquiring and merging, it will reduce competition in the domestic banking market. The reason is that when penetrating by establishing new business establishments, foreign banks do not have available customer sources, so they will focus on finding customers (advertising, marketing, service prices, product differentiation, etc.) to gain market share, leading to increased competition; while penetrating by acquiring and merging, foreign banks already have available customer sources, so gaining market share will be less likely. In addition, if the acquisition and merger process of foreign banks
Large-scale mergers will lead to the formation of banking monopolies, and as a result the banking market becomes less competitive.
In Vietnam, foreign banks' penetration is mainly done by establishing new business establishments. During the research period of 2009-2019, 9 100% foreign-owned banks were established and put into operation, the number of foreign banks' branches increased from 40 in 2009 to 49 in 2019. Meanwhile, foreign banks only penetrated by acquiring shares of domestic banks in 5 deals (Common Wealth of Australia bought shares of VIB in 2010, International Finance Corporation bought shares of Vietinbank and Mizuho Bank bought shares of Vietcombank in 2011, Bank of Tokyo Mitsubishi UFJ bought shares of Vietinbank in 2012, KEB Hana bought shares of BIDV in 2019), but there were 7 foreign banks' divestment deals from domestic banks (ANZ bank divested from Sacombank in 2012, OCBC divested from VP bank in 2013, HSBC divested from Techcombank in 2016, Commonwealth Bank of Australia at VIB In 2017, Standard Chartered divested from ACB and BNP Paribas divested from OCB in 2018, Société Générale Group divested from SeaABank in 2019). Thus, the research results of the thesis are consistent with the practical penetration methods of foreign banks in Vietnam.
In summary, the results of this study are the basis for accepting hypothesis H1, answering RQ1 that the penetration of foreign banks increases the level of competition in the Vietnamese commercial banking market. At the same time, the findings of the study demonstrate the consistency with the theory on the impact of foreign bank penetration on increasing the competitiveness of the domestic banking market.
4.3. RESEARCH RESULTS FOR RQ2
This section tests hypothesis H2 as a basis for answering RQ2. As presented in Section 3.2, this study uses a 2-step analysis process: (i) determining the efficiency of domestic commercial banks using 2 methods: financial index method and DEA method, (ii) efficiency indicators will be regressed with variables
foreign bank penetration. The regression coefficients of foreign bank penetration variables are the basis for testing hypothesis H2.
4.3.1. Measuring foreign bank penetration in Vietnam
This section presents the measurement of variables representing foreign bank penetration ( FBA, NFB ) in Models 3.4 and 3.6. The method of measuring foreign bank penetration has been presented in Section 3.2.1, Chapter 3. Accordingly, this study uses a composite method with 2 variables: the ratio of foreign bank assets ( FBA ), and the ratio of the number of foreign banks ( NFB ) (Table 4.15).
Table 4.15: Penetration variables of foreign banks in Vietnam in the period 2009 - 2019
Year | FBA | NFB |
2009 | 3.5% | 53.2% |
2010 | 4.5% | 58.0% |
2011 | 4.4% | 59.6% |
2012 | 4.6% | 59.8% |
2013 | 4.2% | 62.0% |
2014 | 12.3% | 59.6% |
2015 | 10.8% | 62.4% |
2016 | 10.2% | 62.8% |
2017 | 9.9% | 63.2% |
2018 | 10.0% | 63.2% |
2019 | 10.0% | 63.2% |
Medium | 7.7% | 60.6% |
Source: Author compiled from SBV annual report. | ||
The foreign bank asset ratio variable is calculated by dividing the total assets of the foreign bank sector by the total assets of the entire industry. The foreign bank asset ratio has tripled from 3.5% in 2009 to 12.3% in 2014. From 2015 to 2019, the foreign bank asset ratio accounted for 10% to 11% of total assets, down from 1% to 2% compared to 2014. The average foreign bank asset ratio during the study period was 7.7%.
The number of foreign banks is calculated by dividing the number of foreign banks by the total number of banks in the industry. In 2009, the number of foreign banks including foreign bank branches accounted for 53.2% of the total number of banks. By 2016, the number of foreign banks increased by 10% to 63.2%. From 2016 to 2019, the number of foreign banks was stable at 63%. The average number of foreign banks during the research period was 60.6%.
4.3.2. Efficiency of Vietnamese commercial banks by financial index method
To determine the efficiency of Vietnamese commercial banks using the financial index method, this thesis uses the ROA variable as presented in Section 3.2.1, Chapter 3. The average pre-tax profit margin on assets by year in the research period 2009 - 2019 is presented in Table 4.16.
Table 4.16: Average return on assets for the period 2009 - 2019
Year | ROA (%) |
2009 | 1.65% |
2010 | 1.57% |
2011 | 1.30% |
2012 | 1.00% |
2013 | 0.77% |
2014 | 0.68% |
2015 | 0.51% |
2016 | 0.65% |
2017 | 0.71% |
2018 | 0.90% |
2019 | 1.23% |
Medium | 1.00% |
Source: Author calculated from research data sample using STATA software. | |
The average return on total assets during the study period was nearly 1%. The average return on total assets peaked in 2009 at 1.65%. In the following years, the average return on total assets continuously decreased and reached its lowest level in 2015 at 0.51%. From 2016 to 2019, the average return on total assets tended to increase, reaching 1.23% in 2019.
4.3.3. Efficiency of Vietnamese commercial banks by data envelopment method
To determine the efficiency of Vietnamese commercial banks using the DEA method, the thesis uses the input minimization model and assumes that efficiency varies with scale. The input and output variables in the DEA model are selected according to the intermediate approach with 3 input variables: interest expenses, staff expenses, other expenses, and 2 output variables: interest income and non-interest income according to detailed analysis in Section 3.2.2.2.
The data used in the DEA model includes 30 Vietnamese commercial banks in the period 2009 - 2019 with 315 observations. Descriptive statistics of input and output variables in the DEA model are presented in Table 4.17.
Table 4.17: Descriptive statistics of variables in DEA model
Variable | Value smallest | Value biggest | Central jar | Deviation standard | Number of officials close |
Input (billion VND) | |||||
Interest expense | 139 | 64,769 | 9,449 | 11,839 | 315 |
Employee costs | 33 | 14,530 | 1,693 | 2,477 | 315 |
Other costs | 31 | 11,333 | 1,645 | 2,047 | 315 |
Output (billion VND) | |||||
Earn interest | 271 | 106,468 | 14,621 | 19,130 | 315 |
Non-interest income | -940 | 17,274 | 1,615 | 2,525 | 315 |
Source: Author calculated from research data sample using STATA software. | |||||
Table 4.18 presents the average technical efficiency measure of Vietnamese commercial banks during the research period 2009 - 2019.
Table 4.18: Average technical efficiency in the period 2009 - 2019
Year | TE |
2009 | 94% |
2010 | 95% |
2011 | 97% |
2012 | 97% |
2013 | 95% |
2014 | 94% |
2015 | 94% |
2016 | 95% |
2017 | 95% |
2018 | 94% |
2019 | 96% |
Medium | 95% |
Source: Author calculated from research data sample using STATA software. | |
The average technical efficiency of Vietnamese commercial banks was lowest in the research period at 94% in 2009, then increased from 94% to the highest level of 97% in 2011 - 2012. From 2013 to 2019, technical efficiency continuously fluctuated between 94% and 96%. The average technical efficiency in the research period 2009 - 2019 was 95%. This means that to produce the same level of output, banks used 95% of the inputs, or in other words, banks still wasted about 5% of inputs. The relatively high average technical efficiency shows that Vietnamese commercial banks have focused on effectively managing input resources in the business operation process.
4.3.4. Testing the stationarity of panel data series
This section performs a stationarity check of panel data series to ensure the accuracy of the regression method similar to the analysis steps of Model 3.2 presented in Section 4.2.