- Self-study | Energy, factors affecting power transmission lines: X, R, L... - Read the user manual and assembly procedures. of the model. | ||
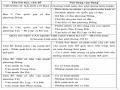
12 | Lesson 45, 46, 47, 48: Practice Transformer model | - Teaching in workshops, group practice. - Self-study | - Prepare and read in advance: MBA structure, transformer station capacity selection... incidents that damage MBA - Read the user manual and assembly procedures. of the model. |
13 | Lesson 49, 50, 51, 52: Practice on Transformer Station Model | - Teaching in workshops, group practice. - Self-study | - Prepare and read in advance: Structure and selection of B/A station, operating principles of the station, types of B/A stations - Read the document user manual, |
Maybe you are interested!
-
 Teaching Process of Science Subject Using Btnb Method
 -
 Managing the teaching of History subject in the experiential direction at secondary schools in Dong Trieu town, Quang Ninh province - 2
 -
 Fostering students' self-study ability in teaching some knowledge of Mechanics and Electromagnetism in high school Physics with the support of social network Facebook - 21
 -
 Organizing Workshops, Training and Lectures to Disseminate and Share Network Resources and Teaching Methods Using IT
 -
 Basic Knowledge Content That Can Be Applied Storymap When Teaching About World Civilizations Of The General Education Program High School History Subject

installation procedures assembly of the model. | |||
14 | Lesson 53, 54, 55, 56: Practicing the Synchronization model | - Teaching in workshops, group practice. - Self-study | - Prepare and read in advance: Principles of synchronization, factors affecting synchronization. - Read the user manual and installation procedures. assembly of the model. |
15 | Lesson 57, 58: Review Lesson 59, 60: Test | Workshop teaching, sharing practice group | Review and test |
Lam Dong, date month year 2021
Board of Directors, Faculty, Compiled by Lecturers
APPENDIX 7
Brief description of the steps performed using Excel software is as follows :
1) Enter data in Excel: Open TN data file; create TN column and DC column; paste each student's score into the corresponding column (no need to arrange in student order, no need to write student name).
2) Create a TN distribution table, frequency table f(%), progressively convergent frequency table f a and draw charts and graphs in Excel
- Create a score frequency distribution table F i (number of students achieving score X i ), select the output output cell, enter the command: =COUNTIF (address of the first cell of the score column: address of the last cell of the score column, score value X i needs to be counted), for example =COUNTIF(A2:A34, 4), in which A2 is the address of the first cell of the score column, A34 is the address of the last cell of the score column, Xi = 4 is the score that needs to be counted.
- Create a frequency table f i (%) (% of students with score X i ), select the output output address cell, type the command: = cell address containing score frequency Xi×l00/N, for example =G19×100/33 click and drag to the remaining cells: in which G19 is the address cell containing score frequency Xi, N= 33 total number of students.
- Make a progressive convergence frequency table f a (% of students with score X i or higher): select the location cell
corresponding to point 1 in TN and DC class, enter: 100; in the address box corresponding to point 2, enter the command: = address of the cell corresponding to point 1 just entered 100 - address of point 1 cell in the frequency table. Use the mouse to drag and drop until all the point address boxes are filled.
- Draw a frequency distribution characteristic chart, draw a progressive convergence frequency curve. Select the frequency result block or the progressive convergence frequency of the class TN class.
DC (start cell address: end cell address of the frequency table or progressive convergence frequency table). Click on the Chat Wizard icon on the toolbar to select the required chart type, then click Next and finally click Finish.
3) Processing data of centripetal tendency measurements, calculating parameters
Statistical feature numbers using Excel:
- Calculate the values of mean, median, mode, standard deviation, variance, kurtosis, skewness (coefficient of asymmetry compared to normal distribution), range, maximum value, minimum value, sum, number of samples (count), and 95% confidence interval of the mean.
Select menu: Tools/Data Analysis…/Descriptive Statistics
Enter the following items:
+ Input Range: absolute address containing data
+ Output Range: output address
+ Confidence Level for Mean
Results of calculation of statistical characteristic parameters
Parameters | Corresponding function | Result value | |
Mean X | Average value | AVERAGE | |
Median | Median | MEDIAN | |
Mode | Mode | MODE | |
Standard Deviation | Standard deviation | STDEV | |
Sample Variance | Sample variance | VAR | |
Kurtosis | Sharpness of peak | KURT | |
Skewness | Inclination | SKEW | |
Range | Range of variation | MAX()-MIN() | |
Minimum | Minimum | MAX | |
Maximum | Maximum | MIN | |
Sum | Total | SUM | |
Count (N) | Number of samples | COUNT | |
Confidence Level(95.0%) | Accuracy | CONFIDENCE |
Table 1. Description of results and corresponding functions in Excel
- When the number of calculated samples N ≥ 30; calculate the average score (Mean): is the average value of the scores to determine the level of achievement of the students' tests; use z-Test (z-Test two Samples for Means).
Select menu: Tools/Data Analysis…/z-test:Two Sample for Means
Data entry and processing:
+ Variable 1 Range , Variable 2 Range: absolute address of data area
+ Variable 1 Variance(known), Variable 2 Variance(known): respective variances of experimental class and control class
+ Labels: select when there is a variable name at the top of the column or row
+ Alpha: significance level (usually 0.05)
+ Output options: choose how to output results
z-Test: Two Sample for Means
Address | TN | |
Mean ( X TN and X DC ) | ||
Known Vanance | ||
Observations | ||
Hypothesized Mean Difference (H 0 ) | ||
Z (The number z = U) | ||
P(z<=z) one-tail (One-tail probability of z) | ||
z Critical one-ear (Standard z- score calculated by XS 0.05) | ||
P(z<=z) two-tail (Two-tail probability of the calculated z value) | ||
Cntical two-tail (Standard z-score SX 0.05 two-tail) | ||
H 0 is rejected because the absolute value of z (U) > 1 .96 |
Table 2. Description of hypothesis testing results
- Use the U criterion to test the hypothesis H 0 (μ1 = μ2) about the equality of two overall means, the experimental and control classes, with N ≥30 and the overall variance known by replacing the two sample variances (Sample Variance) of the experimental and control classes.
If │U│ < 1.96, then X TN and X DC are not significantly different. The two research results are considered the same. Accept the hypothesis H 0 .
If │U│ > 1.96, then X TN, X DC, are significantly different. The two research results cannot be considered the same. Reject the null hypothesis H 0 . This means that the sample with larger X has better quality. This conclusion has a confidence level of 95%.
APPENDIX 8
RESULTS OF STATISTICAL DATA PROCESSING ON THE SCORES OF THE EXPERIMENTAL AND CONTROL GROUPS BEFORE THE EXPERIMENT IN ROUND 1
Independent Samples Test
Levene's Test for Equality of Variances | t-test for Equality of Means | ||||||||
F | Sig. | t | df | Sig. (2-tailed) | Mean Difference | Std. Error Difference | 95% Confidence Interval of the Difference | ||
Lower | Upper | ||||||||
Equal variances assumed | ,421 | ,517 | 1,008 | 364 | ,314 | ,16165 | ,16031 | -,15361 | ,47691 |
Point | |||||||||
Equal variances not assumed | 1,009 | 363,999 | ,314 | ,16165 | ,16022 | -,15343 | ,47673 | ||
APPENDIX 9
RESULTS OF STATISTICAL DATA PROCESSING ON THE SCORES OF THE EXPERIMENTAL AND CONTROL GROUPS AFTER THE EXPERIMENT ROUND 1
Independent Samples Test
Levene's Test for Equality of Variances | t-test for Equality of Means | ||||||||
F | Sig. | t | df | Sig. (2- tailed) | Mean Difference | Std. Error Difference | 95% Confidence Interval of the Difference | ||
Lower | Upper | ||||||||
Equal variances assumed | 8,079 | ,005 | 5,701 | 362 | ,000 | ,909 | ,160 | ,596 | 1,223 |
Point | |||||||||
Equal variances not assumed | 5,716 | 345,351 | ,000 | ,909 | ,159 | ,596 | 1,222 | ||