9
La | 99.6 | Patch | 0 | 99.6 | |
Nd | 99.7 | Patch | 0 | 99.7 | |
Y | 99.9 | Patch | 0 | 99.9 | |
Ce(IV) | 0 | 0 | 0 | 0 | |
Th | 29.8 | 19.5 | 13.3 | 62.6 | |
10 | La | 99.8 | Patch | 0 | 99.8 |
Nd | 99.7 | Patch | 0 | 99.7 | |
Y | 99.6 | Patch | 0 | 99.6 | |
Ce(IV) | 0 | 0 | 0 | 0 | |
Th | 38.6 | 30.2 | 15.2 | 84.0 | |
11 | La | 99.9 | Patch | 0 | 99.9 |
Nd | 99.8 | Patch | 0 | 99.8 | |
Y | 99.9 | Patch | 0 | 99.9 | |
Ce(IV) | 0 | 0 | 0 | 0 | |
Th | 48.2 | 40.7 | 7.3 | 96.2 |
Maybe you are interested!
-

 Rare earth recovery from copper ore processing waste and application as fertilizer for tea plants and some vegetables in Da Lat, Lam Dong province - 1
 -
 Study on botanical characteristics, chemical composition and acetylcholinesterase enzyme inhibitory effects of two species Piper thomsonii (C. DC.) Hook. f. var. thomsonii and Piper hymenophyllum Miq., Piperaceae family - 24
 -
 Study on chemical composition, toxicity and some biological effects supporting the treatment of gastric and duodenal ulcers of Sanchezia nobilis Hook.F. leaves - 2
 -
 Study on botanical characteristics, chemical composition and acetylcholinesterase enzyme inhibitory effects of two species Piper thomsonii (C. DC.) Hook. f. var. thomsonii and Piper hymenophyllum Miq., Piperaceae family - 23
 -
 Study on synthesis of TiO2- Fe2O3/GNP materials from ilmenite and graphite ore to orient Cr(VI) transformation in defense industrial wastewater - 8
Table 3.11 shows that when the concentration of HNO 3 increases , the ability to extract the RGO(III) increases. The RGO(III) is completely extracted from the organic phase when the concentration of HNO 3 is 5 M with one wash efficiency reaching about 99%. Th(IV) forms a stable complex with TPPO so it is extracted when the concentration of HNO 3 is from 6 M to 11 M. Ce(IV) forms a very stable complex with TPPO so it is not extracted even when using 11 M HNO 3.
3.5.2. Study on extraction of Ce(IV)
Ce(IV) is not extracted from the organic phase by 11 M HNO 3 solution. To extract, a reducing agent must be used to reduce Ce(IV) to Ce(III). In oxidation state III, the complex of Ce(III) with TPPO has the same stability as the complex of La with TPPO, so it can be easily extracted from the organic phase. According to studies [68, 77], the most suitable reducing agent for Ce(IV) to Ce(III) is 10% H 2 O 2
+ HNO 3 . Research results on the dependence of extraction efficiency of Ce(IV) from the phase
organic matter in the concentration of 10% HNO 3 + H 2 O 2 solution is shown in Table 3.12.
Extraction ability of Ce(IV) from organic phase by HNO 3 + H 2 O 2 10%
C HNO3 , M
First time, % | 2nd time, % | 3rd time, % | Total, % | |
1 | 60.4 | 24.9 | 6.8 | 92.1 |
2 | 81.5 | 11.7 | 4.2 | 97.4 |
3 | 91.4 | 7.8 | Patch | 99.2 |
4 | 96.3 | 3.1 | Patch | 99.4 |
5 | 99.4 | Patch | Patch | 99.4 |
From table 3.12, it can be seen that to extract Ce(IV) from the organic phase, it is only necessary to extract once with 5 M HNO 3 + 10% H 2 O 2 solution .
3.5.3. Study on extraction and recovery of cerium and rare earth(III) from total rare earth oxides
Sin Quyen
The results of elemental analysis of rare earths obtained from Sin Quyen copper ore processing waste by H 2 SO 4 hydrometallurgy method at 180 0 C are shown in Table 3.13.
Table 3.13. Composition of rare earth elements, U, Th in total rare earth oxides from the rare earth-rich fraction of Sin Quyen copper ore processing waste
STT
NTĐH | Content, % | STT | NTĐH | Content, % | |
1 | La | 34.10 | 10 | Cough | 0.03 |
2 | Ce | 48.82 | 11 | Er | 0.14 |
3 | Pr | 4.55 | 12 | Tm | 0.01 |
4 | Nd | 9.83 | 13 | Yb | 0.07 |
5 | Sm | 0.78 | 14 | Lu | 0.01 |
6 | EU | 0.20 | 15 | Y | 0.53 |
7 | GD | 0.60 | 16 | U | 0.008 |
8 | Tb | 0.08 | 17 | Th | 0.003 |
9 | Dy | 0.24 |
The analysis results in Table 3.13 show that in total Sin Quyen rare earth oxide, the light rare earth content is about 98.3%, of which cerium accounts for 48.82%, in addition to a trace amount of radioactive elements U and Th.
The extraction experiments to obtain cerium and clean rare earth(III) from total rare earth oxide Sin Quyen were performed under the following conditions: Rare earth concentration 0.1 M, TPPO - toluene concentration 0.5 M, HNO 3 concentration 0.5 M, Al(NO 3 ) 3 salt concentration 2 M, water/organic phase ratio 1/1, extraction with water/organic phase ratio 1/1.
Prepare a series of separatory funnels containing the same volume of rare earth solution, add the organic phase to the first funnel. After the first extraction, transfer the organic phase to the aqueous phase in the second separatory funnel. This process is repeated many times until the concentration of rare earth in the organic phase reaches saturation. The organic phase is extracted with 5 M HNO 3 solution to collect clean rare earth(III), continue to extract with 11 M HNO 3 to remove uranium, thorium and finally extract with 5 M HNO 3 + 10% H 2 O 2 solution to collect clean cerium. The results of the analysis of the total concentration of rare earth elements in the aqueous and organic phases after the extractions are presented in Table 3.14.
Table 3.14. Total concentrations of NTDH in the aqueous and organic phases after extractions
Extraction times
[Ln] (nc) , M | [Ln] (hc) , M | Extraction times | [Ln] (nc) , M | [Ln] (hc) , M | |
1 | 0.041 | 0.059 | 4 | 0.076 | 0.166 |
2 | 0.053 | 0.106 | 5 | 0.098 | 0.168 |
3 | 0.064 | 0.142 | 6 | 0.100 | 0.168 |
Experimental results showed that after 5 extractions, the concentration of NTĐH in the organic phase did not change, the system reached equilibrium.
The content of the essential elements in the aqueous and organic phases was analyzed after 5 extractions. The results of the analysis of the content of essential elements(III) and cerium in the aqueous and organic phases are presented in Table 3.15.
Table 3.15. Composition of NTĐH, U, Th in the aqueous and organic phases after 5 extractions
Original content head, % | Content in phase water, % | Content in phase organic, % | |
La | 34.10 | 56.50 | 2.14 |
Ce | 48.82 | 16.64 | 93.46 |
Pr | 4.55 | 6.98 | 0.97 |
Nd | 9.83 | 15.96 | 1.47 |
heavy | 2.70 | 3.92 | 1.96 |
Th | 0.003 | Patch | 0.0009 |
U | 0.008 | Patch | 0.0027 |
The analysis results of Table 3.15 show that the content of chromium(III) in the aqueous phase increased after extractions while the cerium content decreased, while the content of chromium(III) in the organic phase decreased while the cerium content increased. This shows that cerium at oxidation level IV was more strongly extracted into the organic phase than chromium(III) and a competitive extraction process occurred, cerium pushed chromium(III) in the organic phase down to the aqueous phase, reducing the content of chromium(III) and increasing the content of Ce(IV).
After 5 extractions in the organic phase containing mainly cerium, U, Th elements and a small amount of rare earth element (III) (2.14%), this is a clean source of cerium. The aqueous phase contains mainly rare earth element (III), does not contain U, Th elements and the remaining 16.64% cerium. This is a clean source of rare earth element (III).
To recover pure cerium, we proceed as follows: After extraction, extract the organic phase with 5 M HNO 3 solution to remove the (III) elements, increase the HNO 3 concentration to 11 M to remove Th, U, then extract with a mixed solution of 4 M HNO 3 and 10% H 2 O 2 to collect 99.9% pure cerium.
With the purpose of recovering clean rare earth(III), we proceed as follows: The water phase after 5 extractions is further extracted to transfer rare earth(III) and Ce to the organic phase, then use 5 M HNO3 solution to collect clean rare earth(III) that does not contain U, Th.
composition La = 68.8%, Pr = 8.5%, Nd = 19.4%, total heavy rare earth = 3.3% used to synthesize complexes as fertilizers for some crops.
Lactic acid is an organic acid with many important applications. Lactic acid plays an important role in many biochemical processes used in food preservation.food preservation and processing such as making yogurt, pickling, acidifying wine...Nowadays, lactic acid is used to produce biodegradable sutures or as a precursor.to produce biodegradable polymers (polylactic acid, PLA).has the ability to form strong complexes with lactic acid and is widely used in the field.division of the NTDH.
To have a basis for applying rare earth lactate complexes to stimulate plant growth, we have synthesized and studied the structure of rare earth lactate complexes using physical methods.
3.6. Synthesis and study of the structure of rare earth lactate complexes
3.6.1. Composition of the complex
After synthesizing rare earth complexes (Nd, Sm, Gd, Y, Eu, Dy) as in section
2.2.5. The complex formation reaction equation is as follows:
3CH 3 CH(OH)COOH + Ln(OH) 3[Ln(CH 3 CH(OH)COO) 3 ] + 3H 2 O
The crystalline complex was dried and elemental analysis of some rare earth lactate complexes was performed. The results of the analysis are shown in Table 3.16.
Table 3.16 . Result of composition analysis (%) of rare earth lactate complex
Recipe
hypothesis
NTĐH, % | C, % | H 2 O, % | ||||
LT | TN | LT | TN | LT | TN | |
Nd(HLac) 3 .3H 2 O | 36.16 | 35.27 | 23.21 | 21.97 | 11.61 | 10.84 |
Sm(HLac) 3 .3H 2 O | 36.99 | 35.32 | 22.91 | 21.15 | 11.46 | 10.46 |
Gd(HLac) 3 .3H 2 O | 37.90 | 36.48 | 22.58 | 20.99 | 11.29 | 10.42 |
Y(HLac) 3 .3H 2 O | 27.54 | 27.01 | 26.35 | 25.92 | 13.17 | 12.10 |
The results of the complex composition analysis table in Table 3.16 show that the experimentally determined element and water contents are relatively consistent with the theory.
3.6.2. Complex research
3.6. 1 Solubility and conductivity of complexes
To predict the ability to dissociate the complexes of NTĐH (Nd, Sm, Eu, Gd, Dy, Y) with lactic acid, we measured the conductivity of the complex solution with a concentration of 1 g/L in aqueous solvent and determined the solubility of the complexes at 25 0 C. The results are shown in Table 3.17
Table 3.17. Conductivity of the complex of NTĐH with lactic acid
Solution
Conductivity, μS.cm -1 | Molar conductivity, S.cm -1 .mol -1 | Solubility (at 25 0 C), grams/100g water | |
Nd(HLac) 3 .3H 2 O | 213 | 86.7 | Unknown |
Sm(HLac) 3 .3H 2 O | 212 | 86.3 | 1.28 |
Eu(HLac) 3 .3H 2 O | 219 | 89.1 | 0.72 |
Gd(HLac) 3 .3H 2 O | 218 | 88.7 | 0.43 |
Dy(Hlac) 3 .3H 2 O | 225 | 91.6 | 0.19 |
Y(HLac) 3 .3H 2 O | 230 | 93.6 | 0.14 |
The results from Table 3.17 show that, at very dilute concentrations, the complexes of rare earth lactate with lactic acid are water-soluble complexes and form conductive solutions, with similar molar conductivities (about 86 - 93 S.cm -1 .mol -1 ) which may indicate that these complexes have the same type of dissociation. This electrolysis may involve many complex stages, but it can be considered that the first dissociation of the complex is almost complete in dilute solutions, the subsequent dissociation steps are relatively weak, indicating that the complex is quite stable. The dissociation equation of the rare earth lactate complex can be expressed as follows:
La(HLac) 3 Ln(HLac) 2 + + Hlac -
The complexes of La, Pr, Nd are quite soluble in water, from Sm to Y the solubility decreases with decreasing ionic radius Ln 3+ .
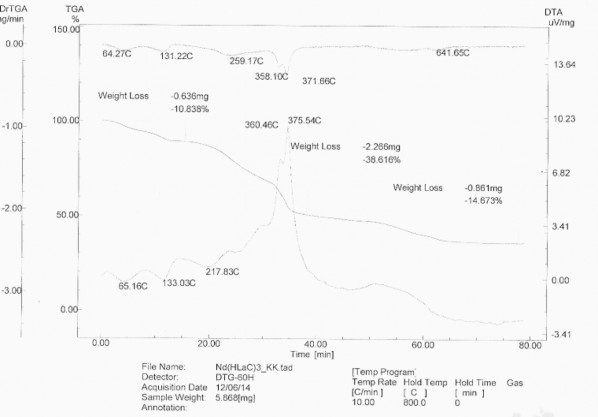
3.6.2.2. Study of complexes by thermal analysis
Thermal analysis diagram of the complexes was investigated under the same conditions, the comparison substance was Al 2 O 3 , heating rate 10 0 C/min in air, ca.
temperature from 30 0 C to 800 0 C on Labsys TG/DSC Setaram thermal analyzer (France) at Hanoi Pedagogical University. The results of thermal analysis of lactate complexes of Nd and Y are shown in Figure 3.30, 3.31 and Table 3.18.
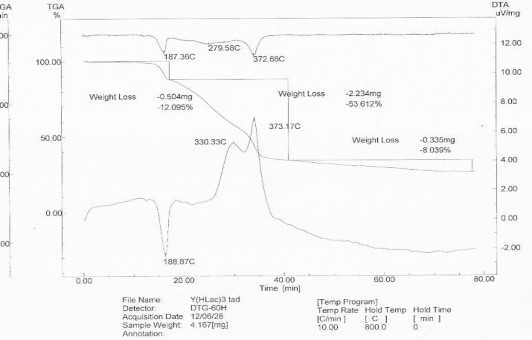
Thermal analysis diagram of Nd(HLac) 3 .3H 2 O in air
. Thermal analysis diagram of Y(HLac) 3 .3H 2 O in air