APPENDIX 4
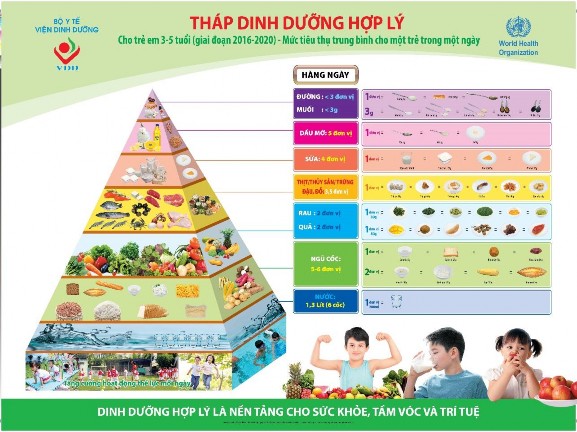
NUTRITION PYRAMID FOR VIETNAMESE CHILDREN IN THE PERIOD 2016 - 2020
APPENDIX 5
LINEAR REGRESSION ANALYSIS BETWEEN ANTHROPOLOGETIC DIMENSIONS
Appendix 5.1. Linear regression analysis with chest circumference as the dependent variable, age and weight as independent variables.
- Model summary
Model
R | R 2 | Adjusted R 2 | Std. Error of the Estimate | |
1 | 0.677 | 0.458 | 0.458 | 2,3167 |
Maybe you are interested!
-

 Initial research on Dong Ky wooden village in tourism development in the Northern Delta - 6
 -
 Local industrial development policy research applied to Bac Ninh province - 25
 -
 Initial research on Dong Ky wooden village in tourism development in the Northern Delta - 10
 -
 Research on rural tourism development in An Giang province - 19
 -
 Research on solutions for farm economic development in Dai Tu district by 2010 - 15
Adjusted R 2 correlation coefficient = 0.458, thus age and weight affected 45.8% of the change in chest circumference of children in the study.
- ANOVA analysis
Model
Sum of Squares | df | Mean Square | F | Sig. | ||
Regression | 9475,801 | 2 | 4737,901 | 882,787 | 0.000 | |
Residual | 11200,882 | 2087 | 5,367 | |||
Total | 20676,684 | 2089 |
F value = 882.787, with p < 0.05, the linear model built fits the population.
- Regression coefficient with bust circumference as dependent variable
Regression coefficient | t | p | 95%CI | |||
β | Std. Error | Lower Bound | Upper Bound | |||
Constant | 40,930 | 0.252 | 162,630 | 0.000 | 40,437 | 41,424 |
Year old | -0.167 | 0.063 | -2,623 | 0.009 | -0.291 | -0.042 |
Weight | 0.726 | 0.022 | 33,533 | 0.000 | 0.683 | 0.768 |
- Normalized residual frequency histogram Histogram
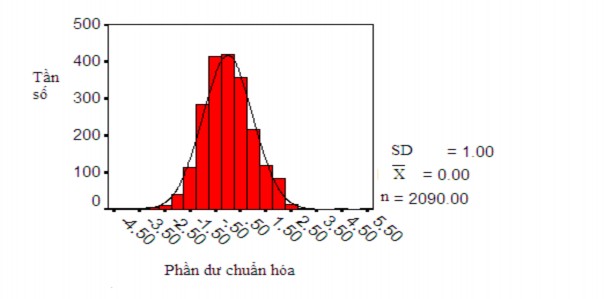
Standardized residual plot with chest circumference as the dependent variable
The standardized residual plot with chest circumference as the dependent variable shows the curve
has a bell-shaped shape that fits the graph of a normal distribution, with X = 0, SD = 1 so the assumption of a normal distribution of the residuals is not violated.
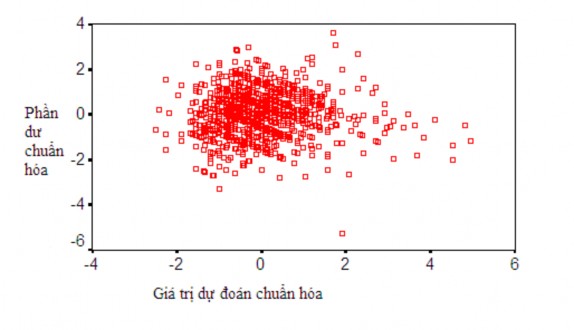
- Scatter Plot chart checks the assumption of linear relationship
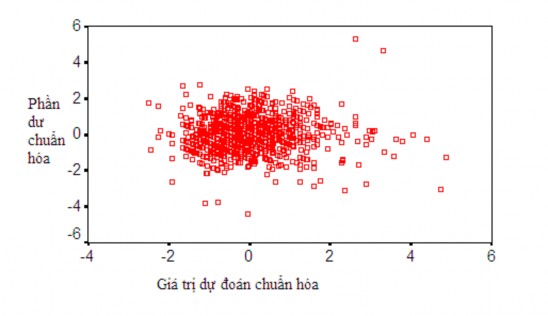
Scatter Plot with chest circumference as dependent variable
Scatter Plot with chest circumference as dependent variable shows that standardized residuals are concentrated around the zero-intercept line, thus the linearity hypothesis is not violated.
The assumptions of linear regression analysis are satisfied. Therefore, age and weight are linearly related to chest circumference according to the linear regression equation:
Chest circumference = 40.93 - 0.167*Age + 0.726*Weight
Appendix 5.2. Linear regression analysis with VCTTD as dependent variable, age and weight as independent variables.
- Model summary
Model
R | R 2 | Adjusted R 2 | Std. Error of the Estimate | |
1 | 0.598 | 0.358 | 0.357 | 1.0212 |
Adjusted R 2 correlation coefficient = 0.357, thus age and weight affected 35.7% of the change in VCTTD of children in the study.
- ANOVA analysis
Model
Sum of Squares | df | Mean Square | F | p | ||
Regression | 1213,626 | 2 | 606,813 | 581,893 | 0.000 | |
Residual | 2176,377 | 2087 | 1,043 | |||
Total | 3390,003 | 2089 |
F value = 581.893, with p < 0.05, the linear model built fits the population.
- Regression coefficient with VCTTD as dependent variable
Regression coefficient | t | p | 95%CI | |||
β | Std. Error | Lower Bound | Upper Bound | |||
Constant | 11,468 | 0.111 | 103,369 | 0.000 | 11,250 | 11,685 |
Year old | -0.108 | 0.028 | -3,861 | 0.000 | -0.163 | -0.053 |
Weight | 0.269 | 0.010 | 28,236 | 0.000 | 0.251 | 0.288 |
- Normalized residual frequency histogram Histogram
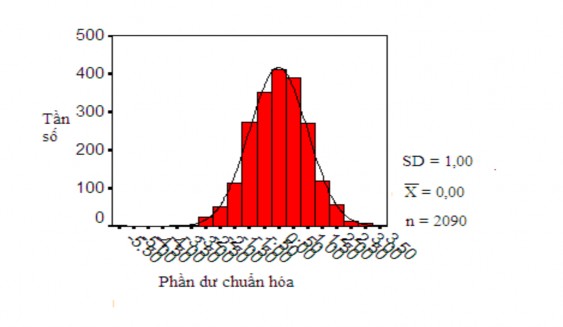
Standardized residual plot with VCTTD as dependent variable
The standardized residual plot with VCTTD as the dependent variable shows that the curve has
The bell-shaped shape fits the graph of the normal distribution, with X = 0, SD = 1 so the assumption of the residuals having the form of a normal distribution is not violated.
- Scatter Plot chart checks the assumption of linear relationship
Scatter Plot with VCTTD as dependent variable
The Scatter Plot with VCTTD as the dependent variable shows that the standardized residuals are concentrated around the zero-intercept line, so the linearity hypothesis is not violated.
The assumptions of linear regression analysis are all satisfied. Therefore, age and weight are linearly related to VCTTD according to the linear regression equation:
VCTTD = 11.468 - 0.108*Age + 0.269*Weight
APPENDIX 6
TABLE OF QUANTIFYING QUALITATIVE VARIABLES INTO ORDINARY VARIABLES
Qualitative variables
Variable on one's own | |||
C1 | Parents' occupation | Farmer | 1 |
State employees | 2 | ||
Business and other industries | 3 | ||
C2 | Parents' education level? | Unlettered | 1 |
Elementary | 2 | ||
Junior High School | 3 | ||
High school or higher | 4 | ||
C3 | Total number of children in the family? | 1-2 children | 1 |
3 children | 2 | ||
Over 3 children | 3 | ||
C4 | Total number of people in household? | 3-5 people | 1 |
5 people or more | 2 | ||
C6 | How long after birth can a baby be weaned? | Under 6 months | 1 |
6-11 months | 2 | ||
12 months and up | 3 | ||
C14 | Does the family regularly monitor the child's weight and height? | Do not follow | 1 |
Rarely, occasionally | 2 | ||
Frequent | 3 | ||
C30 | Do children often eat processed foods? | Are not | 1 |
Have | 2 | ||
C31 | Do children often eat sweets? | Are not | 1 |
Have | 2 | ||
C34 | Do children watch TV? | Are not | 1 |
Have | 2 |
C38
What water source does your family use for drinking? | River water, stream water, rain water, well water open | 1 | |
Well | 2 | ||
Tap water | 3 | ||
C39 | Type of toilet the family is using | Do not have | 1 |
Pit latrine | 2 | ||
2 compartment toilet, septic tank | 3 | ||
C40 | When do you think children should wash their hands? | No wash, no need to wash | 1 |
Before eating or after going to the toilet | 2 | ||
Before eating and after going to the toilet | 3 | ||
C42 | How often should children be dewormed? | 1 year or more | 1 |
Under 1 year | 2 | ||
C44 | Number of times brushing teeth per day | Don't brush your teeth | 1 |
1 time | 2 | ||
2 times or more | 3 | ||
C46 | Time to brush teeth? | Under 2 minutes | 1 |
2-3 minutes | 2 | ||
Over 3 minutes | 3 | ||
C52 | According to the family, is tooth decay harmful to children? | No or don't know | 1 |
Have | 2 |