Table 4.6. Concentrations of pollutants in wastewater
inlet and outlet of KTĐH tank - 2 USBF tanks with total retention time of 10 hours
Target
Unit | Input | Coagulation | Are not price tag | Price tag | |
pH | - | 6.35 | 6.97 | 7.82 | 7.69 |
SS | mg/L | 580 | 156 | 15.67 | 11.50 |
COD | mg/L | 1391 | 695 | 25.50 | 19.73 |
BOD 5 | mg/L | 935 | 525 | 13.00 | 10.50 |
TKN | mg/L | 100.8 | 66.5 | 7.09 | 4.86 |
P total | mg/L | 30.2 | 12.3 | 3.45 | 2.97 |
Maybe you are interested!
-
 Results of Evaluation of Influent Wastewater Characteristics
 -
 Initial Results and Comments
 -
 Completing the organization of accounting for revenue, sales costs and determining business results at Hai Phong Paint Joint Stock Company - 1
 -
 Results of Testing Cronbach's Alpha Coefficient of Independent Variable
 -
 Research on the treatment of seafood wastewater by electrocoagulation method combined with USBF - 19 tank

QCVN 11: 2008/BTNMT (column A)
a
b
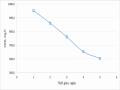
Input SS concentration: 580 (mg/L)
Output SS concentration of
electrochemical flocculation tank: 156 (mg/L)
60.00
Residual SS concentration after treatment (mg/L
50.00
40.00
30.00
20.00
10.00
0.00
USBF without price tag
USBF
have price
Figure 4.26. SS removal results in aquaculture wastewater of
USBF tank with cling rack & USBF tank without cling rack with total retention time of 10h
QCVN 11: 2008/BTNMT (column A)
a
b
Input COD concentration: 1391 (mg/L)
Output COD concentration of
Electrochemical flocculation tank: 695 (mg/L)
60.00
Residual COD concentration after treatment (mg/L
50.00
40.00
30.00
20.00
10.00
0.00
USBF without price tag
USBF
have price
Figure 4.27. COD removal results in aquaculture wastewater of
USBF tank with cling rack & USBF tank without cling rack with total retention time of 10h
QCVN 11: 2008/BTNMT (column A)
a
b
Input BOD 5 concentration : 935 (mg/L)
BOD5 concentration of the output
Electrochemical coagulation tank: 525 (mg/L)
35.00
30.00
BOD 5 concentrationremaining after treatment (mg/
25.00
20.00
15.00
10.00
5.00
0.00
USBF without price tag
USBF
have price
Figure 4.28. BOD 5 removal results in aquaculture wastewater of
USBF tank with cling rack & USBF tank without cling rack with total retention time of 10h
QCVN 11: 2008/BTNMT (column A)
a
b
Input TKN concentration: 100.8 (mg/L)
Output TKN concentration of
electrochemical flocculation tank: 66.5 (mg/L)
35.00
Concentration of TKN remaining after treatment (mg/
30.00
25.00
20.00
15.00
10.00
5.00
0.00
USBF without price tag
USBF
have price
Figure 4.29. TKN removal results in aquaculture wastewater of
USBF tank with cling rack & USBF tank without cling rack with total retention time of 10h
a
QCVN 24: 2009/BTNMT (column A)
b
Total input P concentration : 30.2 (mg/L)
Total output P concentration of
electrochemical capacitor tank: 12.3 (mg/L)
7.00
Total P concentration remaining after treatment (mg/
6.00
5.00
4.00
3.00
2.00
1.00
0.00
USBF without price tag
USBF
have price
Figure 4.30. Total P removal results in aquaculture wastewater of
USBF tank with cling rack & USBF tank without cling rack with total retention time of 10h
4.3.1.4 Comments and explanations
+ With a total retention time of 10 hours, all indicators such as SS, COD, BOD5 , TKN meet QCVN 11:2008/BTNMT (column A), only P total meets QCVN 24: 2009/BTNMT (column A) (because QCVN 11:2008/BTNMT does not specify for P).
=> Consider the basic factors for the biological treatment process in the wastewater output of both electrochemical coagulants operating in batches as follows: pH is 6.97; SS is 156 > 150mg/L; BOD 5 is 525 > 500mg/L; BOD 5 : N: P ratio is 100: 12.67: 2.34; BOD 5 /COD ratio is 0.75.
We see that although SS and BOD 5 do not meet the regulations for sludge treatment,
classical activity, but in general this wastewater is very suitable for treatment by USBF tank. Because, USBF tank has the ability to withstand loading of high concentrations of pollutants in the input wastewater. Besides, the BOD 5 : N : P ratio of 100 : 12.67 : 2.34 in the input wastewater of both USBF tanks is much higher than the BOD 5 : N : P ratio most suitable for biological treatment process which is 100 : 5 : 1, but the output wastewater still meets QCVN 11: 2008 / BTNMT and QCVN 24: 2009 / BTNMT. The reason for this problem is that USBF tank is a combination of 3 processes: anoxic, aerobic and filtration through biological sludge layer (sedimentation compartment), so it has the ability to treat nitrogen and phosphorus very well. In addition, with the total water retention time in both USBF tanks being 10 hours (the anoxic, aerobic and settling compartments being 2.5 hours; 6 hours; 1.5 hours respectively), along with favorable input factors, it has created the best conditions for microorganisms to operate in the decarbonization, nitrification, denitrification and phosphorus reduction processes to operate well. Therefore, the wastewater treatment efficiency in both USBF tanks with and without adhering media is very high, such as SS (92.63% and 89.96%); COD (97.16% and 96.33%); BOD 5 (98% and 97.02%); TKN (92.69% and 89.34%); Total P (75.85% and
71.95%) is completely reasonable.
+ The concentrations of the above pollutants in the effluent of the USBF tank with a flocculation bed are lower than those in the effluent of the USBF tank without a flocculation bed. Specifically as follows: SS (11.5mg/L and 15.67mg/L); COD (19.73mg/L vs. 25.4mg/L); BOD 5 (10.5mg/L vs. 13mg/L); TKN (4.86mg/L vs. 7.09mg/L); Total P (2.97mg/L vs. 3.45mg/L). In particular, the difference in the concentrations of pollutants in the effluent of the two USBF tanks is significant.
=> We see that the two USBF tanks have the same size (650cm x 500cm x 230cm), volume (all 3 compartments are 66 liters) and shape. Besides, both operate in parallel.
parallel with the same total retention time (10h) and using the same type of wastewater. The only difference between these two USBF tanks is that when operating one tank with a biofilm-forming floc and one tank without a biofilm-forming floc. Before adding the biofilm-forming floc to the aerobic compartment of both tanks, we controlled the MLSS in the aerobic compartment of both tanks to be 3400mg/L. Therefore, after adding the biofilm-forming floc to the aerobic compartment of the USBF tank with a biofilm-forming floc, the USBF tank with a biofilm-forming floc had a higher density of microorganisms than the USBF tank without a floc. Thus, we can confirm that the difference in the concentration of pollutants in the effluent of these two USBF tanks is due to the different density of microorganisms in the two tanks.
+ The effluent of both USBF tanks meets type A of QCVN 11:2008/BTNMT - QCVN 24:2009/BTNMT and is very high. Therefore, we decided to repeat this experiment with a total retention time of 8 hours.
=> When observing the charts in section 4.3.1.3, it is easy to see that the concentration of pollutants in the wastewater output of the 2 USBF tanks is much lower than the regulations in column A in QCVN 11:2008/BTNMT and QCVN 24: 2009/BTNMT. There are many factors affecting the operation and treatment efficiency of the USBF tank such as: retention time, MLSS content, DO,.... In which, retention time is a very important factor, if the retention time is too long, the microorganisms will lack nutrients to maintain their activities and the USBF tank will not be able to operate continuously. If the retention time is too short, there will not be enough time for the microorganisms to decompose all the pollutants in the wastewater. Besides, if the retention time is short, the volume of the USBF tank will decrease and the required floor area will also decrease. Therefore, in order to limit the space needed to build the USBF tank, we decided to reduce the total retention time of both tanks to 8 hours. If the total retention time of 8 hours continues to be high or does not meet the two QCVNs mentioned above, based on the results, we will choose another retention time to continue operating these two USBF tanks. The ultimate goal is to find the most suitable retention time for each USBF tank so as not to waste space while still ensuring that the output wastewater meets QCVN 11:2008/BTNMT and QCVN 24:2009/BTNMT.
4.3.2 Experimental results with total retention time of 8 hours (experiment 7)
Through experiment 6, we have determined that with a total retention time of 10 hours, the treatment efficiency of both USBF tanks with and without adhesive media is very high. The effluent of both USBF tanks meets type A of QCVN 11:
2008/BTNMT - QCVN 24: 2009/BTNMT and achieved very high. Therefore, we decided to repeat this experiment with a total retention time of 8 hours.
4.3.2.1 Characteristics of input wastewater
Water was collected at 8:10 a.m., there was no rain the night before, the collected wastewater was relatively dark red, there was relatively little grease, the water level in the sampling canal was about 0.43 m.
4.3.2.2 Phenomena occurring during the experiment
With the experimental conditions as presented in section 3.4.2.2 - experiment 7. We operated the USBF tank with and without the USBF tank and observed the following phenomena:
+ The sludge in the settling compartment of the USBF tank with a floc is no longer as compact as when operating with a total retention time of 10 hours, but the sludge is still more compact than the sludge in the settling compartment of the USBF tank without a floc.
+ In the settling compartment of the USBF tank without a flocculation rack, denitrification occurs and tiny air bubbles appear to move upwards, but relatively few.
+ After a total retention time of 8 hours, the output water of both USBF tanks contained a certain amount of suspended solids and was no longer as clear as when operating with a total retention time of 10 hours.
Figure 4.31. Input wastewater and output wastewater
of electrochemical flocculation tank and two USBF tanks (total retention time 8h)
4.3.2.3 Experimental results
After conducting experiments and analyzing physical and chemical indicators as presented in section 3.4.2.2 - experiment 7, we obtained the following results:
Table 4.7. Concentrations of pollutants in wastewater
inlet and outlet of KTĐH tank - 2 USBF tanks with total retention time of 8 hours
Target
Unit | Input | Coagulation | Are not price tag | Price tag | |
pH | - | 6.35 | 6.97 | 7.87 | 7.59 |
SS | mg/L | 580 | 156 | 36.83 | 27.67 |
COD | mg/L | 1391 | 695 | 37.00 | 29.00 |
BOD 5 | mg/L | 935 | 525 | 23.73 | 18.00 |
TKN | mg/L | 100.8 | 66.5 | 1268 | 7.93 |
P total | mg/L | 30.2 | 12.3 | 3.96 | 3.33 |
QCVN 11: 2008/BTNMT (column A)
a
b
Input SS concentration: 580 (mg/L)
Output SS concentration of
electrochemical flocculation tank: 156 (mg/L)
60.00
Residual SS concentration after treatment (mg/L
50.00
40.00
30.00
20.00
10.00
0.00
USBF
no price tag
USBF
have price
Figure 4.32. SS removal results in aquaculture wastewater of
USBF tank with cling rack & USBF tank without cling rack with total retention time of 8h
QCVN 11: 2008/BTNMT (column A)
a
b
Input COD concentration: 1391 (mg/L)
Output COD concentration of
Electrochemical flocculation tank: 695 (mg/L)
60.00
Residual COD concentration after treatment (mg/L
50.00
40.00
30.00
20.00
10.00
0.00
USBF
no price tag
USBF
have price
Figure 4.33. COD removal results in aquaculture wastewater of
USBF tank with cling rack & USBF tank without cling rack with total retention time of 8h
QCVN 11: 2008/BTNMT (column A)
a
b
Input BOD 5 concentration : 935 (mg/L)
BOD5 concentration of the output
Electrochemical coagulation tank: 525 (mg/L)
35.00
BOD 5 concentrationremaining after treatment (mg/L
30.00
25.00
20.00
15.00
10.00
5.00
0.00
USBF
no price tag
USBF
have price
Figure 4.34. BOD 5 removal results in aquaculture wastewater of
USBF tank with cling rack & USBF tank without cling rack with total retention time of 8h