6
10/2010 | 400.5 | 473.8 | 927.1 | 225.3 | 281.2 | 496 | |
7 | 10/1983 | 301.9 | 375.2 | 613.9 | 159.4 | 264.0 | 518 |
8 | 09/2002 | 317.2 | 384.5 | 664.9 | 201.5 | 234.7 | 545 |
9 | 10/1988 | 673.1 | 894.6 | 908.4 | 623.8 | 510.7 | 666 |
10 | 09/1978 | 814.2 | 1434.4 | 1196.7 | 535.1 | 646.2 | 780 |
Maybe you are interested!
-
 Map and GIS Database on Density Distribution and Ecology of 5-Needle Pine
 -
 Distribution Map of Nam De Worshiping Sites in the Northern Delta Region
 -
 Average Annual Temperature Distribution Map of Mountainous Districts in Tri - Thien Area
 -
 Comparison of Distribution by Number of Cesarean Sections Between Studies
 -
 Habits of Using Banking Services Through Distribution Channels
According to statistics in Table 2.7 , in the 10 largest floods in the downstream, the order of heavy rain to light rain causing flooding in the downstream of Ca River is as follows: La River area, mid-lower Ca River area, Hieu River area, Con Cuong - Muong Xen area. The two areas of La River and mid-lower Ca River play a decisive role in flooding in the downstream of Ca River. The floods causing major flooding in the downstream of Ca River often appear in September and October (8/10 cases).
The distribution of some major flooding rains downstream of Ca River is shown in Figures 2.6 to 2.11 .
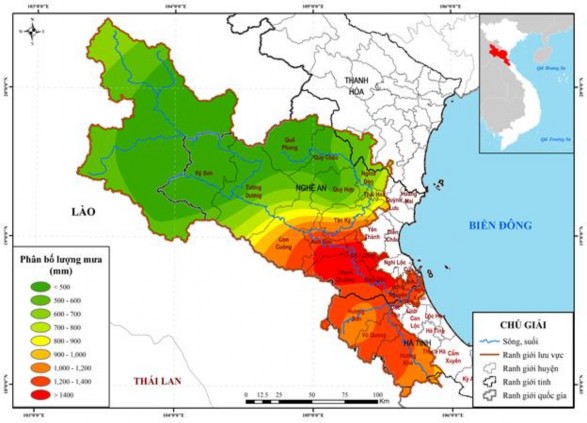
Figure 2.6: Map of total rainfall distribution from 16-30/9/1978 - Ca River Basin
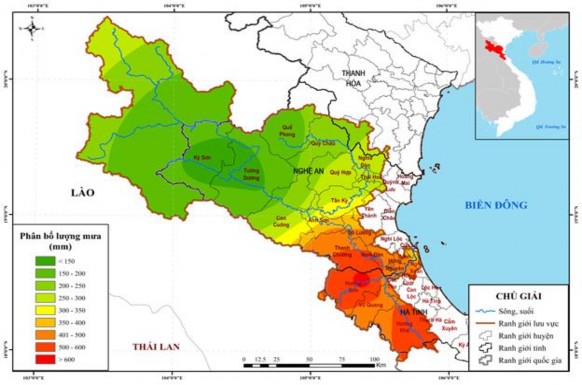
Figure 2.7: Map of total rainfall distribution from 16-30/9/1983 - Ca River Basin
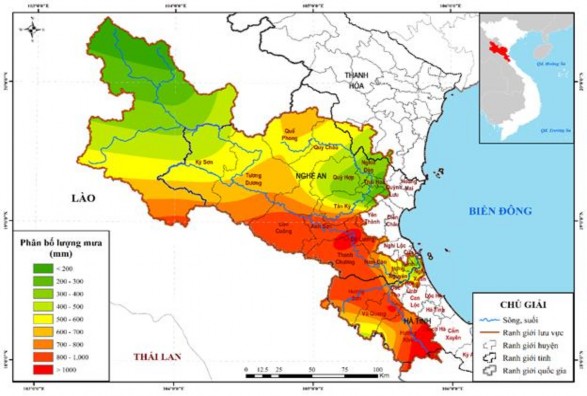
Figure 2.8: Map of total rainfall distribution from 16-30/9/1988 - Ca River Basin
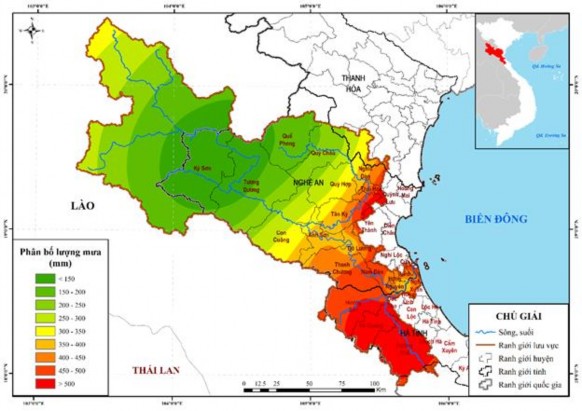
Figure 2.9: Map of total rainfall distribution from 16-30/9/1996 - Ca River Basin
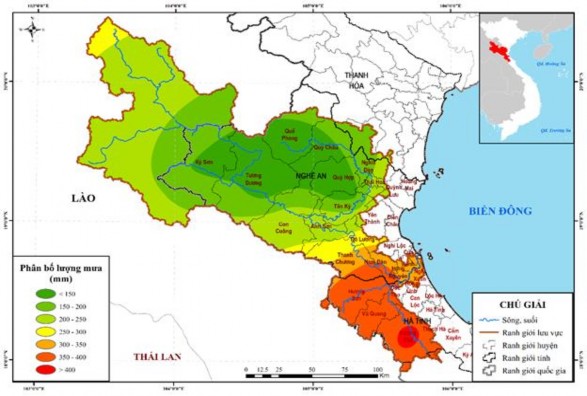
Figure 2.10: Map of total rainfall distribution from 16-30/9/2002 - Ca River Basin
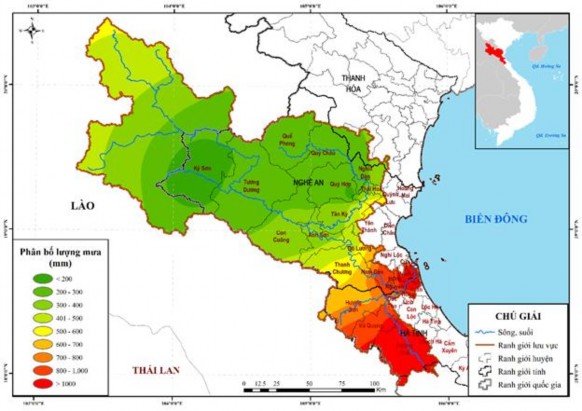
Figure 2.11: Map of total rainfall distribution from 16-30/9/2010 - Ca River Basin
Analyzing the distribution of rainfall causing 6 major floods in the lower reaches of the Ca River ( Figure 6 - 11 ), it can be seen that the center of rainfall is concentrated in the middle and lower reaches of the Ca River or La River. Considering the 10 largest floods in the lower reaches of the Ca River in the past 50 years ( Table 2 - Appendix ), major floods often occur when heavy rain occurs in the middle and lower reaches of the Ca River and the La River basin. The floods in September 1978 and September 1988 had very large total rainfall and were concentrated in the middle and lower reaches of the Ca River and La River. In short, the role of rainfall in the middle and lower reaches of the Ca River and the La River basin is very important for flooding in the lower reaches of the Ca River.
2.3.2.2. Floods from upstream
a. Flood season
The flood season of Ca River usually lasts from August to November due to the activities of weather patterns causing heavy rain. Minor floods can appear around the end of May and the beginning of June.
Due to the strong influence of topography, the start and end times of flood season and the time of occurrence of large floods on the main stream of Ca River and its tributaries are often different. The distribution of average monthly discharge over many years at hydrological stations representing river basins is shown in Figure 2.12 .
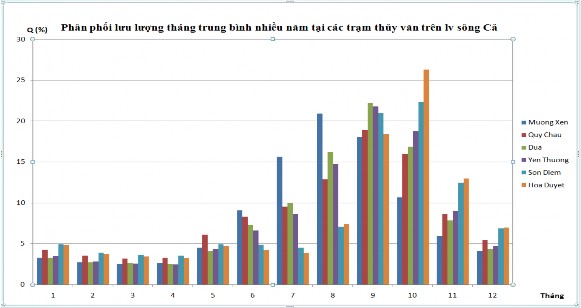
Figure 2.12: Distribution of average monthly flow over many years at hydrological stations in the Ca River basin (%)
- On the main stream of the Ca River, the flood season starts in July and ends in early November in the upper stream, and in late November in the middle and lower stream. The biggest floods usually occur in August in the upper stream; September and October in the middle and lower stream.
- On Hieu River, flood season starts from August and ends in early November.
XI. The biggest floods usually occur in September.
- On La River, flood season starts from early September, ends in late November, and can end as late as early December. The biggest flood usually occurs in October.
- Upstream of Ca River (Nam Non and Nam Mo Rivers), flood season starts from early July and ends in early October. The biggest flood usually occurs in
August; Downstream of the Ca River, flood season starts from early August and ends at the end of October. The biggest flood usually occurs in September.
b. Phase shift of floods in rivers:
Statistics on the frequency of the largest floods in the months in Table
2.8 shows that, in the past 60 years, there were 44 years when the highest flood levels in Nam Dan and Cho Trang coincided (reaching a frequency of approximately 77%), 41 years when the highest flood levels in Linh Cam and Cho Trang coincided (reaching a frequency of approximately 73%), and 32 years when the highest flood levels in Linh Cam, Nam Dan and Cho Trang coincided (reaching a frequency of approximately 57%). The floods with large peaks in Cho Trang were all synchronized with the large floods in La River and the main stream of Ca River.
Time of flood peaks on rivers: big floods in the lower reaches of Ca River usually appear in September or October with quite close frequency. The biggest floods of the year on rivers belonging to Ca River appear as follows: the upper reaches of Ca River (Nam Mo and Nam Non) usually appear in August; Hieu River usually in September; La River usually in October. Big floods in the middle reaches of Ca River are often in phase with floods on Hieu River.
Table 2.8: The probability of the largest flood occurring in the months of the year in the Ca River basin (%)
TT
Station | River | V | VI | VII | VIII | IX | X | XI | |
1 | Muong Xen | Tomb | 4.0 | 26.0 | 36.0 | 24.0 | 6.0 | ||
2 | Quy Chau | Filial | 3.33 | 5.0 | 15.0 | 43.3 | 25.0 | 8.33 | |
3 | Nghia Khanh | Filial | 1.7 | 10.3 | 20.7 | 37.9 | 24.1 | 5.2 | |
4 | Coconut | Chief | 1.7 | 3.3 | 20.0 | 38.3 | 31.7 | 5.0 | |
5 | Yen Thuong | Chief | 1.7 | 8.3 | 16.7 | 40.0 | 28.3 | 5.0 | |
6 | Trang Market | Chief | 1.8 | 1.8 | 14.0 | 42.1 | 33.3 | 7.0 | |
7 | Son Diem | Thousand Streets | 1.7 | 5.2 | 1.7 | 3.4 | 41.4 | 39.7 | 6.9 |
8 | Hoa Duyet | Thousand Deep | 1.7 | 1.7 | 3.3 | 8.3 | 30.0 | 50.0 | 5.0 |
9 | Intuition | La | 1.8 | 1.8 | 1.8 | 7.1 | 32.1 | 48.2 | 7.1 |
Statistics of floods from level 2 and above show that the duration of flood at high level (above level 3) in the upstream is short, only about 6 - 12 hours; in the downstream: 1 - 2 days in Nam Dan, 1 day in Linh Cam. However, in particularly large floods, the duration of flood at level 3 is quite long, such as the historic flood in 1978 in Nam Dan and Linh Cam, lasting up to 5 days; the flood in 1988 lasted up to 8 days in Nam Dan and 4 days in Linh Cam... In general, the largest flood of the year in the downstream area often appears about a month later than the annual flood peak in the upstream. The further downstream, the riverbed is widened, the flood water is strongly regulated, due to the influence of the tide, the duration of flood peak is longer, the water recedes slowly, the duration of flood water level at high level is longer, affecting dike protection and agricultural production.
c. The occurrence of major floods on rivers:
The large and fragmented basin area has created a phase shift of major floods on the Ca River. Statistics of typical major floods on rivers in the Ca River system show that the time of appearance of major flood peaks is in the same order on the rivers.
Ca, Hieu, La are different (Table 2.9 ).
Table 2.9: Frequency of maximum water levels of some major floods at some locations on the Ca River
TT
Station | River | H maxTB many years (cm) | Order of the Great Flood best | Year | Max H (cm) | Frequency (P%) | Date of appearance | |
1 | Muong Xen | Tomb | 13,876 | 1 | 2011 | 14,534 | 0.4 | 25/VI |
2 | 2018 | 14,333 | 1.6 | 17/8 | ||||
3 | 2005 | 14,215 | 3.9 | 28/9 | ||||
4 | 1973 | 14,047 | 12.9 | 27/8 | ||||
5 | 2016 | 14,029 | 14.7 | 19/8 | ||||
2 | Quy Chau | Filial | 7,469 | 1 | 2007 | 8,019 | 2.4 | 05/X |
2 | 1988 | 8,005 | 2.7 | 14/X | ||||
3 | 1980 | 7,932 | 4.6 | 07/IX | ||||
4 | 1966 | 7,915 | 5.2 | 14/11 | ||||
5 | 2009 | 7,897 | 6.1 | 26/IX |
TT
Station | River | H maxTB many years (cm) | Order of the Great Flood best | Year | Max H (cm) | Frequency (P%) | Date of appearance | |
3 | Coconut | Chief | 2,082 | 1 | 1988 | 2498 | 2.7 | 18/X |
2 | 1978 | 2490 | 2.9 | 28/9 | ||||
3 | 1973 | 2366 | 13.8 | 28/8 | ||||
4 | 1980 | 2357 | 14.3 | 17/9 | ||||
5 | 2007 | 2354 | 14.5 | 06/X | ||||
4 | Nam Dan | Chief | 682 | 1 | 1978 | 1,034 | 0.4 | 29/9 |
2 | 1988 | 941 | 2.0 | 19/X | ||||
3 | 1996 | 830 | 10.7 | 25/9 | ||||
4 | 1962 | 809 | 14.6 | 03/X | ||||
5 | 1980 | 808 | 14.7 | 19/9 | ||||
5 | Son Diem | Thousand Streets | 1,166 | 1 | 2002 | 1,582 | 1.9 | 20/9 |
2 | 1989 | 1,535 | 3.3 | 06/V | ||||
3 | 2013 | 1,462 | 7.2 | 16/X | ||||
4 | 1988 | 1,460 | 7.4 | 17/X | ||||
5 | 1983 | 1,445 | 8.4 | 01/X | ||||
6 | Hoa Duyet | Thousand Deep | 943 | 1 | 2010 | 1283 | 2.0 | 17/X |
2 | 1960 | 1274 | 2.3 | 06/X | ||||
3 | 2007 | 1205 | 5.6 | 08/VIII | ||||
4 | 2002 | 1178 | 7.7 | 01/9 | ||||
5 | 1979 | 1147 | 10.4 | 05/IX | ||||
7 | Intuition | La | 426 | 1 | 1978 | 825 | 0.9 | 29/9 |
2 | 2002 | 771 | 1.9 | 21/9 | ||||
3 | 1988 | 728 | 3.5 | 18/X | ||||
4 | 2010 | 728 | 3.5 | 17/8 | ||||
5 | 1983 | 639 | 10.0 | 12/X | ||||
8 | Trang Market | Chief | 343 | 1 | 1978 | 780 | 0.5 | 29/9 |
2 | 1988 | 666 | 1.7 | 16/X | ||||
3 | 2002 | 545 | 6.4 | 21/9 | ||||
4 | 1983 | 518 | 8.5 | 27/X | ||||
5 | 2010 | 496 | 10.3 | 18/X |