Table 3.27. Applying K-Fold cross validation to select the relational model Pd according to D
of Five-needle Pine with the influence of different distribution areas
Status
Model | Weight | Random effect | AIC | R 2 adj. | Bias (%) | RMSE (%) | MAPE (%) | |
1 | Hyperbola: Pd = a + b/D | 1/ Dk | Distribution area | -23681.0 | 0.622 | -50.0 | 143.7 | 72.9 |
Are not | -24668.1 | 0.699 | -69.0 | 168.1 | 92.5 | |||
Power: Pd = a × D b | Distribution area | -26166.3 | 0.703 | -54.7 | 170.6 | 81.4 | ||
2 | 1/ Dk | |||||||
Are not | -24622.2 | 0.414 | -69.1 | 167.3 | 92.6 | |||
Maybe you are interested!
-

 Database Content Structure In GIS Environment
 -
 Building a database in GIS to serve the tourism development orientation of Savannakhet province, Laos - 13
 -
 Distribution Map of Nam De Worshiping Sites in the Northern Delta Region
 -
 Building GIS Database on Natural Conditions - Socio-Economics to Serve Tourism Development Orientation of Savannakhet Province - Laos
 -
 Average Annual Temperature Distribution Map of Mountainous Districts in Tri - Thien Area
adj.
Note: n = 4566 data; K-Fold cross-validation with K = 10, statistical indicators of the model AIC, R 2 , and Bias, RMSE, MAPE errors are calculated on average from 10 times of setting up and validating the model error, each time there are (9/10 data) 4110 data used for modeling and there are (1/10) 456 data for error assessment; k: coefficient of the variance function; Bold is the selected model .
From the results in Table 3.27, it can be seen that when not considering the distribution area, the two functions Hyperbolic and Power have statistical values AIC and errors that are quite similar. Meanwhile, considering the distribution area, the Power function is the best with the smallest algebraic value AIC, the highest R 2 adj . Therefore, the Power model according to each ecological distribution area of 5-leaf pine is the best choice to simulate the relationship Pd/D.
Therefore, using the Power model and dividing this model by each ecological distribution zone to increase reliability is necessary. Figure 3.38 and Figure 3.39 also support this choice, the Power model divided by ecological distribution zone will reduce the predicted Pd variation compared to the Pd used for appraisal compared to the general model.
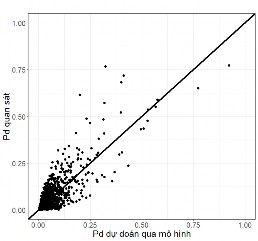
Figure 3.38. Relationship between observed Pd using validation from 1/10 random data and
Pd predicted by Power Pd = a×D b model common to distribution regions
At the same time, the graph shows that the general Pd/D model in Power form for the entire Central Highlands has a high Pd estimation error when the tree has a larger D , shown through the relationship between observed Pd and predicted Pd through the dispersion model when Pd increases (Figure 3.38). Therefore, it is necessary to divide the model according to its distribution area to increase reliability and reduce errors. The method of changing the model parameters according to the distribution area called random effect in the method of estimating nonlinear functions according to the weighted Maximum Likelihood has been applied; the result reduces error fluctuations and increases reliability when estimating Pd according to each of its distribution areas in the Central Highlands (Figure 3.39 and Table 3.28).
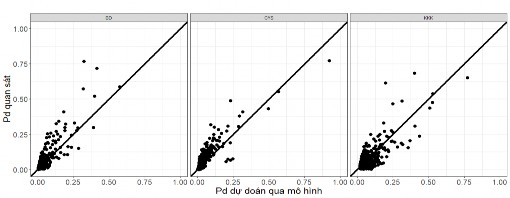
Figure 3.39. Relationship between observed Pd value stopping appraisal from 1/10 random data and predicted Pd through Power Pd = aD bi model according to distribution area : BD: Bidoup - Nui Ba,
CYS: Chu Yang Sin, KKK: Kon Ka Kinh
Table 3.28. Model Pd = a×D bi selected according to distribution areas of 5-leaf pine
different in the Central Highlands
Distribution area
n i | The parameter values and standard errors (SE i ) vary across distribution region i, with P = 95% | ||||
a | SE | b i | SE i | ||
Common areas | 4566 | 0.383712 | 0.019238 | -0.977852 | 0.102341 |
Bidoup - Ba Mountain | 2780 | -1.100362 | 0.003327 | ||
Chu Yang Sin | 1297 | 0.383712 | 0.019238 | -1.103273 | 0.004870 |
Kon Ka Kinh | 489 | -0.729921 | 0.007932 | ||
Note: After K-Fold cross-validation for model selection, ecological distribution parameters were estimated from the entire data set n = 4566
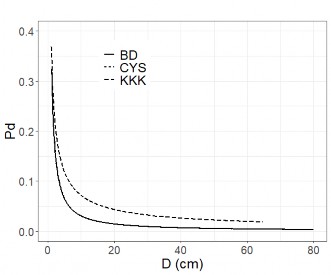
Figure 3.40. Pd/D relationship of 5-needle pine according to the model Pd = a×D b distinguishes three distribution regions: BD: Bidoup - Nui Ba, CYS: Chu Yang Sin, KKK: Kon Ka Kinh.
The results of dividing the Pd/D model according to the distribution area show that Pd is high at small diameter levels ( D < 10 cm), then Pd decreases rapidly when D increases in the diameter level from 10 - 20 cm; when D > 20 cm, Pd decreases slowly. The Kon Ka Kinh area has a higher Pd than the two distribution areas of Bidoup - Nui Ba and Chu Yang Sin (Figure 3.40); this is consistent with the results of the study on the growth of 5-needle pine.
In practice, the P d /D relationship model can be applied to predict growth.
D or the time it takes for a tree to reach a desired D of a 5-needle pine is as follows:
- Determine the distribution area (one of three modeling areas) to select the Power model with appropriate parameters (Table 3.28).
- Predicting diameter growth Z d : Substituting any value of D into the model will give the corresponding Pd ; from which we can deduce that Z d = P d ×D.
- Predict the time n for the tree to reach the desired diameter D A+n from an average tree at the present time with diameter D A :
oPredicting the amount of tree diameter growth at time ( Z dA ) : Substituting D A into the P d /D model according to the appropriate distribution area (Table 3.28) predicts Z dA = P dA × D A .
o Predict the time it takes for n trees to reach diameter D A+n :
𝑛 =
𝑍 𝑑𝐴
𝐷− 𝐷(3.7) |
The results from Table 3.29 show the estimated P d value of 5-needle pine according to D through the Power model established for three distribution areas in the Central Highlands. This result shows that the P d of the two areas BD and CYS are quite similar while KKK has a higher P d value.
Table 3.29. Estimation of Pd according to D of 5-needle pine species through the model Pd = a×D bi in 3 different distribution areas of 5-needle pine in the Central Highlands
D (cm)
Pd | |||
BD | CYS | KKK | |
5 | 0.065 | 0.065 | 0.119 |
15 | 0.019 | 0.019 | 0.053 |
25 | 0.011 | 0.011 | 0.037 |
35 | 0.008 | 0.008 | 0.029 |
45 | 0.006 | 0.006 | 0.024 |
55 | 0.005 | 0.005 | 0.021 |
65 | 0.004 | 0.004 | 0.018 |
75 | 0.003 | 0.003 | |
85 | 0.003 | 0.003 |
Note: BD: Bidoupp Nui Ba; CYS: Chu Yang Sin and KKK: Kon Ka Kink
3.5. Maps and GIS database on density distribution and ecology of 5-needle pine
The density distribution of 5-needle pine in 19 km2 in three study distribution areas was established with a GIS map of 5-needle pine density classification along with ecological database stored in GIS as shown in Appendix 5.
Table 3.30. Density of distribution points of 5-leaf pine according to N level corresponding to three influencing ecological factors: P, DC and TDD in three ecological distribution areas
P/TDD | ||||||||||
1 | 2 | 3 | ||||||||
Distribution area | N | DC | 2 | 3 | 1 | 2 | 3 | 1 | 2 | 3 |
BD | 1 | 2 | 10 | |||||||
3 | 25 | 2 | ||||||||
2 | 2 | 5 | ||||||||
3 | 7 | 1 | ||||||||
Total BD | 47 | 3 | ||||||||
CYS | 1 | 1 | 1 | 3 | ||||||
2 | 2 | |||||||||
3 | 2 | 6 | ||||||||
2 | 2 | 1 | ||||||||
3 | 7 | |||||||||
3 | 3 | 1 | ||||||||
Total CYS | 2 | 17 | 4 | |||||||
KKK | 1 | 1 | 2 | 24 | ||||||
2 | 2 | 42 | 1 | |||||||
3 | 2 | |||||||||
2 | 1 | 6 | ||||||||
2 | 11 | 3 | ||||||||
3 | 2 | 1 | ||||||||
3 | 2 | 1 | ||||||||
4 | 1 | 1 | ||||||||
2 | 2 | |||||||||
KKK total | 4 | 89 | 7 | |||||||
General | 47 | 3 | 4 | 89 | 7 | 2 | 17 | 4 | ||
Note: N level: 1: <10 trees/ha, 2: 10 -50 trees/ha, 3: 51 - 100 trees/ha and 4:>100 trees/ha. DC: High level code; TDD: Soil thickness code; P: Average annual rainfall code according to Table 2.2. BD: Bidoup - Nui Ba, CYS: Chu Yang Sinh and KKK: Kon Ka Kinh
To conserve a tree species in general, it is necessary to know the concentrated distribution areas with different levels of concentration related to geographical and ecological factors. From the database layers according to geographical coordinates, the density of 5-needle pine and the influencing ecological factors, a distribution map according to the density level of 5-needle pine has been created along with the system.
Data of 10 ecological factors in GIS. In which, density level (N) of 5-needle pine is divided into 4 levels: High (> 100 trees/ha), medium (51-100 trees/ha), low (10 - 50 trees/ha) and rare (< 10 trees/ha).
Based on the data of three ecological factors: rainfall (P), altitude above sea level (DC) and soil thickness (TDD) affecting the density distribution of 5-needle pine, the density of 5-needle pine distribution points in three ecological distribution areas according to the three ecological factors in Table 3.30 is shown.
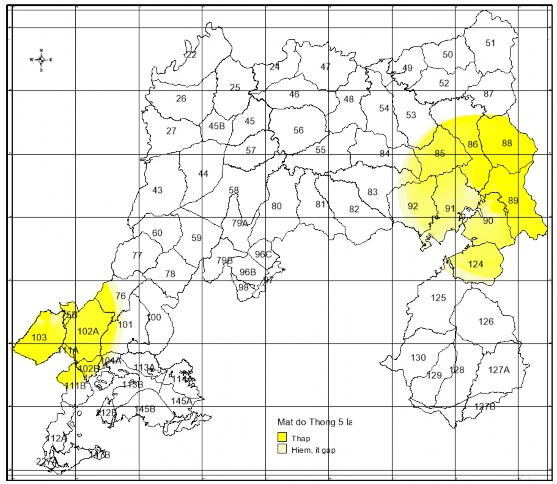
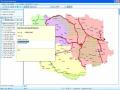
Figure 3.41. Map of population density levels of 5-needle pine in Bidoup - Nui Ba National Park. Density levels of 5-needle pine: Low (10 - 50 trees/ha) and rare (<10 trees/ha). The numbers on the map are forest sub-area codes.
The Grid-type thematic map in Mapinfo software is set up to divide areas with different density levels based on species density data layers and parameters according to the monitoring survey system such as distance between lines, points and maximum range of distribution area.
Results from Figure 3.41 show the population density levels of 5-needle pine at Bidoup National Park.
- Ba Mountain is rare to low with density from < 10 trees/ha to 10 - 50 trees/ha in its distribution area. In which, 5-needle pine is mainly distributed in two clusters in the southwest and east direction of the National Park.
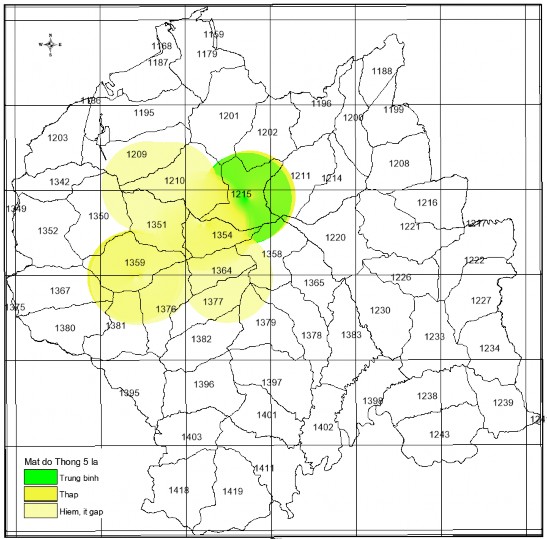
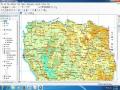
Figure 3.42. Population density map of 5-needle pine in Chu Yang Sin National Park. Density level of 5-needle pine: Medium (51-100 trees/ha), low (10-50 trees/ha) and rare or uncommon (<10
trees/ha). The number on the map is the forest sub-area number.
Results from Figure 3.42 show that the population density of 5-needle pine in Chu Yang Sin National Park ranges from rare to low (<10 trees/ha, 10–50 trees/ha) and medium (from 51–100 trees/ha). In which, 5-needle pine is concentrated in the central area of the National Park around Chu Yang Sin peak.
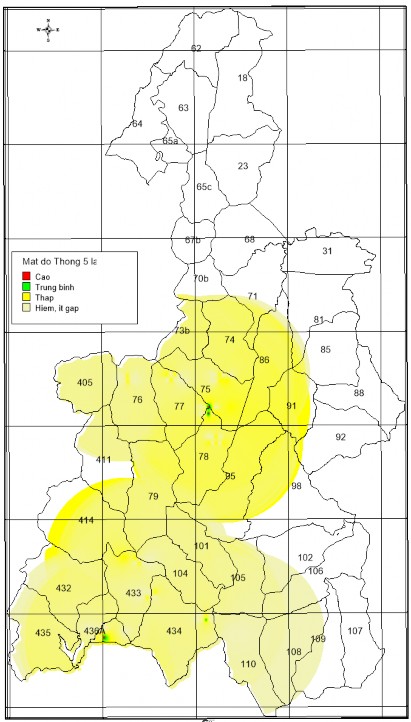
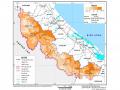
Figure 3.43. Population density map of 5-needle pine in Kon Ka Kinh National Park. Density level of 5-needle pine: High (>100 trees/ha), medium (51-100 trees/ha), low (10-50 trees/ha) and rare
(<10 trees/ha). The number on the map is the forest sub-area number.
Figure 3.43 shows that the population density of 5-needle pine in Kon Ka Kinh National Park ranges from rare (<10 trees/ha) to high (>100 trees/ha) and is evenly distributed throughout the managed forest stand.