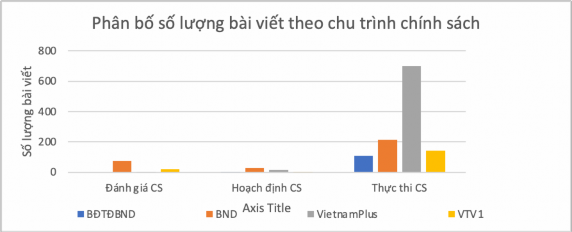
1.10. Results of article classification on policy cycle
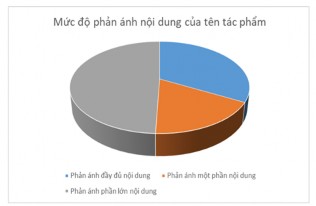
1.11. Results of analysis of the level of reflection of the content of the work's title
The extent to which the title of the work reflects its content
Number of posts | Percentage | Valid % | Cumulative % | ||
Observe | Full reflection Content | 435 | 33 | 33 | 33 |
Reflects part of the content | 232 | 17.6 | 17.6 | 50.6 | |
Reflects the majority Content | 651 | 49.4 | 49.4 | 100.0 | |
Total | 1318 | 100.0 | 100.0 |
Maybe you are interested!
-

 Press and media on Vietnam's state administrative reform policy - 38
 -
 Press and media on Vietnam's state administrative reform policy - 27
 -
 Social Media Marketing Activities for Nestle's Nestcafé Brand in Vietnam
 -
 The role of the state in Vietnam's international economic integration - 3
 -
 Perfecting Mechanisms and Policies for Construction Investment Projects from the State Budget in Vietnam's Transport Sector
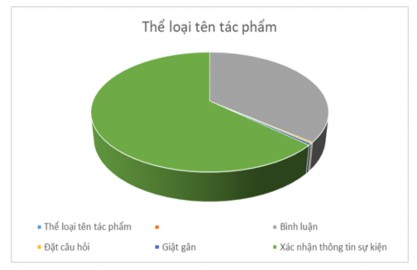
1.12. Results of analysis of genre of work title
Genre of work name | |||||
Number of posts | Percentage | Valid % | Cumulative % | ||
Observe | Comment | 473 | 35.9 | 35.9 | 35.9 |
Ask a question | 4 | 0.3 | 0.3 | 0.3 | |
sensational | 6 | 0.5 | 0.5 | 0.5 | |
Confirm event information | 835 | 63.3 | 63.3 | 63.3 | |
Total | 1318 | 100.0 | 100.0 | ||
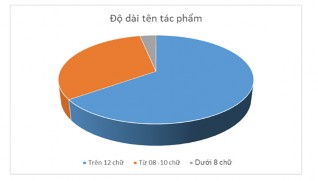
1.13. Results of analysis of work title length
Length of work title | |||||
Number of posts | Percentage | Valid % | Cumulative % | ||
Observe | Over 12 characters | 856 | 64.9 | 64.9 | 64.9 |
From 08 - 12 words | 420 | 31.9 | 31.9 | ||
Under 8 characters | 42 | 3.2 | 3.2 | 3.2 | |
Total | 1318 | 100 | 100 | ||
Appendix 2. RESULTS OF STATISTICS AND CHI SQUARE TEST OF VARIABLES IN THE SURVEY SAMPLE
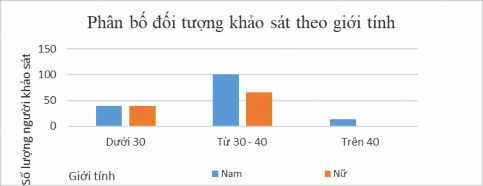
2.1. Results of analysis of the relationship between age and gender of the survey subjects
Gender * Ages Crosstabulation
Count | |||||
Ages | Total | ||||
Under 30 | From 30 - 40 | Over 40 | |||
Gender | Male | 40 | 101 | 13 | 154 |
Female | 40 | 65 | 1 | 106 | |
Total | 80 | 166 | 14 | 260 | |
Chi-Square Tests
Value | df | Asymp. Sig. (2-sided) | |
Pearson Chi-Square | 9.557 a | 2 | .008 |
Likelihood Ratio | 11,160 | 2 | .004 |
Linear-by-Linear Association | 7,809 | 1 | .005 |
N of Valid Cases | 260 |
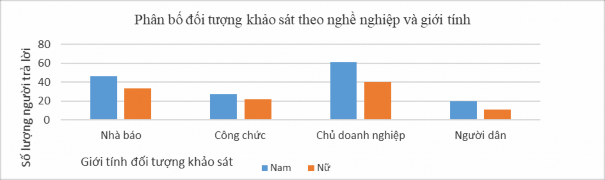
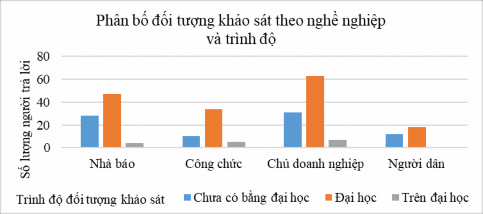
2.2. Results of analysis of the relationship between gender and occupation of the survey subjects
Gender * Occupation Crosstabulation
Count | ||||||
Occupation | Total | |||||
Journalist | Officer | Business owner | People | |||
Gender | Male | 46 | 27 | 61 | 20 | 154 |
Female | 33 | 22 | 40 | 11 | 106 | |
Total | 79 | 49 | 101 | 31 | 260 | |
Chi-Square Tests
Value | df | Asymp. Sig. (2-sided) | |
Pearson Chi-Square | .794a | 3 | .851 |
Likelihood Ratio | .797 | 3 | .850 |
Linear-by-Linear Association | .410 | 1 | .522 |
N of Valid Cases | 260 |
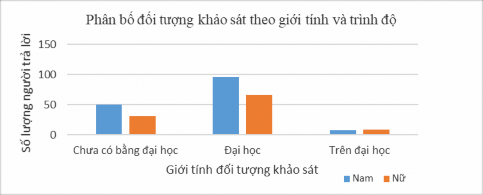
2.3. Results of analysis of the relationship between gender and level of survey subjects
Gender * Education Crosstabulation
Count | |||||
Education | Total | ||||
No college degree | University | Above university | |||
Gender | Male | 50 | 96 | 8 | 154 |
Female | 31 | 66 | 9 | 106 | |
Total | 81 | 162 | 17 | 260 | |
Value | df | Asymp. Sig. (2-sided) | |
Pearson Chi-Square | 1.252 a | 2 | .535 |
Likelihood Ratio | 1,233 | 2 | .540 |
Linear-by-Linear Association | .840 | 1 | .359 |
N of Valid Cases | 260 |
Chi-Square Tests
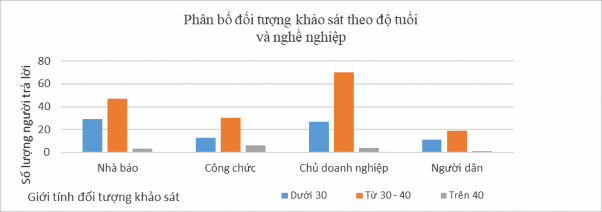
2.4. Results of analysis of the relationship between age and occupation of the survey subjects
Ages * Occupation Crosstabulation
Count | ||||||
Occupation | Total | |||||
Journalist | Officer | Business owner | People | |||
Ages | Under 30 | 29 | 13 | 27 | 11 | 80 |
From 30 - 40 | 47 | 30 | 70 | 19 | 166 | |
Over 40 | 3 | 6 | 4 | 1 | 14 | |
Total | 79 | 49 | 101 | 31 | 260 | |
Chi-Square Tests
Value | df | Asymp. Sig. (2-sided) | |
Pearson Chi-Square | 8.042 a | 6 | .235 |
Likelihood Ratio | 6,992 | 6 | .322 |
Linear-by-Linear Association | .226 | 1 | .634 |
N of Valid Cases | 260 |
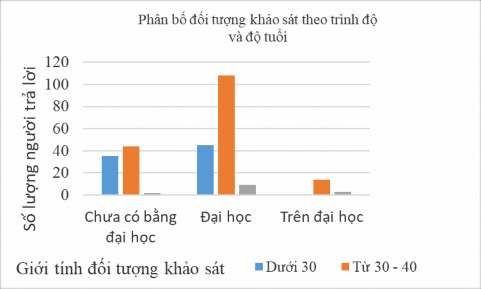
2.5. Results of analysis of the relationship between age and education level of survey subjects
Ages * Education Crosstabulation
Count | |||||
Education | Total | ||||
No college degree | University | Above university | |||
Ages | Under 30 | 35 | 45 | 0 | 80 |
From 30 - 40 | 44 | 108 | 14 | 166 | |
Over 40 | 2 | 9 | 3 | 14 | |
Total | 81 | 162 | 17 | 260 | |
Chi-Square Tests
Value | df | Asymp. Sig. (2-sided) | |
Pearson Chi-Square | 18,076 a | 4 | .001 |
Likelihood Ratio | 21,376 | 4 | .000 |
Linear-by-Linear Association | 15,908 | 1 | .000 |
N of Valid Cases | 260 |
2.6. Results of analysis of the relationship between occupation and level of survey subjects
Occupation * Education Crosstabulation
Count |
Education | Total | ||||
No college degree | University | Above university | |||
Occupation | Journalist | 28 | 47 | 4 | 79 |
Officer | 10 | 34 | 5 | 49 | |
Business owner | 31 | 63 | 7 | 101 | |
People | 12 | 18 | 1 | 31 | |
Total | 81 | 162 | 17 | 260 | |
Chi-Square Tests
Value | df | Asymp. Sig. (2-sided) | |
Pearson Chi-Square | 5.256 a | 6 | .511 |
Likelihood Ratio | 5,433 | 6 | .490 |
Linear-by-Linear Association | .020 | 1 | .888 |
N of Valid Cases | 260 |
Appendix 3. RESULTS OF CHI-SQUARE TEST
Chi square test is used when we want to see if there is a relationship between two categorical variables in a population. The hypothesis of chi square test is stated as follows:
Hypothesis H0 = The categorical variables are two independent variables
Hypothesis H1= Categorical variables are not two independent variables
To conclude whether to accept or reject the hypothesis H0, we will use appropriate tests. Based on the P-value (p-value or sig.) to conclude whether to accept or reject the hypothesis H0. If the p-value (sig.) ≤ α (significance level), the hypothesis H0 is rejected. This means that there is a significant relationship between the variables to be tested. If the p-value (sig.) > α (significance level), H0 is accepted. Otherwise, there is no relationship between the variables to be tested. The most common significance level is 5% or 0.05.
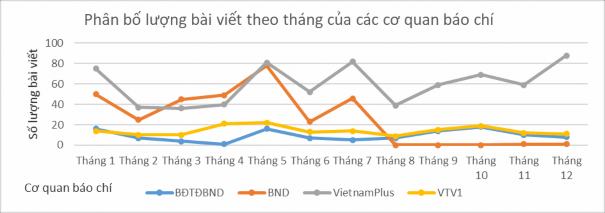
3.1. Chi2 test results on the relationship between articles of press agencies distributed by month
Press Agency * Month of publication
Number of posts per month | ||||||||||||||
January | February | March | April | May | June | July | August | September | October | November | December | Total | ||
Press agency | BĐTDBND | 16 | 7 | 4 | 1 | 16 | 7 | 5 | 7 | 14 | 18 | 10 | 8 | 11 3 |
BND | 50 | 25 | 45 | 49 | 78 | 23 | 46 | 0 | 0 | 0 | 1 | 1 | 31 8 | |
VietnamPlus | 75 | 37 | 36 | 40 | 81 | 52 | 82 | 39 | 59 | 69 | 59 | 88 | 71 7 | |
VTV1 | 14 | 10 | 10 | 21 | 22 | 13 | 14 | 9 | 15 | 19 | 12 | 11 | 17 0 | |
Total | 15 5 | 79 | 95 | 11 1 | 19 7 | 95 | 14 7 | 55 | 88 | 10 6 | 82 | 10 8 | 13 18 | |
Chi-Square Tests
Value | df | Asymp. Sig. (2-sided) | |
Pearson Chi-Square | 260,768 a | 33 | .000 |
Likelihood Ratio | 343,972 | 33 | .000 |
Linear-by-Linear Association | 31,262 | 1 | .000 |
N of Valid Cases | 1318 |