Appendix 2.7: Correlation and regression analysis results
Correlations
F_HU | F_GC | F_NV | F_BH | F_TT | F_CLDV | ||
F_HU F_GC F_NV F_BH F_TT F_CLD V | Pearson Correlation Sig. (2-tailed) N Pearson Correlation Sig. (2-tailed) N Pearson Correlation Sig. (2-tailed) N Pearson Correlation Sig. (2-tailed) N Pearson Correlation Sig. (2-tailed) N Pearson Correlation Sig. (2-tailed) N | 1 | .074 | .440 ** | .511 ** | .013 | .690 ** |
.363 | .000 | .000 | .873 | .000 | |||
155 | 155 | 155 | 155 | 155 | 155 | ||
.074 | 1 | .076 | .090 | .187 * | .240 ** | ||
.363 | .345 | .268 | .020 | .003 | |||
155 | 155 | 155 | 155 | 155 | 155 | ||
.440 ** | .076 | 1 | .510 ** | .089 | .546 ** | ||
.000 | .345 | .000 | .273 | .000 | |||
155 | 155 | 155 | 155 | 155 | 155 | ||
.511 ** | .090 | .510 ** | 1 | .138 | .576 ** | ||
.000 | .268 | .000 | .087 | .000 | |||
155 | 155 | 155 | 155 | 155 | 155 | ||
.013 | .187 * | .089 | .138 | 1 | .214 ** | ||
.873 | .020 | .273 | .087 | .008 | |||
155 | 155 | 155 | 155 | 155 | 155 | ||
.690 ** | .240 ** | .546 ** | .576 ** | .214 ** | 1 | ||
.000 | .003 | .000 | .000 | .008 | |||
155 | 155 | 155 | 155 | 155 | 155 |
Maybe you are interested!
-
 Testing the Difference in Service Quality at Cinestar Hue Cinemas According to the Characteristics of the Research Sample
 -
 The Meaning of Improving Tour Service Quality
 -
 Expanding Fundraising Network and Improving Service Quality
 -
 Improving service quality at DMZ Bar – DMZ Tourism Joint Stock Company - 18
 -
 Customer reviews of customer service quality at Vinpearl Hotel Hue - Vinpearl Joint Stock Company - 1
**. Correlation is significant at the 0.01 level (2-tailed).
*. Correlation is significant at the 0.05 level (2-tailed).
Model Summary b
Model
R | R Square | Adjusted R Square | Std. Error of the Estimate | Durbin-Watson | |
1 | .790a | .625 | .612 | .44302 | 1,896 |
a. Predictors: (Constant), F_TT, F_HU, F_GC, F_NV, F_BH
b. Dependent Variable: F_CLDV
ANOVA a
Model
Sum of Squares | df | Mean Square | F | Sig. | ||
Regression | 48,662 | 5 | 9,732 | 49,588 | .000 b | |
1 | Residual | 29,243 | 149 | .196 | ||
Total | 77,905 | 154 |
a. Dependent Variable: F_CLDV
b. Predictors: (Constant), F_TT, F_HU, F_GC, F_NV, F_BH
Coefficients a
Model
Unstandardized | Coefficients | Standardized Coefficients | t | Sig. | Collinearity | Statistics | ||
B | Std. Error | Beta | Tolerance | VIF | ||||
(Constant) | -.917 | .362 | -2.534 | .012 | ||||
F_HU | .548 | .068 | .488 | 8,083 | .000 | .691 | 1,447 | |
1 | F_GC | .162 | .057 | .146 | 2,842 | .005 | .959 | 1,043 |
F_NV | .193 | .054 | .214 | 3,553 | .001 | .695 | 1,439 | |
F_BH | .184 | .063 | .186 | 2,934 | .004 | .627 | 1,595 | |
F_TT | .182 | .069 | .136 | 2,626 | .010 | .944 | 1,059 | |
a. Dependent Variable: F_CLDV
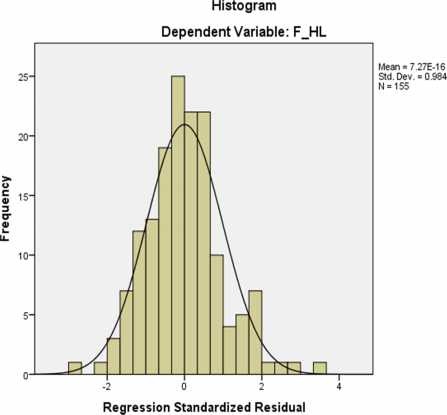
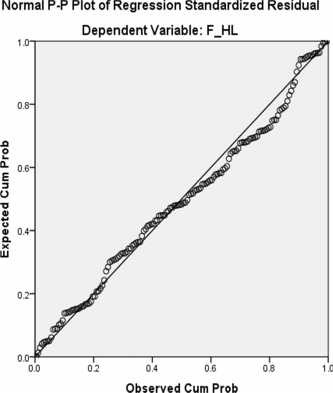
Charts
Appendix 2.8: Results of the difference test
Testing for gender differences
ANOVA
F_CLDV
Sum of Squares | df | Mean Square | F | Sig. | |
Between Groups | .656 | 2 | .328 | .645 | .526 |
Within Groups | 77,249 | 152 | .508 | ||
Total | 77,905 | 154 |
Test for age differences
ANOVA
F_CLDV
Sum of Squares | df | Mean Square | F | Sig. | |
Between Groups | .825 | 3 | .275 | .539 | .656 |
Within Groups | 77,079 | 151 | .510 | ||
Total | 77,905 | 154 |
Graduation thesis Supervisor: Dr. Phan Thanh Hoan
Testing for occupational differences
ANOVA
F_CLDV
Sum of Squares | df | Mean Square | F | Sig. | |
Between Groups | 3.107 | 5 | .621 | 1,238 | .294 |
Within Groups | 74,798 | 149 | .502 | ||
Total | 77,905 | 154 |
SVTH: Ngo Thi Minh Trang 91