The total export turnover of the City in the past 10 years accounted for about 40.0% of the country. However, this proportion has continuously decreased in the past 10 years; from 56.4% in 2000, to 47.0% in 2005 and only 29.4%.
in 2010.
The results of this process show that the City's import-export scale performance curve, although increasing rapidly, is increasingly widening the gap compared to the whole country. Over 10 years, the country's export turnover increased 4.9 times, while the City's increased only 2.6 times.
Thus, the export and import growth of Ho Chi Minh City compared to the whole country has always been relatively high, in the period of 1993-1998 the average export growth reached 25.3%, in the period of 1999-2003 it was 19.8%, in the period of 2004-2009 the average export growth reached 19.2%, import increased by 12.9%. In particular, Ho Chi Minh City has a fairly good trade surplus, the reason is that Ho Chi Minh City port has the advantage of exporting to the provinces of the South Central and Central Highlands, however, the distribution agents of Ho Chi Minh City are not strong enough to act as import agents and distribute goods for the region. Ho Chi Minh City also has the conditions to increase export turnover if it further promotes the advantage of Saigon seaport as the export hub of the provinces of the Southeast and Central Highlands.
Regarding export structure, in 2007 (one year after Vietnam joined the WTO), it was estimated to reach 10,380 million USD, an increase of 15.3% over the same period. Of which, the items with export turnover of over 1 billion USD include: textiles and garments estimated at 2,903 million USD (an increase of 15%), footwear estimated at 1,277 million USD (an increase of 3.7%).
In general, in 2007, the city's export structure has shifted in a positive direction, high-tech products such as computers, electronics, precision mechanical products, nanotechnology products... have high growth rates but export turnover is still limited (reaching 357 million USD, up 58.7% compared to 2006). In particular, the two products of textiles and footwear, although being labor-intensive industries, currently still hold the position of the city's main export in terms of export turnover contribution. This will be an important factor affecting the trend of shifting the city's export structure.
Up to now, the export structure has continued to shift positively towards increasing the proportion of processed and manufactured goods, goods with high technology and intelligence content, and gradually reducing the export of raw goods. Many goods continue to expand production scale, increasing export value such as rice, coffee, rubber, seafood... In 2012, export turnover is estimated at 30.25 billion USD, up 7.36% compared to 2011; if excluding crude oil and gold, the turnover is estimated at 21.55 billion USD, up 13.2%. Of which, the domestic economic sector accounts for 70.9% with turnover reaching 21.45 billion USD, up 4.56%; the FDI sector with turnover of 8.8 billion USD, up 14.87%. In 2012,
Ho Chi Minh City has 5 products with export turnover of over 1 billion USD, including textiles, electrical and electronic products, rice, footwear and rubber.
3.2.2. Basic factors affecting growth and transformation
economic structure
3.2.2.1.Mobilizing investment capital
Ho Chi Minh City's social development investment has increased in both scale and growth rate, creating resources for production development. In general, investment capital plays a major and increasing role in the economy and the socio-economic development because in the long term, investment is the main factor creating the growth process, thereby shifting the economic structure.
For many years, Ho Chi Minh City has always been the country's leader in attracting domestic and foreign investment capital. This is one of the city's strengths and has made an important contribution to the process of economic restructuring and the development of the city's strong areas. The relationship between investment and growth of the city is shown in the table below.
Table 3.10. Summary of investment capital sources of Ho Chi Minh City in the period (1993-2012)
Unit: billion VND
Target
1993 | 1995 | 2000 | 2005 | 2010 | 2012 | |
Total: | 7,278 | 12,713 | 25,852 | 46,645 | 170,098 | 217,074 |
1. State budget capital | 771 | 934 | 2,979 | 8,501 | 21,939 | 20,645 |
water, in which: | ||||||
- Central State budget capital | 32 | 934 | 368 | 960 | 3,189 | 3,685 |
- Local government capital | 739 | 709 | 2,611 | 7,540 | 18,750 | 16,960 |
2. Direct investment capital foreign | ---- | 7,365 | 84,763 | 128,919 | ||
3. Other capital | 6.506 | 30,780 | 63,396 | 67,509 |
Maybe you are interested!
-
 Research Contents Identify Factors Affecting Slow Growth In The Study.
 -
 Factors affecting credit growth at Vietnam's joint stock commercial banks - 1
 -
 Factors affecting credit growth at Vietnamese commercial banks - 11
 -
 Identify Rating Levels and Rating Scales
zt2i3t4l5ee
zt2a3gstourism,quan lan,quang ninh,ecology,ecotourism,minh chau,van don,geography,geographical basis,tourism development,science
zt2a3ge
zc2o3n4t5e6n7ts
of the islanders. Therefore, this indicator will be divided into two sub-indicators:
a1. Natural tourism attractiveness a2. Cultural tourism attractiveness
b. Tourist capacity
The two island communes in Quan Lan have different capacities to receive tourists. Minh Chau Commune is home to many standard hotels and resorts, attracting high-income domestic and international tourists. Meanwhile, Quan Lan Commune has many motels mainly built and operated by local people, so the scale and quality are not high, and will be suitable for ordinary tourists such as students.
c. Time of exploitation of Quan Lan Island Commune:
Quan Lan tourism is seasonal due to weather and climate conditions and festivals only take place on certain days of the year, specifically in spring. In Quan Lan commune, the period from April to June and from September to November is considered the best time to visit Quan Lan because the cultural tourism activities are mainly associated with festivals taking place during this time.
Minh Chau island commune:
Tourism exploitation time is all year round, because this is a place with a number of tourist attractions with diverse ecosystems such as Bai Tu Long National Park Research Center, Tram forest, Turtle Laying Beach, so besides coming to the beach for tourism and vacation in the summer, Minh Chau will attract research groups to come for tourism combined with research at other times of the year.
d. Sustainability
The sustainability of ecotourism sites in Quan Lan and Minh Chau communes depends on the sensitivity of the ecosystems to climate changes.
landscape. In general, these tourist destinations have a fairly high level of sustainability, because they are natural ecosystems, planned and protected. However, if a large number of tourists gather at certain times, it can exceed the carrying capacity and affect the sustainability of the environment (polluted beaches, damaged trees, animals moving away from their habitats, etc.), then the sustainability of the above ecosystems (natural ecosystems, human ecosystems) will also be affected and become less sustainable.
e. Location and accessibility
Both island communes have ports to take tourists to visit from Van Don wharf:
- Quan Lan – Van Don traffic route:
Phuc Thinh – Viet Anh high-speed boat and Quang Minh high-speed boat, depart at 8am and 2pm from Van Don to Quan Lan, and at 7am and 1pm from Quan Lan to Van Don. There are also wooden boats departing at 7am and 1pm.
- Van Don - Minh Chau traffic route:
Chung Huong high-speed train, Minh Chau train, morning 7:30 and afternoon 13:30 from Van Don to Minh Chau, morning 6:30 and afternoon 13:00 from Minh Chau to Van Don.
f. Infrastructure
Despite receiving investment attention, the issue of infrastructure and technical facilities for tourism on Quan Lan Island is still an issue that needs to be resolved because it has a direct impact on the implementation of ecotourism activities. The minimum conditions for serving tourists such as accommodation, electricity, water, communication, especially medical services, and security work need to be given top priority. Ecotourism spots in Minh Chau commune are assessed to have better infrastructure and technical facilities for tourism because there are quite complete and synchronous conditions for serving tourists, meeting many needs of domestic and foreign tourists.
3.2.1.4. Determine assessment levels and assessment scales
Corresponding to the levels of each criterion, the index is the score of those levels in the order of 4, 3, 2, 1 decreasing according to the standard of each level: very attractive (4), attractive (3), average (2), less attractive (1).
3.2.1.5. Determining the coefficients of the criteria
For the assessment of DLST in the two communes of Quan Lan and Minh Chau islands, the students added evaluation coefficients to show the importance of the criteria and indicators as follows:
Coefficient 3 with criteria: Attractiveness, Exploitation time. These are the 2 most important criteria for attracting tourists to tourism in general and eco-tourism in particular, so they have the highest coefficient.
Coefficient 2 with criteria: Capacity, Infrastructure, Location and accessibility . Because the assessment area is an island commune of Van Don district, the above criteria are selected by the author with appropriate coefficients at the average level.
Coefficient 1 with criteria: Sustainability. Quan Lan has natural and human-made ecotourism sites, with high biodiversity and little impact from local human factors. Most of the ecotourism sites are still wild, so they are highly sustainable.
3.2.1.6. Results of DLST assessment on Quan Lan island
a. Assessment of the potential for natural tourism development
For Minh Chau commune:
+ Natural tourism attractiveness is determined to be very attractive (4 points) and the most important coefficient (coefficient 3), so the score of the Attractiveness criterion is 4 x 3 = 12.
+ Capacity is determined as average (2 points) and the coefficient is quite important (coefficient 2), then the score of Capacity criterion is 2 x 2 = 4.
+ Exploitation time is long (4 points), the most important coefficient (coefficient 3) so the score of the Exploitation time criterion is 4 x 3 = 12.
+ Sustainability is determined as sustainable (4 points), the important coefficient is the average coefficient (coefficient 1), so the score of the Sustainability criterion is 4 x 1 = 4 points
+ Location and accessibility are determined to be quite favorable (2 points), the coefficient is quite important (coefficient 2), the criterion score is 2 x 2 = 4 points.
+ Infrastructure is assessed as good (3 points), the coefficient is quite important (coefficient 2), then the score of the Infrastructure criterion is 3 x 2 = 6 points.
The total score for evaluating DLST in Minh Chau commune according to 6 evaluation criteria is determined as: 12 + 4 + 12 + 4 + 4 + 6 = 42 points
Similar assessment for Quan Lan commune, we have the following table:
Table 3.3: Assessment of the potential for natural ecotourism development in Quan Lan and Minh Chau communes
Attractiveness of self-tourismof course
Capacity
Mining time
Sustainability
Location and accessibility
Infrastructure
Result
Point
DarkMulti
Point
DarkMulti
Point
DarkMulti
Point
DarkMulti
Point
DarkMulti
Point
DarkMulti
CommuneMinh Chau
12
12
4
8
12
12
4
4
4
8
6
8
42/52
Quan CommuneLan
6
12
6
8
9
12
4
4
4
8
4
8
33/52
b. Assessment of the potential for humanistic tourism development
For Quan Lan commune:
+ The attractiveness of human tourism is determined to be very attractive (4 points) and the most important coefficient (coefficient 3), so the score of the Attractiveness criterion is 4 x 3 = 12.
+ Capacity is determined to be large (3 points) and the coefficient is quite important (coefficient 2), then the score of the Capacity criterion is 3 x 2 = 6.
+ Mining time is average (3 points), the most important coefficient (coefficient 3) so the score of the Mining time criterion is 3 x 3 = 9.
+ Sustainability is determined as sustainable (4 points), the important coefficient is the average coefficient (coefficient 1), so the score of the Sustainability criterion is 4 x 1 = 4 points.
+ Location and accessibility are determined to be quite favorable (2 points), the coefficient is quite important (coefficient 2), the criterion score is 2 x 2 = 4 points.
+ Infrastructure is rated as average (2 points), the coefficient is quite important (coefficient 2), then the score of the Infrastructure criterion is 2 x 2 = 4 points.
The total score for evaluating DLST in Quan Lan commune according to 6 evaluation criteria is determined as: 12 + 6 + 6 + 4 + 4 + 4 = 36 points.
Similar assessment with Minh Chau commune we have the following table:
Table 3.4: Assessment of the potential for developing humanistic eco-tourism in Quan Lan and Minh Chau communes
Attractiveness of human tourismliterature
Capacity
Mining time
Sustainability
Location and accessibility
Infrastructure
Result
Point
DarkMulti
Point
DarkMulti
Point
DarkMulti
Point
DarkMulti
Point
DarkMulti
Point
DarkMulti
Quan CommuneLan
12
12
6
8
9
12
4
4
4
8
4
8
39/52
Minh CommuneChau
6
12
4
8
12
12
4
4
4
8
6
8
36/52
Basically, both Minh Chau and Quan Lan localities have quite favorable conditions for developing ecotourism. However, Quan Lan commune has more advantages to develop ecotourism in a humanistic direction, because this is an area with many famous historical relics such as Quan Lan Communal House, Quan Lan Pagoda, Temple worshiping the hero Tran Khanh Du, ... along with local festivals held annually such as the wind praying ceremony (March 15), Quan Lan festival (June 10-19); due to its location near the port and long exploitation time, the beaches in Quan Lan commune (especially Quan Lan beach) are no longer hygienic and clean to ensure the needs of tourists coming to relax and swim; this is also an area with many beautiful landscapes such as Got Beo wind pass, Ong Phong head, Voi Voi cave, but the ability to access these places is still very limited (dirt hill road, lots of gravel and rocks), especially during rainy and windy times; In addition, other natural resources such as mangrove forests and sea worms have not been really exploited for tourism purposes and ecotourism development. On the contrary, Minh Chau commune has more advantages in developing ecotourism in the direction of natural tourism, this is an area with diverse ecosystems such as at Rua De Beach, Bai Tu Long National Park Conservation Center...; Minh Chau beach is highly appreciated for its natural beauty and cleanliness, ranked in the top ten most beautiful beaches in Vietnam; Minh Chau commune is also home to Tram forest with a large area and a purity of up to 90%, suitable for building bridges through the forest (a very effective type of natural ecotourism currently applied by many countries) for tourists to sightsee, as well as for the purpose of studying and researching.
Figure 3.1: Thenmala Forest Bridge (India) Source: https://www.thenmalaecotourism.com/(August 21, 2019)
3.2.2. Using SWOT matrix to evaluate Quan Lan island tourism
General assessment of current tourism activities of Quan Lan island is shown through the following SWOT matrix:
Table 3.5: SWOT matrix evaluating tourism activities on Quan Lan island
Internal agent
Strengths- There is a lot of potential for tourism development, especially natural ecotourism and humanistic ecotourism.- The unskilled labor force is relatively abundant.- resource environmentunpolluted, still
Weaknesses- Poorly developed infrastructure, especially traffic routes to tourist destinations on the island.- The team of professional staff is still weak.- Tourism products in general
quite wild, originalintact
general and DLST in particularalone is monotonous.
External agents
Opportunity- Tourism is a key industry in the socio-economic development strategy of the province and Van Don economic zone.- Quan Lan was selected as a pilot area for eco-tourism development within the framework of the green growth project between Quang Ninh province and the Japanese organization JICA.- The flow of tourists and especially ecotourism in the world tends toincreasing
Challenge- Weather and climate change abnormally.- Competition in tourism products is increasingly fierce, especially with other localities in the province such as Ha Long, Mong Cai...- Awareness of tourists, especially domestic tourists, about ecotourism and nature conservation is not high.
Through summary analysis using SWOT matrix we see that:
To exploit strengths and take advantage of opportunities, it is necessary to:
- Diversify products and service types (build more tourism routes aimed at specific needs of tourists: experiential tourism immersed in nature, spiritual cultural tourism...)
- Effective exploitation of resources and differentiated products (natural resources and human resources)
div.maincontent .p { color: black; font-family:"Times New Roman", serif; font-style: normal; font-weight: normal; text-decoration: none; font-size: 14pt; margin:0pt; } div.maincontent p { color: black; font-family:"Times New Roman", serif; font-style: normal; font-weight: normal; text-decoration: none; font-size: 14pt; margin:0pt; } div.maincontent .s1 { color: black; font-family:"Times New Roman", serif; font-style: normal; font-weight: normal; text-decoration: none; font-size: 13pt; } div.maincontent .s2 { color: black; font-family:"Times New Roman", serif; font-style: normal; font-weight: normal; text-decoration: none; font-size: 13pt; } div.maincontent .s3 { color: #0D0D0D; font-family:"Times New Roman", serif; font-style: normal; font-weight: bold; text-decoration: none; font-size: 14pt; } div.maincontent .s4 { color: black; font-family:"Times New Roman", serif; font-style: italic; font-weight: normal; text-decoration: none; font-size: 14pt; } div.maincontent .s5 { color: black; font-family:"Times New Roman", serif; font-style: italic; font-weight: bold; text-decoration: none; font-size: 14pt; } div.maincontent .s6 { color: black; font-family:"Times New Roman", serif; font-style: italic; font-weight: normal; text-decoration: none; font-size: 14pt; vertical-align: -3pt; } div.maincontent .s7 { color: black; font-family:"Times New Roman", serif; font-style: italic; font-weight: normal; text-decoration: none; font-size: 14pt; vertical-align: -2pt; } div.maincontent .s8 { color: black; font-family:"Times New Roman", serif; font-style: italic; font-weight: normal; text-decoration: none; font-size: 14pt; vertical-align: -1pt; } div.maincontent .s9 { color: black; font-family:"Times New Roman", serif; font-style: normal; font-weight: normal; text-decoration: none; font-size: 14pt; } div.maincontent .s10 { color: black; font-family:"Times New Roman", serif; font-style: normal; font-weight: bold; text-decoration: none; font-size: 14pt; } div.maincontent .s11 { color: black; font-family:"Times New Roman", serif; font-style: normal; font-weight: normal; text-decoration: none; font-size: 14pt; } div.maincontent .s12 { color: black; font-family:Symbol, serif; font-style: normal; font-weight: normal; text-decoration: none; font-size: 14pt; } div.maincontent .s13 { color: black; font-family:Wingdings; font-style: normal; font-weight: normal; text-decoration: none; font-size: 14pt; } div.maincontent .s14 { color: black; font-family:"Times New Roman", serif; font-style: normal; font-weight: normal; text-decoration: none; font-size: 9pt; vertical-align: 5pt; } div.maincontent .s15 { color: black; font-family:"Times New Roman", serif; font-style: normal; font-weight: normal; text-decoration: none; font-size: 9pt; vertical-align: 5pt; } div.maincontent .s16 { color: black; font-family:Cambria, serif; font-style: italic; font-weight: normal; text-decoration: none; font-size: 14pt; } div.maincontent .s17 { color: #080808; font-family:"Times New Roman", serif; font-style: normal; font-weight: bold; text-decoration: none; font-size: 14pt; } div.maincontent .s18 { color: #080808; font-family:"Times New Roman", serif; font-style: normal; font-weight: normal; text-decoration: none; font-size: 14pt; } div.maincontent .s19 { color: black; font-family:"Times New Roman", serif; font-style: normal; font-weight: normal; text-decoration: none; font-size: 11pt; } div.maincontent .s20 { color: black; font-family:"Times New Roman", serif; font-style: normal; font-weight: normal; text-decoration: none; font-size: 10pt; } div.maincontent .s21 { color: black; font-family:"Times New Roman", serif; font-style: normal; font-weight: bold; text-decoration: none; font-size: 11pt; } div.maincontent .s22 { color: black; font-family:"Times New Roman", serif; font-style: normal; font-weight: normal; text-decoration: none; font-size: 11pt; } div.maincontent .s23 { color: black; font-family:"Times New Roman", serif; font-style: italic; font-weight: normal; text-decoration: none; font-size: 14pt; } div.maincontent .s24 { color: #212121; font-family:"Times New Roman", serif; font-style: normal; font-weight: normal; tex
Identify Rating Levels and Rating Scales
zt2i3t4l5ee
zt2a3gstourism,quan lan,quang ninh,ecology,ecotourism,minh chau,van don,geography,geographical basis,tourism development,science
zt2a3ge
zc2o3n4t5e6n7ts
of the islanders. Therefore, this indicator will be divided into two sub-indicators:
a1. Natural tourism attractiveness a2. Cultural tourism attractiveness
b. Tourist capacity
The two island communes in Quan Lan have different capacities to receive tourists. Minh Chau Commune is home to many standard hotels and resorts, attracting high-income domestic and international tourists. Meanwhile, Quan Lan Commune has many motels mainly built and operated by local people, so the scale and quality are not high, and will be suitable for ordinary tourists such as students.
c. Time of exploitation of Quan Lan Island Commune:
Quan Lan tourism is seasonal due to weather and climate conditions and festivals only take place on certain days of the year, specifically in spring. In Quan Lan commune, the period from April to June and from September to November is considered the best time to visit Quan Lan because the cultural tourism activities are mainly associated with festivals taking place during this time.
Minh Chau island commune:
Tourism exploitation time is all year round, because this is a place with a number of tourist attractions with diverse ecosystems such as Bai Tu Long National Park Research Center, Tram forest, Turtle Laying Beach, so besides coming to the beach for tourism and vacation in the summer, Minh Chau will attract research groups to come for tourism combined with research at other times of the year.
d. Sustainability
The sustainability of ecotourism sites in Quan Lan and Minh Chau communes depends on the sensitivity of the ecosystems to climate changes.
landscape. In general, these tourist destinations have a fairly high level of sustainability, because they are natural ecosystems, planned and protected. However, if a large number of tourists gather at certain times, it can exceed the carrying capacity and affect the sustainability of the environment (polluted beaches, damaged trees, animals moving away from their habitats, etc.), then the sustainability of the above ecosystems (natural ecosystems, human ecosystems) will also be affected and become less sustainable.
e. Location and accessibility
Both island communes have ports to take tourists to visit from Van Don wharf:
- Quan Lan – Van Don traffic route:
Phuc Thinh – Viet Anh high-speed boat and Quang Minh high-speed boat, depart at 8am and 2pm from Van Don to Quan Lan, and at 7am and 1pm from Quan Lan to Van Don. There are also wooden boats departing at 7am and 1pm.
- Van Don - Minh Chau traffic route:
Chung Huong high-speed train, Minh Chau train, morning 7:30 and afternoon 13:30 from Van Don to Minh Chau, morning 6:30 and afternoon 13:00 from Minh Chau to Van Don.
f. Infrastructure
Despite receiving investment attention, the issue of infrastructure and technical facilities for tourism on Quan Lan Island is still an issue that needs to be resolved because it has a direct impact on the implementation of ecotourism activities. The minimum conditions for serving tourists such as accommodation, electricity, water, communication, especially medical services, and security work need to be given top priority. Ecotourism spots in Minh Chau commune are assessed to have better infrastructure and technical facilities for tourism because there are quite complete and synchronous conditions for serving tourists, meeting many needs of domestic and foreign tourists.
3.2.1.4. Determine assessment levels and assessment scales
Corresponding to the levels of each criterion, the index is the score of those levels in the order of 4, 3, 2, 1 decreasing according to the standard of each level: very attractive (4), attractive (3), average (2), less attractive (1).
3.2.1.5. Determining the coefficients of the criteria
For the assessment of DLST in the two communes of Quan Lan and Minh Chau islands, the students added evaluation coefficients to show the importance of the criteria and indicators as follows:
Coefficient 3 with criteria: Attractiveness, Exploitation time. These are the 2 most important criteria for attracting tourists to tourism in general and eco-tourism in particular, so they have the highest coefficient.
Coefficient 2 with criteria: Capacity, Infrastructure, Location and accessibility . Because the assessment area is an island commune of Van Don district, the above criteria are selected by the author with appropriate coefficients at the average level.
Coefficient 1 with criteria: Sustainability. Quan Lan has natural and human-made ecotourism sites, with high biodiversity and little impact from local human factors. Most of the ecotourism sites are still wild, so they are highly sustainable.
3.2.1.6. Results of DLST assessment on Quan Lan island
a. Assessment of the potential for natural tourism development
For Minh Chau commune:
+ Natural tourism attractiveness is determined to be very attractive (4 points) and the most important coefficient (coefficient 3), so the score of the Attractiveness criterion is 4 x 3 = 12.
+ Capacity is determined as average (2 points) and the coefficient is quite important (coefficient 2), then the score of Capacity criterion is 2 x 2 = 4.
+ Exploitation time is long (4 points), the most important coefficient (coefficient 3) so the score of the Exploitation time criterion is 4 x 3 = 12.
+ Sustainability is determined as sustainable (4 points), the important coefficient is the average coefficient (coefficient 1), so the score of the Sustainability criterion is 4 x 1 = 4 points
+ Location and accessibility are determined to be quite favorable (2 points), the coefficient is quite important (coefficient 2), the criterion score is 2 x 2 = 4 points.
+ Infrastructure is assessed as good (3 points), the coefficient is quite important (coefficient 2), then the score of the Infrastructure criterion is 3 x 2 = 6 points.
The total score for evaluating DLST in Minh Chau commune according to 6 evaluation criteria is determined as: 12 + 4 + 12 + 4 + 4 + 6 = 42 points
Similar assessment for Quan Lan commune, we have the following table:
Table 3.3: Assessment of the potential for natural ecotourism development in Quan Lan and Minh Chau communes
Attractiveness of self-tourismof course
Capacity
Mining time
Sustainability
Location and accessibility
Infrastructure
Result
Point
DarkMulti
Point
DarkMulti
Point
DarkMulti
Point
DarkMulti
Point
DarkMulti
Point
DarkMulti
CommuneMinh Chau
12
12
4
8
12
12
4
4
4
8
6
8
42/52
Quan CommuneLan
6
12
6
8
9
12
4
4
4
8
4
8
33/52
b. Assessment of the potential for humanistic tourism development
For Quan Lan commune:
+ The attractiveness of human tourism is determined to be very attractive (4 points) and the most important coefficient (coefficient 3), so the score of the Attractiveness criterion is 4 x 3 = 12.
+ Capacity is determined to be large (3 points) and the coefficient is quite important (coefficient 2), then the score of the Capacity criterion is 3 x 2 = 6.
+ Mining time is average (3 points), the most important coefficient (coefficient 3) so the score of the Mining time criterion is 3 x 3 = 9.
+ Sustainability is determined as sustainable (4 points), the important coefficient is the average coefficient (coefficient 1), so the score of the Sustainability criterion is 4 x 1 = 4 points.
+ Location and accessibility are determined to be quite favorable (2 points), the coefficient is quite important (coefficient 2), the criterion score is 2 x 2 = 4 points.
+ Infrastructure is rated as average (2 points), the coefficient is quite important (coefficient 2), then the score of the Infrastructure criterion is 2 x 2 = 4 points.
The total score for evaluating DLST in Quan Lan commune according to 6 evaluation criteria is determined as: 12 + 6 + 6 + 4 + 4 + 4 = 36 points.
Similar assessment with Minh Chau commune we have the following table:
Table 3.4: Assessment of the potential for developing humanistic eco-tourism in Quan Lan and Minh Chau communes
Attractiveness of human tourismliterature
Capacity
Mining time
Sustainability
Location and accessibility
Infrastructure
Result
Point
DarkMulti
Point
DarkMulti
Point
DarkMulti
Point
DarkMulti
Point
DarkMulti
Point
DarkMulti
Quan CommuneLan
12
12
6
8
9
12
4
4
4
8
4
8
39/52
Minh CommuneChau
6
12
4
8
12
12
4
4
4
8
6
8
36/52
Basically, both Minh Chau and Quan Lan localities have quite favorable conditions for developing ecotourism. However, Quan Lan commune has more advantages to develop ecotourism in a humanistic direction, because this is an area with many famous historical relics such as Quan Lan Communal House, Quan Lan Pagoda, Temple worshiping the hero Tran Khanh Du, ... along with local festivals held annually such as the wind praying ceremony (March 15), Quan Lan festival (June 10-19); due to its location near the port and long exploitation time, the beaches in Quan Lan commune (especially Quan Lan beach) are no longer hygienic and clean to ensure the needs of tourists coming to relax and swim; this is also an area with many beautiful landscapes such as Got Beo wind pass, Ong Phong head, Voi Voi cave, but the ability to access these places is still very limited (dirt hill road, lots of gravel and rocks), especially during rainy and windy times; In addition, other natural resources such as mangrove forests and sea worms have not been really exploited for tourism purposes and ecotourism development. On the contrary, Minh Chau commune has more advantages in developing ecotourism in the direction of natural tourism, this is an area with diverse ecosystems such as at Rua De Beach, Bai Tu Long National Park Conservation Center...; Minh Chau beach is highly appreciated for its natural beauty and cleanliness, ranked in the top ten most beautiful beaches in Vietnam; Minh Chau commune is also home to Tram forest with a large area and a purity of up to 90%, suitable for building bridges through the forest (a very effective type of natural ecotourism currently applied by many countries) for tourists to sightsee, as well as for the purpose of studying and researching.
Figure 3.1: Thenmala Forest Bridge (India) Source: https://www.thenmalaecotourism.com/(August 21, 2019)
3.2.2. Using SWOT matrix to evaluate Quan Lan island tourism
General assessment of current tourism activities of Quan Lan island is shown through the following SWOT matrix:
Table 3.5: SWOT matrix evaluating tourism activities on Quan Lan island
Internal agent
Strengths- There is a lot of potential for tourism development, especially natural ecotourism and humanistic ecotourism.- The unskilled labor force is relatively abundant.- resource environmentunpolluted, still
Weaknesses- Poorly developed infrastructure, especially traffic routes to tourist destinations on the island.- The team of professional staff is still weak.- Tourism products in general
quite wild, originalintact
general and DLST in particularalone is monotonous.
External agents
Opportunity- Tourism is a key industry in the socio-economic development strategy of the province and Van Don economic zone.- Quan Lan was selected as a pilot area for eco-tourism development within the framework of the green growth project between Quang Ninh province and the Japanese organization JICA.- The flow of tourists and especially ecotourism in the world tends toincreasing
Challenge- Weather and climate change abnormally.- Competition in tourism products is increasingly fierce, especially with other localities in the province such as Ha Long, Mong Cai...- Awareness of tourists, especially domestic tourists, about ecotourism and nature conservation is not high.
Through summary analysis using SWOT matrix we see that:
To exploit strengths and take advantage of opportunities, it is necessary to:
- Diversify products and service types (build more tourism routes aimed at specific needs of tourists: experiential tourism immersed in nature, spiritual cultural tourism...)
- Effective exploitation of resources and differentiated products (natural resources and human resources)
div.maincontent .p { color: black; font-family:"Times New Roman", serif; font-style: normal; font-weight: normal; text-decoration: none; font-size: 14pt; margin:0pt; } div.maincontent p { color: black; font-family:"Times New Roman", serif; font-style: normal; font-weight: normal; text-decoration: none; font-size: 14pt; margin:0pt; } div.maincontent .s1 { color: black; font-family:"Times New Roman", serif; font-style: normal; font-weight: normal; text-decoration: none; font-size: 13pt; } div.maincontent .s2 { color: black; font-family:"Times New Roman", serif; font-style: normal; font-weight: normal; text-decoration: none; font-size: 13pt; } div.maincontent .s3 { color: #0D0D0D; font-family:"Times New Roman", serif; font-style: normal; font-weight: bold; text-decoration: none; font-size: 14pt; } div.maincontent .s4 { color: black; font-family:"Times New Roman", serif; font-style: italic; font-weight: normal; text-decoration: none; font-size: 14pt; } div.maincontent .s5 { color: black; font-family:"Times New Roman", serif; font-style: italic; font-weight: bold; text-decoration: none; font-size: 14pt; } div.maincontent .s6 { color: black; font-family:"Times New Roman", serif; font-style: italic; font-weight: normal; text-decoration: none; font-size: 14pt; vertical-align: -3pt; } div.maincontent .s7 { color: black; font-family:"Times New Roman", serif; font-style: italic; font-weight: normal; text-decoration: none; font-size: 14pt; vertical-align: -2pt; } div.maincontent .s8 { color: black; font-family:"Times New Roman", serif; font-style: italic; font-weight: normal; text-decoration: none; font-size: 14pt; vertical-align: -1pt; } div.maincontent .s9 { color: black; font-family:"Times New Roman", serif; font-style: normal; font-weight: normal; text-decoration: none; font-size: 14pt; } div.maincontent .s10 { color: black; font-family:"Times New Roman", serif; font-style: normal; font-weight: bold; text-decoration: none; font-size: 14pt; } div.maincontent .s11 { color: black; font-family:"Times New Roman", serif; font-style: normal; font-weight: normal; text-decoration: none; font-size: 14pt; } div.maincontent .s12 { color: black; font-family:Symbol, serif; font-style: normal; font-weight: normal; text-decoration: none; font-size: 14pt; } div.maincontent .s13 { color: black; font-family:Wingdings; font-style: normal; font-weight: normal; text-decoration: none; font-size: 14pt; } div.maincontent .s14 { color: black; font-family:"Times New Roman", serif; font-style: normal; font-weight: normal; text-decoration: none; font-size: 9pt; vertical-align: 5pt; } div.maincontent .s15 { color: black; font-family:"Times New Roman", serif; font-style: normal; font-weight: normal; text-decoration: none; font-size: 9pt; vertical-align: 5pt; } div.maincontent .s16 { color: black; font-family:Cambria, serif; font-style: italic; font-weight: normal; text-decoration: none; font-size: 14pt; } div.maincontent .s17 { color: #080808; font-family:"Times New Roman", serif; font-style: normal; font-weight: bold; text-decoration: none; font-size: 14pt; } div.maincontent .s18 { color: #080808; font-family:"Times New Roman", serif; font-style: normal; font-weight: normal; text-decoration: none; font-size: 14pt; } div.maincontent .s19 { color: black; font-family:"Times New Roman", serif; font-style: normal; font-weight: normal; text-decoration: none; font-size: 11pt; } div.maincontent .s20 { color: black; font-family:"Times New Roman", serif; font-style: normal; font-weight: normal; text-decoration: none; font-size: 10pt; } div.maincontent .s21 { color: black; font-family:"Times New Roman", serif; font-style: normal; font-weight: bold; text-decoration: none; font-size: 11pt; } div.maincontent .s22 { color: black; font-family:"Times New Roman", serif; font-style: normal; font-weight: normal; text-decoration: none; font-size: 11pt; } div.maincontent .s23 { color: black; font-family:"Times New Roman", serif; font-style: italic; font-weight: normal; text-decoration: none; font-size: 14pt; } div.maincontent .s24 { color: #212121; font-family:"Times New Roman", serif; font-style: normal; font-weight: normal; tex -
 GDP and GDP Growth Rate of Hanoi as of December 31, 2006, by Economic Sector - Calculated at 1994 Prices
Source: Ho Chi Minh City Statistical Yearbook (1993-2012)
140000
120000
100000
State budget capital
Foreign investment Other capital
80000
60000
40000
20000
0
1993 1995 1997 1999 2001 2003 2005 2007 2009 2011
Chart 3.3. Summary chart of investment capital in Ho Chi Minh City during the period (1993-2012)
Looking at the graph (Chart 3.3), we see that Ho Chi Minh City's investment capital is always increasing, in which other capital sources account for the highest proportion, the structure of foreign direct investment capital
Foreign direct investment has always played an important role. If in 1994, foreign investment capital began to be invested at 2,868 billion VND, by 1998, foreign direct investment capital in the city was 8,217 billion VND, especially in 1997 it was 8,749 billion VND. Since 1999, this capital source has begun to change. From 2000 to 2005, the investment level stagnated at 6,319 billion VND to 7,365 billion VND. During the period from 2006 to 2012, foreign direct investment capital in the city increased very rapidly. If in 2006 it was 8,929 billion VND, in 2008 it was 18,976 billion VND, in 2010 it was 84,763 billion VND and especially in 2012 it was 128,919 billion VND. This shows that along with investment capital from the budget, foreign direct investment capital in Ho Chi Minh City also plays a very important role in the economic development process of the city and the national economic restructuring process.
Table 3.11. Investment capital and investment ratio compared to GDP in the period 1993-2012
Year
Invest (billion VND - actual price) | GDP (billion VND - actual price) | Investment/GDP (%) | |
1993 | 7,278 | 23,722 | 31 |
1994 | 9,556 | 28,271 | 34 |
1995 | 12,713 | 36,975 | 34 |
1996 | 18,643 | 45,545 | 41 |
1997 | 22,959 | 52,765 | 44 |
1998 | 23,984 | 61,226 | 39 |
1999 | 18,897 | 69,001 | 27 |
2000 | 25,853 | 75,862 | 34 |
2001 | 28,535 | 84,852 | 34 |
2002 | 32,413 | 96,402 | 34 |
2003 | 36,628 | 113,325 | 33 |
2004 | 46,996 | 137,086 | 34 |
2005 | 46,645 | 165,296 | 28 |
2006 | 54,751 | 160,561 | 34 |
2007 | 77,670 | 229,197 | 34 |
2008 | 99,407 | 287,513 | 35 |
2009 | 117,897 | 334,190 | 35 |
2010 | 170,098 | 463,295 | 36 |
2011 | 202,937 | 576,225 | 35 |
2012 | 217074 | 658,676 | 32 |
Source: Ho Chi Minh City Statistical Yearbook (1993-2012)
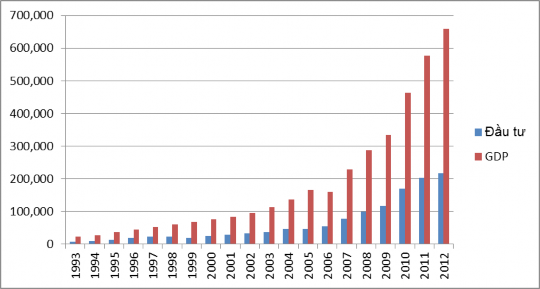
Figure 3.4. Graph of the relationship between investment and GDP of Ho Chi Minh City in the period (1993-2012)
From the above data we see that the city's investment capital is always valued and always
occupy billion
high proportion of the city's GDP in 1999 due to
terrible impact
Due to the financial crisis in Southeast Asia, the city's economy was also affected. Investment capital in 1999 accounted for the lowest proportion in the entire period (1993-2012), accounting for 27% of GDP. In other years, it was over 33%, especially in 1997, it accounted for 44% of GDP. Since 2008, the city's economy as well as the whole country has been affected by the global recession, so investment has also been affected. In 2008 and 2009, the city's investment capital accounted for 35% of the city's GDP. In 2012, the city's investment capital accounted for 32% of GDP.
The investment situation in the city by area is listed in the following table:
Table 3.12. Investment capital structure in Ho Chi Minh City divided by region in the period 1993-2012
Unit (%)
Target
1993 (%) | 1995 (%) | 2000 (%) | 2005 (%) | 2010 (%) | 2012 (%) | |
Domestic area | 100 | 57.8 | 63.1 | 83.4 | 50.2 | 40.6 |
Investment area foreign | 0 | 42.2 | 36.9 | 16.6 | 49.8 | 59.4 |
Total | 100 | 100 | 100 | 100 | 100 | 100 |
Source: Ho Chi Minh City Statistical Yearbook (1993-2012)
120
Domestic sector Total investment
Foreign invested area
100
80
60
40
20
1993
1995
1997
1999
2001
2003
2005
2007
2009
2011
0
Chart 3.5. Domestic and foreign investment period (1993-2012).
From the above data, we can see that the proportion of foreign investment capital in Ho Chi Minh City plays an important role. During the period (1994-2000), this proportion always remained above 30% of total investment capital. During the period (2001-2004), the proportion of investment capital in the foreign-invested sector gradually decreased from 29.4% in 2001 to 17.3% in 2004. During the period (2005-2012), the proportion of investment capital in the foreign-invested sector always increased at a high level. In 2005, the increase was 16.5%, in 2008, 2009 it was 18.5%, in 2010 it was 49.8%, in 2011 it was 49.8%.
2011 was 59.9% and 2012 was 59.4%.
In 10 years of developing industrial parks and export processing zones, 13 industrial parks and export processing zones have been established and attracted 326 foreign investment projects, 317 domestic projects with a total investment capital of more than 1.29 billion USD and nearly 6,500 billion VND. More than 500 factories have been put into operation, contributing 3.36 billion USD in export turnover and creating jobs for more than 100,000 workers. These moves have contributed to promoting industrial development and promoting urbanization in Ho Chi Minh City. In general, industrial parks and export processing zones have been operating stably, especially those with relatively complete infrastructure. Up to now, the occupancy rate in industrial parks and export processing zones has reached 70% in phase 1; the occupancy rate in industrial parks and export processing zones in Ho Chi Minh City has reached 50% or more. In 2005, the total foreign and domestic investment capital in foreign currency was 310 million USD, reaching 91% of the set target but still ranked in the top 3 positions among the total 67 industrial parks - export processing zones of the country and the results of attracting investment capital in the year, at the same time, there were 109 more factories put into production; most of the enterprises operated normally, the country's export turnover, the fourth year of trade surplus was 160 million USD. In 2007, industrial parks and export processing zones attracted 16,000 more workers, bringing the total number of workers, the highest in recent years, bringing the total number of workers in industrial parks and export processing zones to over 100,000 people.
Number of Investment Licenses in the city and registered investment capital of industrial parks and
Although the EPZ has declined in recent times, compared to the general situation of the country, Ho Chi Minh City still achieved positive results. The average investment capital of a foreign investment license is 4.35 million USD, and that of a domestic investment license is 16.75 billion VND. In 2007 alone, the average investment capital of a foreign investment license was 1.68 million USD, lower than the average of previous years; the average capital of a domestic investment license was 24.4 billion VND, higher than the average of previous years.
There have been 18 foreign countries and territories investing in industrial parks and export processing zones (Asia: 9, Europe and America: 6, Canada, Australia). Of which, the 5 countries and territories with the largest investment capital are: Japan (408.80 million USD) with 55 investment licenses), Taiwan (275.77 million USD with 106 investment licenses), Hong Kong (130.28 million USD with 18 investment licenses), (Netherlands 98.40 million USD with 4 investment licenses), South Korea (69.92 million USD with 31 investment licenses). (For details, see Appendix No. 06/LA-TS)
Ask for a favor
incentive and support mechanisms and policies
support
invest
into industrial parks and export processing zones
open and has many incentives from the city government, thus attracting
many projects
investment project
into industrial parks and export processing zones. According to the Management Board of Industrial Parks and Export Processing Zones
Ho Chi Minh City, in 2007, the total import-export turnover of the two export processing zones Tan Thuan and Linh Trung in Ho Chi Minh City reached 5,385.79 million USD. Of which, exports were 2,741.41 million USD, an increase of 33.8% compared to 1999; imports were 644.38 million USD, an increase of 43.3%. Goods from the export processing zones were exported to over 50 countries and regions in the world, earning 2,728.44 million USD, equal to 98.2% of export turnover. Japan was the country with the highest proportion of 44.0%, followed by the EU (25.4%), Taiwan (9.3%), ASEAN countries (4.4%), the US (2.0%),... Goods exported to the domestic market only reached 82.97 million USD, accounting for 1.8% of export turnover. Products and services with investment capital accounting for a large proportion of total investment capital in industrial parks and export processing zones are presented in Table 3.13 below.
Table 3.13. Products and services with investment capital in industrial parks and export processing zones
Tan Thuan Export Processing Zone
Linh Trung Export Processing Zone | Other Industrial Parks | ||||||
Foreign capital | Domestic capital | Foreign capital | Domestic capital | ||||
Electricity, electronics | 30% | Shoe | 34% | Chemicals, pharmaceuticals | 23% | Rubber, plastic | 25% |
Textile, sewing | 18% | Electricity, electricity death | 17% | Food | 14% | Textile | 20% |
Mechanical | 14% | Textile, sewing | 15% | Wood, packaging | 11% | Wood, packaging | 12% |
Plastic | 11% | Wood processing | 8% | Mechanical | 7% | Food | 9% |
Source: Management Board of Export Processing Zones and Industrial Parks of Ho Chi Minh City
3.2.2.2. Labor force
The annual increase in the city's labor force is shown in the following table: In 1993, the city's labor force was 1.668 million workers, in 1997 it was 1.834 million workers, an increase of 9.9%, in 1998 it was 1.883 million workers, in 2002 it was 2.405 million workers, an increase of 27%, and in 2003 it was 2.503 workers, and in 2009 it was 3.118 million workers, an increase of 25.5%. If we consider the entire period, we see that over 17 years, the city's labor force increased by 1.450 million workers, equivalent to 53%, on average the city's labor force increased by 3.1%/year.
3.2.2.3.Policies and measures
city law
has been deployed to transfer
economic restructuring, improving growth quality
In recent times, specifically from 2006 to present, the City Party Committee and Government have paid special attention to the task of promoting economic restructuring and transforming the economic growth model with the aim of promoting rapid, effective and sustainable growth. Among many drastic measures, it is necessary to mention the economic restructuring support programs approved at the City Party Congresses for two terms in 2006.
-2010 and 2011 -2015.
- The economic restructuring support program was identified by the 8th City Party Congress (2006-2010 period) as one of the city's five lever programs. After 5 years of implementation, the program has contributed to promoting the city's economic restructuring in a positive and right direction. The city's economic structure has changed in the direction of gradually increasing the proportion of service sectors; gradually reducing the proportion of industry and agriculture to gradually turn the city into a service - trade and high-tech industrial center of the country. In addition, internal economic sectors have also changed in a positive direction; increasing the proportion of high value-added goods and services, high science and technology content; forming high-quality service types; reducing labor-intensive industries that cause environmental pollution.
The average growth rate of gross domestic product (GDP) in the city during the period of 2006 - 2010 was 11%/year, equivalent to the average GDP growth rate during the period of 2001 - 2005 (reaching 11%). In which, the period of 2006 - 2007 had high growth, in 2006 it increased by 12.2%, in 2007 it reached 12.6%; in the period of 2008 - 2010, due to the impact of the financial crisis and the world economic recession, the socio-economic situation of the city was negatively affected; leading to a slower economic growth rate compared to previous years, in 2008 it increased by 10.7%, in 2009 it increased by 8.5% and in 2010 it increased by over 11.8%. Of which, the service sector has the highest average annual growth rate, reaching 12.0%/year, 1.2 times higher than the average growth rate of the period.
period 2001 - 2005 (10%/year); industrial and construction sector achieved an average growth rate of 10%/year, lower than the average growth rate of the period 2001-2005 (reaching 12.37%); agricultural sector's average growth rate was equal to the period 2001-2005 at 5%/year.
The contribution of sectors to GDP also has positive changes; the service sector still accounts for the largest proportion, from 51.3% in 2006 to 54.5% in 2010, the industrial - construction sector tends to decrease, from 47.4% in 2006 to 44.3% in 2010; the agricultural sector tends to contribute to the city's GDP relatively stable, in 2010 it was 1.2%.
The structure of economic sectors in GDP has also shifted strongly towards the strong development and increasing contribution of the non-state economic sector and the foreign-invested economic sector. Specifically, the proportion of the non-state economic sector in GDP increased from 46.8% in 2006 to 49.3% in 2009; the foreign-invested economic sector increased from 20.7% in 2006 to 23.3% in 2009; while the proportion of the state economic sector in GDP decreased sharply from 32.5% in 2006 to 27.4% in 2009. This is consistent with the city's policy and orientation in recent times, which is to focus on promoting the development of economic sectors in order to promote the potential and mobilize capital from the whole society, domestic and foreign, to invest in the city's economic development.
In general, the City's CDCCKT Support Program has achieved positive results but is still slow; policies and solutions to support CDCCKT issued are not strong enough and have not created a breakthrough; internal restructuring of economic sectors is also slow; the proportion of service and industrial sectors with added value and high technology content is still low.
- The 9th City Party Congress continued to identify the Program to support the economic restructuring and transformation of the city's economic growth model in the period of 2011 - 2015 as one of the six breakthrough programs. On that basis, the City People's Committee issued Decision 24/2011/QD-UBND on the Plan to implement the Resolution of the 9th City Party Congress on the Economic restructuring program and transformation of the city's economic growth model in the period of 2011 - 2015. The Economic restructuring program aims at the general goal of: Concentrating resources to promote the economic restructuring, rapidly developing industries, industrial products and services with high scientific and technological content, high added value, high efficiency and competitiveness; developing high-tech agriculture; leading the country in transforming the economic growth model from extensive development to