Bank standards are not, .... So if KPI is used to evaluate the strength of the bank's brand among employees, it is also necessary to add qualitative indicators as I mentioned above.
Source: Excerpt from group interviews in the author's research
In my opinion, for customer management specialists, KPI is just a result and only partly reflects the actions of employees towards the bank brand and I do not agree to use it to measure the strength of the bank brand in employees. I think it will not be accurate.
As a credit manager for corporate clients, I think that completing KPIs is not a good indicator of whether or not an employee loves or is committed to the bank. Credit officers are under a lot of pressure and are heavily dependent on their clients, sometimes there are occupational accidents caused by clients that the clients themselves do not want. No matter how good a credit officer is or how much he or she loves the bank, if he or she encounters such occupational accidents, it will be difficult for him or her to complete KPIs.
As a manager in an indirect department, I think that completing the KPI targets assigned by my bank is not difficult and therefore using this indicator to measure does not demonstrate the strength of the bank's brand among employees.
Source: Excerpt from group interviews in the author's research
Evaluate the measurement items of the independent variables in the model
For example, with the statement “communication in the bank is very good”, I will somewhat disagree with the word “very”. For me, communication in my bank is good and if I say so, I will be able to give it a level of 5 completely agree, or a level of 4 relatively agree and at what level I give, you can feel the level of “goodness” of communication activities in my bank. However, if the statement is “communication in the bank is very good”, I will hesitate to choose from 1 to 5, and perhaps I will choose none. There are many similar statements.
Source: personal interview with a credit department manager at a large bank in Hanoi
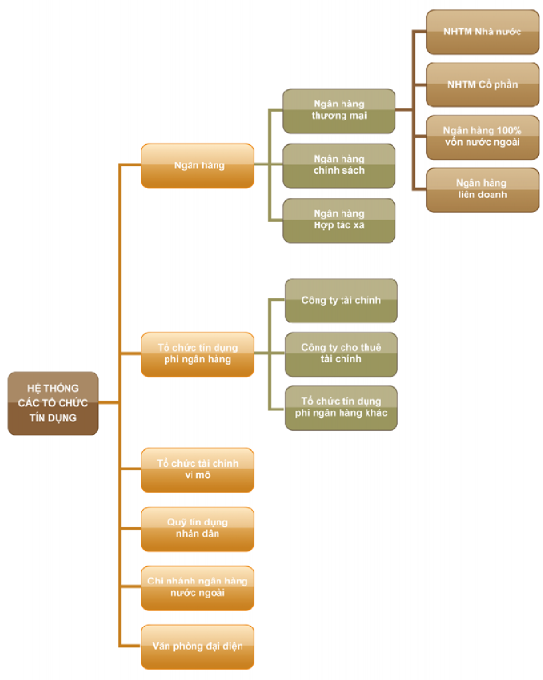
3.10 Diagram of the credit institution system in the Vietnamese market
3.11. Number of survey forms at Vietnamese commercial banks (preliminary research)
Frequency | Percent | Valid Percent | Cumulative Percent | |
Vietnamese | 28 | 11.3 | 11.3 | 11.3 |
SHB | 12 | 4.9 | 4.9 | 16.2 |
Eximbank | 15 | 6.1 | 6.1 | 22.3 |
PG bank | 15 | 6.1 | 6.1 | 28.3 |
Agribank | 9 | 3.6 | 3.6 | 32.0 |
Tien Phong Bank | 7 | 2.8 | 2.8 | 34.8 |
Vietinbank | 31 | 12.6 | 12.6 | 47.4 |
Lienviet bank | 10 | 4.0 | 4.0 | 51.4 |
BIDV | 16 | 6.5 | 6.5 | 57.9 |
VIB | 11 | 4.5 | 4.5 | 62.3 |
Bac A | 11 | 4.5 | 4.5 | 66.8 |
VP Bank | 18 | 7.3 | 7.3 | 74.1 |
VCB | 38 | 15.4 | 15.4 | 89.5 |
HD Bank | 8 | 3.2 | 3.2 | 92.7 |
ACB | 9 | 3.6 | 3.6 | 96.4 |
Maritime B | 9 | 3.6 | 3.6 | 100.0 |
Total | 247 | 100.0 | 100.0 |
Maybe you are interested!
-

 Factors affecting brand value based on employees of Vietnamese commercial banks - 24
 -
 Factors affecting the debt repayment ability of corporate customers at Vietnam Joint Stock Commercial Bank for Investment and Development - Long An Branch - 1
 -
 Factors affecting the brand value of the Bank for Agriculture and Rural Development of Vietnam - 15
 -
 Factors affecting lending behavior of Vietnamese commercial banks - 2
 -
 Factors affecting customer satisfaction with the quality of international money transfer services at Dong A Commercial Joint Stock Bank - 1
APPENDIX CHAPTER 4
4.1. Number of survey forms at Vietnamese commercial banks (official research)
Frequency | Percent | Valid Percent | cumulative Percent | |
Vietnamese | 28 | 5.5 | 5.5 | 5.5 |
SHB | 24 | 4.7 | 4.7 | 10.2 |
Eximbank | 50 | 9.8 | 9.8 | 19.9 |
PG bank | 30 | 5.9 | 5.9 | 25.8 |
Agribank | 6 | 1.2 | 1.2 | 27.0 |
Tien Phong Bank | 17 | 3.3 | 3.3 | 30.3 |
Vietinbank | 48 | 9.4 | 9.4 | 39.6 |
Lienviet bank | 16 | 3.1 | 3.1 | 42.8 |
BIDV | 16 | 3.1 | 3.1 | 45.9 |
VIB | 37 | 7.2 | 7.2 | 53.1 |
Bac A | 47 | 9.2 | 9.2 | 62.3 |
VP Bank | 51 | 10.0 | 10.0 | 72.3 |
VCB | 46 | 9.0 | 9.0 | 81.3 |
HD Bank | 5 | 1.0 | 1.0 | 82.2 |
ACB | 19 | 3.7 | 3.7 | 85.9 |
Maritime B | 20 | 3.9 | 3.9 | 89.8 |
GP Bank | 27 | 5.3 | 5.3 | 95.1 |
Sacombank | 25 | 4.9 | 4.9 | 100.0 |
Total | 512 | 100.0 | 100.0 |
4.2. Cronbach' alpha analysis results from formal quantitative research
Scale: commitment to the brand
Reliability Statistics
Cronbach's
Alpha
N of Items | |
.862 | 6 |
Item-Total Statistics
Scale Mean if Item Deleted | Scale Variance if Item Deleted | Corrected Item- Total Correlation | Cronbach's Alpha if Item Deleted | |
CK1 | 20.20 | 13,038 | .653 | .840 |
CK2 | 19.91 | 13,556 | .666 | .838 |
CK3 | 20.05 | 13,907 | .594 | .850 |
CK4 | 20.39 | 13,620 | .619 | .846 |
CK5 | 20.34 | 13,011 | .734 | .825 |
CK6 | 20.41 | 12,649 | .673 | .837 |
Scale: brand-oriented actions
Reliability Statistics
Cronbach's
Alpha
N of Items | |
.892 | 7 |
Item-Total Statistics
Scale Mean if Item Deleted | Scale Variance if Item Deleted | Corrected Item- Total Correlation | Cronbach's Alpha if Item Deleted | |
HD1 | 23.68 | 19,458 | .557 | .894 |
HD2
23.62 | 19,453 | .734 | .872 | |
HD3 | 23.59 | 19,179 | .715 | .873 |
HD4 | 23.79 | 19,381 | .665 | .879 |
HD5 | 23.53 | 18,637 | .721 | .872 |
HD6 | 23.50 | 18,845 | .771 | .867 |
HD7 | 23.57 | 19,084 | .694 | .876 |
Scale: Relationship orientation
Reliability Statistics
Cronbach's
Alpha
N of Items | |
.910 | 8 |
Item-Total Statistics
Scale Mean if Item Deleted | Scale Variance if Item Deleted | Corrected Item- Total Correlation | Cronbach's Alpha if Item Deleted | |
DHQH1 | 26.39 | 22,098 | .699 | .899 |
DHQH2 | 26.68 | 22,116 | .638 | .905 |
DHQH3 | 26.71 | 21,046 | .782 | .892 |
DHQH4 | 26.60 | 21,392 | .749 | .895 |
DHQH5 | 26.46 | 21,548 | .744 | .896 |
DHQH6 | 26.76 | 22,408 | .675 | .901 |
DHQH7 | 26.92 | 21,999 | .678 | .901 |
DHQH8 | 26.63 | 21,443 | .709 | .899 |
Scale: Luxury
Reliability Statistics
Cronbach's
Alpha
N of Items | |
.922 | 7 |
Item-Total Statistics
Scale Mean if Item Deleted | Scale Variance if Item Deleted | Corrected Item- Total Correlation | Cronbach's Alpha if Item Deleted | |
XHH1 | 23.12 | 17,724 | .831 | .903 |
XHH2 | 23.26 | 18,229 | .641 | .922 |
XHH3 | 23.01 | 18,448 | .712 | .914 |
XHH4 | 22.99 | 17,935 | .783 | .907 |
XHH5 | 23.00 | 17,898 | .775 | .908 |
XHH6 | 23.09 | 17,666 | .742 | .911 |
XHH7 | 23.08 | 17,152 | .821 | .903 |
Scale: Reception
Reliability Statistics
Cronbach's
Alpha
N of Items | |
.924 | 6 |
Item-Total Statistics
Scale Mean if Item Deleted | Scale Variance if Item Deleted | Corrected Item- Total Correlation | Cronbach's Alpha if Item Deleted | |
TN1 | 19.88 | 15.155 | .728 | .917 |
TN2 | 19.70 | 14,390 | .814 | .906 |
TN3 | 19.73 | 14,503 | .782 | .910 |
TN4 | 19.65 | 14,344 | .732 | .918 |
TN5 | 19.71 | 14,461 | .828 | .904 |
TN6 | 19.81 | 14,484 | .807 | .906 |
Scale: Demand - response
Reliability Statistics
Cronbach's Alpha
N of Items | |
.779 | 9 |
Item-Total Statistics
Scale Mean if Item Deleted | Scale Variance if Item Deleted | Corrected Item- Total Correlation | Cronbach's Alpha if Item Deleted | |
NS1 | 27.29 | 19,371 | .554 | .745 |
NS2 | 27.49 | 18,019 | .680 | .724 |
NS3 | 28.40 | 23,645 | -.033 | .829 |
NS4 | 27.24 | 18,928 | .615 | .736 |
NS5 | 27.24 | 18,246 | .704 | .723 |
NS6 | 27.38 | 19,031 | .576 | .741 |
NS7 | 28.26 | 23,467 | -.008 | .823 |
NS8 | 27.33 | 18,525 | .654 | .730 |
NS9 | 27.35 | 18,468 | .644 | .731 |
Scale: Demand - response 2
Reliability Statistics
Cronbach's
Alpha
N of Items | |
.892 | 7 |
Item-Total Statistics
Scale Mean if Item Deleted | Scale Variance if Item Deleted | Corrected Item- Total Correlation | Cronbach's Alpha if Item Deleted | |
NS1 | 21.95 | 18,080 | .657 | .880 |
NS2 | 22.15 | 17,024 | .740 | .870 |
NS4 | 21.90 | 17,927 | .676 | .878 |
NS5 | 21.90 | 17,337 | .753 | .869 |
NS6 | 22.04 | 17,847 | .662 | .880 |
NS8 | 21.99 | 17,933 | .653 | .881 |
NS9 | 22.02 | 17,604 | .683 | .877 |
4.3. Exploratory factor analysis for independent variables – initial EFA results
head
Total Variance Explained
Factor
Initial | Eigenvalues | Extraction Sums of Squared Loadings | Rotation Sums of Squared Loadings a | ||||
Total | % of Variance | cumulative % | Total | % of Variance | cumulative % | Total | |
1 | 14,619 | 52,210 | 52,210 | 14,248 | 50,886 | 50,886 | 11,400 |
2 | 1,755 | 6,269 | 58,479 | 1,394 | 4,979 | 55,866 | 11,435 |
3 | 1,502 | 5,364 | 63,843 | 1,133 | 4,046 | 59,912 | 10,150 |
4 | 1,040 | 3,714 | 67,557 | .652 | 2,329 | 62,240 | 11,196 |
5 | .879 | 3.139 | 70,695 | ||||
6 | .783 | 2,797 | 73,492 | ||||
7 | .717 | 2,561 | 76,053 | ||||
8 | .601 | 2,146 | 78,199 | ||||
9 | .551 | 1,967 | 80,166 | ||||
10 | .541 | 1,934 | 82,099 | ||||
11
.495 | 1,768 | 83,867 | ||||
12 | .461 | 1,646 | 85,513 | |||
13 | .434 | 1,550 | 87,063 | |||
14 | .427 | 1.525 | 88,588 | |||
15 | .369 | 1,318 | 89,907 | |||
16 | .336 | 1.201 | 91,108 | |||
17 | .313 | 1,117 | 92,225 | |||
18 | .291 | 1,039 | 93,264 | |||
19 | .277 | .988 | 94,252 | |||
20 | .249 | .889 | 95,141 | |||
21 | .238 | .848 | 95,990 | |||
22 | .210 | .749 | 96,738 | |||
23 | .195 | .697 | 97,435 | |||
24 | .180 | .642 | 98,077 | |||
25 | .174 | .622 | 98,699 | |||
26 | .154 | .550 | 99,249 | |||
27 | .127 | .454 | 99,703 | |||
28 | .083 | .297 | 100,000 |
Extraction Method: Principal Axis Factoring.
a. When factors are correlated, sums of squared loadings cannot be added to obtain a total variance.
Pattern Matrix a
Fa | actor | |||
1 | 2 | 3 | 4 | |
DHQH1 | .102 | .325 | -.200 | .562 |
DHQH2 | -.029 | .014 | -.022 | .752 |
DHQH3 | -.094 | .311 | .112 | .550 |
DHQH4 | -.090 | .380 | -.050 | .599 |
DHQH5 | .057 | .323 | -.006 | .435 |
DHQH6 | .402 | .140 | .257 | .052 |
DHQH7 | .355 | .016 | .252 | .212 |
DHQH8 | .265 | .186 | .023 | .370 |
XHH1 | -.067 | .694 | .154 | .121 |
XHH2 | .017 | .180 | .198 | .438 |
XHH3 | .071 | .769 | -.052 | -.022 |
XHH4 | .093 | .638 | .021 | .109 |
XHH5 | .046 | .781 | -.080 | .066 |
XHH6 | .093 | .678 | .053 | .001 |
XHH7 | -.046 | .790 | .104 | .050 |
TN1 | .682 | .015 | .053 | .053 |
TN2 | .912 | .089 | -.045 | -.143 |
TN3 | .833 | .077 | -.004 | -.107 |
TN4 | .885 | -.119 | -.049 | .006 |
TN5 | .824 | -.023 | -.085 | .164 |
TN6 | .744 | .139 | .034 | -.020 |
NS1 | .291 | .023 | .265 | .281 |
NS2 | .010 | -.180 | .524 | .487 |
NS4 | .003 | -.131 | .618 | .263 |
NS5 | .016 | -.022 | .678 | .176 |
NS6 | .039 | -.161 | .620 | .184 |
NS8 | -.166 | .184 | .862 | -.188 |
NS9 | .087 | .213 | .817 | -.322 |
Extraction Method: Principal Axis Factoring. Rotation Method: Promax with Kaiser Normalization.
a. Rotation converged in 6 iterations.
4.4. Exploratory factor analysis for independent variables – final EFA results
Kaiser-Meyer-Olkin Measure of Sampling
Adequacy.
Approx. Chi-Square
Bartlett's Test of
.937
9385.702
253
.000
KMO and Bartlett's Test
Sphericity
df
Sig.
Total Variance Explained
Factor
Initial | Eigenvalues | Extraction Sums of Squared Loadings | Rotation Sums of Squared Loadings a | ||||
Total | % of Variance | cumulative % | Total | % of Variance | cumulative % | Total | |
1 | 11,934 | 51,887 | 51,887 | 11,583 | 50,361 | 50,361 | 8,865 |
2 | 1,733 | 7,535 | 59,422 | 1,366 | 5,941 | 56,302 | 9,574 |
3 | 1,449 | 6,300 | 65,722 | 1,084 | 4,711 | 61,013 | 8,231 |
4 | 1.001 | 4,353 | 70,075 | .618 | 2,685 | 63,698 | 9,066 |
5 | .797 | 3,464 | 73,539 | ||||
6 | .708 | 3,077 | 76,617 | ||||
7 | .570 | 2,478 | 79,095 | ||||
8 | .549 | 2,389 | 81,484 | ||||
9 | .493 | 2,144 | 83,628 | ||||
10 | .466 | 2,027 | 85,655 | ||||
11 | .427 | 1,854 | 87,509 | ||||
12 | .397 | 1.725 | 89,234 | ||||
13 | .322 | 1.401 | 90,635 | ||||
14 | .320 | 1,392 | 92,028 | ||||
15 | .281 | 1,220 | 93,247 | ||||
16 | .264 | 1,148 | 94,396 | ||||
17 | .258 | 1.124 | 95,519 | ||||
18 | .231 | 1.002 | 96,522 | ||||
19 | .210 | .911 | 97,433 | ||||
20 | .200 | .870 | 98,304 | ||||
21 | .170 | .740 | 99,044 | ||||
22 | .134 | .582 | 99,626 | ||||
23 | .086 | .374 | 100,000 | ||||
Extraction Method: Principal Axis Factoring.
a. When factors are correlated, sums of squared loadings cannot be added to obtain a total variance.
Pattern Matrix a
Fa | actor | |||
1 | 2 | 3 | 4 | |
DHQH1 | .117 | .196 | -.162 | .653 |
DHQH2 | .026 | -.095 | .076 | .717 |
DHQH3 | -.080 | .136 | .154 | .679 |
DHQH4 | -.063 | .222 | -.006 | .695 |
DHQH5 | .047 | .178 | .015 | .573 |
XHH1 | -.045 | .719 | .154 | .068 |
XHH3 | .060 | .730 | -.078 | .050 |
XHH4 | .091 | .690 | .036 | .045 |
XHH5 | .038 | .825 | -.091 | .039 |
XHH6 | .073 | .708 | .051 | -.014 |
XHH7
-.043 | .809 | .086 | .042 | |
TN1 | .661 | .012 | .101 | .048 |
TN2 | .879 | .112 | -.020 | -.130 |
TN3 | .810 | .066 | .018 | -.069 |
TN4 | .828 | -.082 | -.009 | .006 |
TN5 | .790 | -.041 | -.035 | .191 |
TN6 | .696 | .119 | .049 | .055 |
NS2 | .043 | -.103 | .568 | .210 |
NS4 | .054 | -.116 | .681 | .137 |
NS5 | .057 | .002 | .748 | .048 |
NS6 | .075 | -.110 | .674 | .049 |
NS8 | -.153 | .152 | .800 | -.105 |
NS9 | .064 | .189 | .727 | -.187 |
Extraction Method: Principal Axis Factoring. Rotation Method: Promax with Kaiser Normalization.
a. Rotation converged in 6 iterations.
4.5. Exploratory factor analysis for dependent variables
KMO and Bartlett's Test
Kaiser-Meyer-Olkin Measure of Sampling Adequacy.
.905 | |
Approx. Chi-Square | 3822.525 |
Bartlett's Test of Sphericity df | 78 |
Sig. | .000 |
Total Variance Explained
Factor
Initial | Eigenvalues | Extraction Sums of Squared Loadings | Rotation Sums of Squared Loadings a | ||||
Total | % of Variance | Cumulative % | Total | % of Variance | Cumulative % | Total | |
1 | 6,718 | 51,676 | 51,676 | 6,273 | 48,252 | 48,252 | 5,764 |
2 | 1,234 | 9,489 | 61,165 | .796 | 6.120 | 54,373 | 5.175 |
3 | .839 | 6,450 | 67,615 | ||||
4 | .786 | 6,043 | 73,658 | ||||
5 | .601 | 4,626 | 78,284 | ||||
6 | .544 | 4.181 | 82,465 | ||||
7 | .473 | 3,640 | 86,105 | ||||
8 | .436 | 3.355 | 89,460 | ||||
9 | .342 | 2,629 | 92,089 | ||||
10 | .330 | 2,539 | 94,628 | ||||
11 | .247 | 1,897 | 96,525 | ||||
12 | .230 | 1,773 | 98,298 | ||||
13 | .221 | 1,702 | 100,000 | ||||
Extraction Method: Principal Axis Factoring.
a. When factors are correlated, sums of squared loadings cannot be added to obtain a total variance.
Pattern Matrix a
Fa | actor | |
1 | 2 | |
CK1 | -.172 | .858 |
CK2 | .025 | .694 |
CK3 | .248 | .559 |
CK4 | .238 | .590 |
CK5 | .040 | .779 |
CK6 | .190 | .600 |
HD1 | .519 | .111 |
HD2 | .699 | .085 |
HD3 | .688 | .092 |
HD4
.731 | -.035 | |
HD5 | .778 | -.013 |
HD6 | .816 | .032 |
HD7 | .807 | -.062 |
Extraction Method: Principal Axis Factoring.
Rotation Method: Promax with Kaiser Normalization.
a. Rotation converged in 3 iterations.
4.6. CFA standardized weight table of internal brand strength concept
Standardized Regression Weights: (Group number 1 - Default model)
Estimate | |||
var1.1 | <--- | commitment | .715 |
var1.2 | <--- | commitment | .727 |
var1.3 | <--- | commitment | .682 |
var1.4 | <--- | commitment | .686 |
var1.5 | <--- | commitment | .779 |
var1.6 | <--- | commitment | .767 |
var1.7 | <--- | Hanh Dong | .648 |
var1.8 | <--- | Hanh Dong | .765 |
var1.9 | <--- | Hanh Dong | .773 |
var1.10 | <--- | Hanh Dong | .724 |
var1.11 | <--- | Hanh Dong | .795 |
var1.12 | <--- | Hanh Dong | .830 |
var1.13 | <--- | Hanh Dong | .732 |
4.7 Unstandardized weight table of CFA concept of internal brand strength
Regression Weights: (Group number 1 - Default model)
Estimate | SE | CR | P | Label | |
var1.1 <--- commit | 1,000 | ||||
var1.2 <--- log | .926 | .059 | 15,580 | *** | |
var1.3 <--- log | .901 | .062 | 14,621 | *** | |
var1.4 <--- log | .856 | .058 | 14,713 | *** | |
var1.5 <--- log | .997 | .060 | 16,659 | *** | |
var1.6 <--- log | 1,127 | .069 | 16,413 | *** | |
var1.7 <--- hanhdong | 1,000 | ||||
var1.8 <--- hanhdong | 1,018 | .068 | 14,917 | *** | |
var1.9 <--- hanhdong | 1,092 | .073 | 15,049 | *** | |
var1.10 <--- hanhdong | 1,021 | .072 | 14,268 | *** | |
var1.11 <--- hanhdong | 1,224 | .080 | 15,379 | *** | |
var1.12 <--- hanhdong | 1,186 | .075 | 15,904 | *** | |
var1.13 <--- hanhdong | 1,066 | .074 | 14,399 | *** | |
4.8 Correlation coefficients between the component concepts of internal brand strength
Correlations: (Group number 1 - Default model)
Estimate | |
commitment <--> action | .885 |
4.9. Critical model normalization weight table
Standardized Regression Weights: (Group number 1 - Default model)
Estimate | |||
var4.9 | <--- | need | .736 |
var4.8 | <--- | need | .724 |
var4.6 | <--- | need | .724 |
var4.5 | <--- | need | .813 |
var4.4 | <--- | need | .755 |
var4.2 | <--- | need | .781 |
var1.1 | <--- | commitment | .706 |
var1.2 | <--- | commitment | .727 |
var1.3 | <--- | commitment | .689 |
var1.4 | <--- | commitment | .686 |
var1.5 | <--- | commitment | .776 |
var1.6 | <--- | commitment | .771 |
var3.6 | <--- | contact | .837 |
var3.5 | <--- | contact | .869 |
var3.4 | <--- | contact | .738 |
var3.3 | <--- | contact | .791 |
var3.2 | <--- | contact | .805 |
var3.1 | <--- | contact | .697 |
var2.15 | <--- | XHH | .810 |
var2.14 | <--- | XHH | .799 |
var2.13 | <--- | XHH | .808 |
var2.12 | <--- | XHH | .830 |
var2.11 | <--- | XHH | .741 |
var2.9 | <--- | XHH | .825 |
var1.7 | <--- | Hanh Dong | .675 |
var1.8 | <--- | Hanh Dong | .789 |
var1.9 | <--- | Hanh Dong | .769 |
var1.10 | <--- | Hanh Dong | .713 |
var1.11 | <--- | Hanh Dong | .788 |
var1.12 | <--- | Hanh Dong | .816 |
var1.13 | <--- | Hanh Dong | .721 |
var2.5 | <--- | DHQH | .759 |
var2.4 | <--- | DHQH | .832 |
var2.3 | <--- | DHQH | .838 |
var2.2 | <--- | DHQH | .674 |
Estimate | |
var2.1 <--- DHQH | .734 |
4.10. Unstandardized weight table of critical model
Regression Weights: (Group number 1 - Default model)
Estimate | SE | CR | P | Label | |
var4.9 <--- needcaudapung | 1,000 | ||||
var4.8 <--- needcaudapung | .946 | .058 | 16,218 | *** | |
var4.6 <--- needcaudapung | .954 | .059 | 16,229 | *** | |
var4.5 <--- needcaudapung | 1,071 | .058 | 18,370 | *** | |
var4.4 <--- needcaudapung | .985 | .058 | 16,967 | *** | |
var4.2 <--- needcaudapung | 1,157 | .066 | 17,596 | *** | |
var1.1 <--- commit | 1,000 | ||||
var1.2 <--- log | .937 | .060 | 15,522 | *** | |
var1.3 <--- log | .921 | .063 | 14,726 | *** | |
var1.4 <--- log | .865 | .059 | 14,665 | *** | |
var1.5 <--- log | 1,007 | .061 | 16,538 | *** | |
var1.6 <--- log | 1,148 | .070 | 16,432 | *** | |
var3.6 <--- continue | 1,000 | ||||
var3.5 <--- continue | 1,036 | .042 | 24,698 | *** | |
var3.4 <--- continue | .934 | .049 | 19,245 | *** | |
var3.3 <--- continue | .945 | .044 | 21,287 | *** | |
var3.2 <--- continue | .953 | .044 | 21,882 | *** | |
var3.1 <--- continue | .796 | .045 | 17,776 | *** | |
var2.15 <--- XHH | 1,000 | ||||
var2.14 <--- XHH | .971 | .047 | 20,779 | *** | |
var2.13 <--- XHH | .954 | .045 | 21,129 | *** | |
var2.12 <--- XHH | .959 | .044 | 21,953 | *** | |
var2.11 <--- XHH | .842 | .045 | 18,775 | *** | |
var2.9 <--- XHH | .943 | .043 | 21,763 | *** | |
var1.7 <--- hanhdong | 1,000 | ||||
var1.8 <--- hanhdong | 1,008 | .062 | 16,339 | *** | |
var1.9 <--- hanhdong | 1,042 | .065 | 15,974 | *** | |
var1.10 <--- hanhdong | .965 | .065 | 14,927 | *** | |
var1.11 <--- hanhdong | 1,165 | .071 | 16,326 | *** | |
var1.12 <--- hanhdong | 1,119 | .066 | 16,832 | *** | |
var1.13 <--- hanhdong | 1,008 | .067 | 15,081 | *** | |
var2.5 <--- DHQH | 1,000 | ||||
var2.4 <--- DHQH | 1.111 | .056 | 19,712 | *** | |
var2.3 <--- DHQH | 1.131 | .057 | 19,879 | *** | |
var2.2 <--- DHQH | .913 | .059 | 15,508 | *** | |
var2.1 <--- DHQH | .918 | .054 | 17,055 | *** | |