Table 3.4. Effects of potassium and sulfur dosage on theoretical yield and actual yield of Arabica coffee plants in the commercial stage
Recipe
Case 1 (2018) | Case 2 (2019) | Yield (tons of kernels/ha) (average of 2 crops) | |||||
NSLT (tons of fresh ripe fruit/ha) | NSTT (tons of fresh ripe fruit/ha) | Increase compared to DC2 (%) | NSLT (tons of fresh ripe fruit/ha) | NSTT (tons of fresh ripe fruit/ha) | Increase compared to DC2 (%) | ||
1 (DC1) | 17.50b | 10.87 cd | - | 18.67 abc | 12.42 cd | - | 2.04 |
2 | 10.66 d | 9.06 d | - | 15.83 d | 9.50f | - | 1.54 |
3 | 12.83 c | 10.07 d | - | 16.17 d | 10.08 e | - | 1.74 |
4 | 13.66 c | 10.72 cd | - | 17.00 cd | 10.72 def | - | 1.88 |
5 | 17.50b | 12.46 c | - | 18.33 BC | 14.47 bc | 3.7 | 2.40 |
6 (DC2) | 17.66b | 12.60 bc | - | 19.17ab | 13.93 bc | 2.33 | |
7 | 17.66b | 12.25 c | - | 19.67 ab | 12.26 cde | - | 2.30 |
8 | 19.50a | 14.48 ab | 14.92 | 19.17ab | 15.48 ab | 10.0 | 2.88 |
9 | 19.66a | 14.68a | 16.50 | 20.33a | 17.69a | 21.3 | 3.11 |
10 | 20.00 a | 14.47 ab | 14.84 | 19.17ab | 15.14b | 7.9 | 2.84 |
LSD 0.05 | 0.40 | 0.92 | - | 1.85 | 2.26 | - | - |
Maybe you are interested!
-
 Experiment 1: Study on the Effect of Potassium and Sulfur Fertilizer Dosage on Coffee and Tea Plants in the Business Stage on Red-Brown Basalt Soil in Lam Dong Province
 -
 Research Results on Potassium for Coffee Plants
 -
 Effect of Nitrogen Dosage and Planting Density on Corn Yield Component
 -
 Effect of Initial Glyphosate Concentration on Processability of Electrochemical Fenton Process
 -
 Cultivation and Production Process of Special Rare Weasel Coffee
Note: In the same column, mean values followed by the same letter are not significantly different at α ≤ 0.05. NSLT: Theoretical yield; NSTT: Actual yield.
From the results in Table 3.4, we see:
2018 (crop 1): Theoretical yield among experimental formulas fluctuated quite significantly, from 10.66 to 20.00 tons of fresh ripe fruit/ha/year. Formula 10 had the highest theoretical yield (20.00 tons of fresh ripe fruit/ha/year) but was not significantly different from formulas 8 and 9. Formula 2 had the lowest theoretical yield (10.66 tons of fresh ripe fruit/ha/year) and was significantly different from all formulas in the experiment.
Similar to theoretical yield, formula 2 has the lowest theoretical yield and the lowest actual yield (9.06 tons of fresh ripe fruit/ha/year) but the difference is not significant compared to formulas 1, 3 and 4. Formula 9 has the lowest theoretical yield.
The theoretical yield was also the highest (14.68 tons of fresh ripe fruit/ha/year), but the difference was not significant between formulas 8 and 10. Formulas 8 to 10 had higher actual yield than formula 6 (DC2) from 14.84% to 16.5%.
25
20
15
10
5
NSLT NSTT
0
240 270 300 330
25
20
15
10
5
NSLT NSTT
0
240 270 300 330
25
20
15
10
5
NSLT NSTT
0
240 270 300 330
25
20
15
10
5 NSLT
NSTT
0
20 40 60 80
25
2 0
15
10
5
NSLT NSTT
0
20
40
60 80
25
20
15
10
NSLT
5
NSTT
0
20
40
60 80
Considering the effect of potassium or sulfur on the actual yield of Arabica coffee trees in the business stage, the data in Table 3.4 (2018) shows that: Applying K 2 O at 300 kg/ha/year gives an actual yield ranging from 12.25 to 12.60 tons of fresh ripe fruit/ha/year, lower than at 330 kg/ha/year (14.47 to 14.68 tons of fresh ripe fruit/ha/year) but higher than at 270 kg/ha/year (9.06 to 10.72 tons of fresh ripe fruit/ha/year). At different sulfur application levels of 40 or 60 or 80 kg/ha/year on the same amount of K 2 O of 270 or 300 or 330 kg/ha/year, the actual yield of Arabica coffee trees in the business stage is not statistically different.
Figure 3.1. Linear regression equation and coefficient of determination between coffee yield and potassium and sulfur fertilizer dosage (2018 )
The results in Figure 3.1 show that: On the same sulfur fertilization background, there is a very strong positive correlation between potassium dosage and Arabica coffee yield ( R 2 = 0.91 0.98 for theoretical yield and R 2 = 0.98 0.99 for actual yield). On the same potassium fertilization background, there is a loose to very strong positive correlation between sulfur fertilization amounts and Arabica coffee yield ( R 2 = 0.75 0.98 for theoretical yield and R 2 = 0 0.75 for actual yield). Of the two experimental factors, potassium dosage has a greater effect on Arabica coffee yield in the commercial stage than sulfur dosage.
In 2019 (crop 2):
Theoretical yields among experimental formulas ranged from 15.83 to 20.33 tons of fresh ripe fruit/ha/year. Formula 2 maintained a lower theoretical yield than the other formulas in the experiment (15.83 tons of fresh ripe fruit/ha/year) but the difference was not statistically significant compared to formulas 3 and 4. Formula 9 had a theoretical yield of
highest theoretical yield (20.33 tons of fresh ripe fruit/ha/year) but the difference was not statistically significant with formulas 1, 6, 8 and 10 .
The actual yield between the formulas fluctuated quite a lot from 9.5 to 17.69 tons of fresh ripe fruit/ha/year. Formula 2 had the lowest theoretical yield but the actual yield was the lowest (9.5 tons of fresh ripe fruit/ha/year) but the difference was not significant compared to formula 4. Formula 9 had the highest actual yield (17.69 tons of fresh ripe fruit/ha/year) and was not significantly different compared to formula 8. Formula 5 and formulas 8 to 10 all had actual yield higher than formula 6 (DC2) from 3.7% to 21.3%.
Considering the effect of potassium or sulfur on the actual yield of Arabica coffee trees in the commercial stage, the data in Table 3.4 (2019) shows that: Potassium fertilization at the level of 300 kg K 2 O / ha / year gives actual yield ranging from 12.26 to 14.47 tons of fresh ripe fruit / ha / year, lower than at the level of 330 kg K 2 O / ha / year (15.14 to 17.69 tons of fresh ripe fruit / ha / year) but higher than the fertilization level of 270 kg K 2 O / ha / year (9.5 to 10.72 tons of fresh ripe fruit / ha / year).
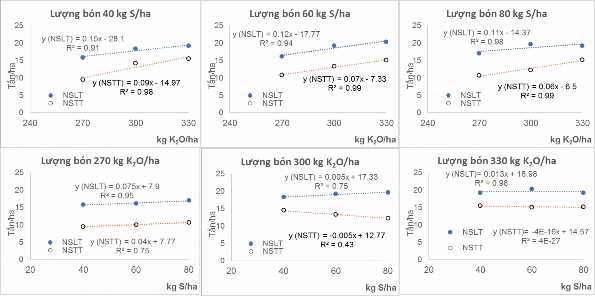
Figure 3.2. Linear regression equation and coefficient of determination between coffee yield and potassium and sulfur fertilizer dosage (2019)
The results in Figure 3.2 also show that: On the same sulfur fertilization background, there is a very strong positive correlation between potassium dosage and Arabica coffee yield ( R 2 = 0.91 0.98 for theoretical yield and R 2 = 0.98 0.99 for actual yield). On the same potassium fertilization background, there is a loose to very strong positive correlation between sulfur fertilization amounts and Arabica coffee yield ( R 2 = 0.75 0.98 for theoretical yield and R 2 = 0 0.75 for actual yield). Of the two experimental factors, potassium dosage has a greater effect on Arabica coffee yield in the commercial stage than sulfur dosage.
In the plant body, potassium plays a role in promoting photosynthesis, creating sugar and transporting sugar to storage organs, so seed trees, fruit trees and root crops need to be supplied with a lot of potassium [65]. For coffee trees, if potassium is not applied, coffee yield will be very low due to severe fruit drop. A moderate amount of potassium fertilizer from 150 to 300 kg K 2 O/ha/year will stabilize coffee yield at about 3 to 4 tons of beans/ha/year. However, applying too much potassium (over 400 kg K 2 O/ha/year) does not affect yield but reduces the quality of the cup of coffee due to a heavier and more burnt flavor [81].
Sulfur does not participate in the structure of chlorophyll but plays an active role in the synthesis of chlorophyll in coffee plants, thereby positively affecting the photosynthesis process and productivity. Sulfur deficiency causes symptoms of young leaf blight in coffee plants, poor growth and development, and reduced productivity. A recommended dose of sulfur for coffee in the basic construction stage is 30 kg S/ha/year and in the business stage is 60 to 90 kg S/ha/year, which will overcome the symptoms of young leaf blight caused by sulfur deficiency and help the plants achieve high productivity [31].
The recommended amount of fertilizer for commercial Arabica coffee in phase 1 in Lam Dong is 270 to 300 kg K 2 O/ha/year and 60 kg S/ha/year [46]. The results of a study on some technical measures for fertilizing Robusta coffee in the commercial phase on basalt soil in Dak Lak by author Nguyen Van Minh (2014) showed that: Applying inorganic fertilizer at a dose of 364 kg N + 95 kg P 2 O 5 + 336 kg K 2 O (ha/year) increased the weight of fresh ripe fruit by 10%; reduced the ratio of fresh ripe fruit/kernel by 7% at a significance level of α ≤ 0.05 compared to the control formula (according to the recommended process); gave the highest profit (83.11 million VND/ha/year). The increase in actual yield of Arabica coffee trees in the experimental formulas in 2019 was higher than in 2018 because Arabica coffee trees bore few fruits in 2018 (having given high yields in 2017), so the amount of nutrients absorbed by the trees (partly to nourish the fruit on the tree, the rest focused on the development of reserve branches bearing fruit in the next crop). This is the phenomenon of Arabica coffee trees bearing fruit every other year because the strong fruit development process limits the growth process of branches and leaves and vice versa. This is because Arabica coffee flowers grow again on nodes that have borne very few fruits, so the yield of the next crop depends on the amount of branches that have developed from the previous year [27]. In this study, the fertilization dose of 300 kg K 2 O/ha/year combined with 60 kg S/ha/year gave a net yield of 12.60 tons of fresh ripe fruit/ha/year in 2018 and 13.27 tons of fresh ripe fruit/ha/year in 2019; the fertilization dose of 330 kg K 2 O/ha/year combined with 60 kg S/ha/year gave a higher net yield of 14.68 tons of fresh ripe fruit/ha/year in 2018 and 17.69 tons of fresh ripe fruit/year in 2019.
Thus, at different doses, potassium fertilization combined with sulfur affects the productivity of commercial Arabica coffee trees grown on basalt soil in Lam Dong. Potassium fertilization combined with sulfur at appropriate doses helps coffee trees
Tea in the commercial stage is supplemented with adequate potassium and sulfur, helping coffee plants grow and develop well, giving high productivity.
3.1.4. Effects of potassium and sulfur fertilizer dosage on bean shape and size, drinking water quality of Arabica coffee plants
For Catimor Arabica coffee trees, bean quality and drinking water quality depend on many factors such as: Climate, soil, altitude above sea level, and cultivation regime. Coffee bean quality has important indicators such as the percentage of round beans, bean size on sieve sizes, and the weight of 100 beans. Due to the influence of the year and the environment, bean quality indicators need to be observed for at least two different years, at the main harvest time. Monitoring the effects of potassium and sulfur fertilizer doses on bean shape and size of Arabica coffee trees during the business period in 2018 and 2019, we obtained the results in Table 3.5 and Table 3.6.
Table 3.5. Effects of potassium and sulfur fertilizer doses on round kernel ratio, kernel ratio on sieve 18 and 16 of Arabica coffee plants
Recipe
Case 1 (2018) | Case 2 (2019) | |||||
Rounding ratio (%) | Kernel to sieve ratio (%) | Rounding ratio (%) | Kernel to sieve ratio (%) | |||
18 | 16 | 18 | 16 | |||
1 (DC1) | 12.63a | 10.63 abc | 78.30 cd | 11.71 ab | 11.47 abc | 81.13 bcd |
2 | 13.37a | 9.50 c | 76.50 d | 11.82 ab | 10.60 c | 78.47 d |
3 | 13.33a | 10.37 abc | 78.27 cd | 12.47a | 11.23 bc | 79.77 cd |
4 | 13.27a | 9.97 bc | 78.17 cd | 11.87 ab | 10.60 c | 78.97 d |
5 | 12.30 ab | 11.20 ab | 79.70 cd | 10.97 abc | 11.7 abc | 81.37 bcd |
6 (DC2) | 12.30 ab | 11.23 ab | 81.27 abc | 11.17 abc | 11.77 abc | 82.50 abc |
7 | 11.43 ab | 11.73a | 80.43 bcd | 10.47 abc | 12.60 ab | 81.27 bcd |
8 | 11.37 ab | 11.43 ab | 84.83a | 9.93 bc | 12.03 ab | 85.37a |
9 | 11.33 ab | 11.40 ab | 84.07 ab | 10.60 abc | 12.80a | 83.97 ab |
10 | 10.23b | 11.97a | 84.40 ab | 9.33 c | 12.27 ab | 84.93a |
LSD 0.05 | 1.14 | 0.77 | 1.94 | 2.18 | 1.40 | 3.36 |
Note: In the same column, mean values followed by the same letter are not significantly different at α ≤ 0.05.
Table 3.6. Effects of potassium and sulfur dosage on the ratio of fresh ripe fruit/kernel, volume of 100 fruits and weight of 100 kernels of Arabica coffee plants
Recipe
Case 1 (2018) | Case 2 (2019) | |||||
Ratio of fresh ripe fruit/kernel | Volume of 100 fresh ripe fruits (cm 3 ) | Weight of 100 kernels (g) | Ratio of fresh ripe fruit/kernel | Volume of 100 fresh ripe fruits (cm 3 ) | Weight of 100 kernels (g) | |
1 (DC1) | 5.93 abc | 98.00 b | 14.97 c | 5.47 ab | 104.33 abc | 15.93 cde |
2 | 6.33a | 86.67 c | 13.60 d | 5.67a | 98.67 bc | 14.90 e |
3 | 5.97 abc | 80.33 c | 13.80 d | 5.67a | 95.33 c | 14.97 de |
4 | 6.20 ab | 86.33 c | 14.77 c | 5.20 abc | 104.33 abc | 15.5 de |
5 | 5.80 abc | 101.67 ab | 15.03 c | 5.53 ab | 104.67 abc | 16.1 bcd |
6 (DC2) | 5.67 bc | 100.00 ab | 15.33 BC | 5.40 abc | 103.67 abc | 15.4 de |
7 | 5.73 abc | 99.67 b | 15.30 bc | 5.50 ab | 102.00 abc | 15.7 cde |
8 | 5.47 c | 104.67 ab | 16.03 ab | 5.07 bc | 105.33 ab | 16.7 abc |
9 | 5.57 c | 107.00 a | 16.07 ab | 5.07 bc | 108.67a | 16.8 ab |
10 | 5.60 bc | 99.67 b | 16.47a | 4.93 c | 107.33 ab | 17.1a |
LSD 0.05 | 0.28 | 7.10 | 0.39 | 0.49 | 9.80 | 0.90 |
Note: In the same column, mean values followed by the same letter are not significantly different at α ≤ 0.05.
2018 (crop 1): The rounding rate of the experimental formulas ranged from 10.23% (formula 10) to 13.37% (formula 2). Formula 10 had the lowest rounding rate and was statistically significantly different from formula 6.
The kernel ratio on sieve 18 among the formulas was quite low and ranged from 9.5% (formula 2) to 11.97% (formula 10); formula 2 had the lowest kernel ratio on sieve 18 and was significantly different from the other formulas in the experiment. The kernel ratio on sieve 16 of the formulas ranged from 76.5% (formula 2) to 84.83% (formula 8).
The ratio of fresh ripe fruit to kernel between the formulas ranged from 5.47 to 6.33; formula 2 had the highest ratio of fresh ripe fruit to kernel and was significantly different from formula 6; the other formulas in the experiment had ratios of fresh ripe fruit to kernel that were not significantly different from formula 6. The ratio of fresh ripe fruit to kernel of Arabica coffee varieties usually ranges from 5 to 8, this ratio often depends on the genetic nature of the variety, the care regime and the ecological conditions of each region, the lower the ratio of fresh ripe fruit to kernel, the higher the yield, while reducing the harvesting and processing labor [22].
The weight of 100 coffee beans in the formulas ranged from 13.6 to 16.47 g. Formula 10 had a higher weight of 100 coffee beans and a statistically significant difference compared to formula 6. The weight of 100 coffee beans in formulas 2 and 3 was lower and a statistically significant difference compared to formula 6. At the same size, there are heavier and lighter beans, the higher the weight of the beans, the better the quality of the coffee. The same variety of Arabica coffee but different fertilization regimes also have different effects on the weight of beans. For many Arabica coffee growing countries in the world, the weight of 100 beans usually ranges from 18 to 22 g. Under growing conditions in Vietnam, the weight of 100 Arabica coffee beans usually ranges from 14 to 18 [44].
2019 (crop 2): The rounding rate ranged from 9.33% (formula 10) to 12.47% (formula 3). Formula 10 had the lowest rounding rate and was statistically different from formula 1 (DC1) and formulas 2 to 4. At different sulfur fertilization levels, 40 or 60 or 80 kg/ha/year on the same amount of K 2 O fertilizer of 270 or 300 or 330 kg/ha/year, the rounding rate of Arabica coffee trees was not significantly different. The rounding rate on sieve 18 ranged from 10.60% (formula 2) to 12.80% (formula 9); Formulas 2 and 4 had the lowest kernel percentage on sieve 18 (10.60%) but were not significantly different from formulas 1, 3, 5 and 6. The kernel percentage on sieve 16 ranged from 78.47% (formula 2) to 85.37% (formula 8). Formulas 8 and 10 had higher kernel percentages on sieve 16 and were significantly different from formula 6 (DC2).
The ratio of fresh ripe fruit to kernel ranged from 4.93 to 5.67; treatments 2 and 3 had the highest ratio of fresh ripe fruit to kernel (5.67) and were significantly different from treatments 8 to 10. Treatment 6 had a ratio of fresh ripe fruit to kernel of 5.4 but was not significantly different from the other treatments in the experiment.
The weight of 100 coffee beans ranged from 14.9 to 17.1 g. Treatment 10 had the highest weight of 100 coffee beans but was not significantly different from treatments 8 and 9. Treatment 6 had a weight of 15.4 g and was significantly different from treatments 8 to 10.
Coffee bean size is assessed by grading on sieve sizes, the percentage of round beans is related to the presence of a cavity (genetic defect,
(poorly developed endosperm), Arabica coffee species usually have less than 10% voids, the bean mass and bean size of an Arabica coffee variety at a growing location vary little over harvests, but under different care conditions, the bean mass and bean size can change, with suitable care conditions, the bean size and bean mass are further improved, the beans are heavier and firmer [45].
Thus, at different sulfur fertilization levels of 40 or 60 or 80 kg/ha/year on the same amount of K 2 O fertilizer of 270 or 300 or 330 kg/ha/year, the round kernel ratio, the kernel ratio on sieve 16 and 18, the fresh kernel ratio and the weight of 100 kernels of Arabica coffee trees in the business stage were not significantly different. This result showed that sulfur fertilization at different doses on the same amount of potassium fertilizer did not significantly affect the quality of Arabica coffee beans.
To evaluate the quality of drinking water or also known as cup coffee, it is often necessary to be performed by experienced tasters. The evaluation criteria include: Aroma, body, acidity, uniformity, and cleanliness according to a certain standard. The taste of coffee water is the main and most important standard of coffee drinking water quality, the quality of drinking water depends a lot on the harvesting, processing and preservation stages. Analysis of caffeine content and evaluation of drinking water quality of commercial Arabica coffee grown on red-brown basalt soil in Lam Dong province between the formulas are shown in Table 3.7.