The difference value test results show that the variables have achieved discriminant value. The correlation index and standard deviation are both < 1 and P = 0.00. This means that the concepts being explored have discriminant value.
The Cronbach's reliability coefficient and the composite reliability of alpha are both > 0.6. The variance extracted for the concepts satisfies the condition > 0.5. Therefore, all scales are reliable.
Table 4-17 Combined reliability coefficients of factors in the critical model
Ladder
measure
Number of officials close | Cronbach's reliability Alpha | Overall reliability fit | Variance extract | |
PEU | 5 | 0.886 | 0.888 | 0.615 |
OS | 4 | 0.818 | 0.820 | 0.533 |
OT | 4 | 0.831 | 0.832 | 0.554 |
OSTR | 3 | 0.875 | 0.869 | 0.688 |
QUAL | 3 | 0.766 | 0.772 | 0.531 |
CULT | 3 | 0.822 | 0.824 | 0.610 |
SMA | 10 | 0.930 | 0.931 | 0.576 |
OP | 5 | 0.886 | 0.887 | 0.611 |
Maybe you are interested!
-
 Factors affecting the application of management accounting in small and medium enterprises in Vietnam - 4
 -
 Research Results of Factors Affecting the Implementation of Management Accounting to Evaluate Operational Efficiency in Travel Enterprises
 -
 Research on factors affecting cost management accounting at stone mining enterprises in Binh Duong - 1
 -
 Factors affecting the application of management accounting in small and medium enterprises in Vietnam - 13
 -
 According to Experts, Which Factors Below Affect the Application of Cost Management Accounting at Manufacturing Enterprises in Binh Duong Province?
Source: SPSS
The critical model after CFA analysis concluded that the scales achieved convergent validity, one-dimensionality, reliability, discriminant validity and response to survey data on the subject.
4.4 Testing the SEM model and hypotheses
4.4.1 Testing using SEM model
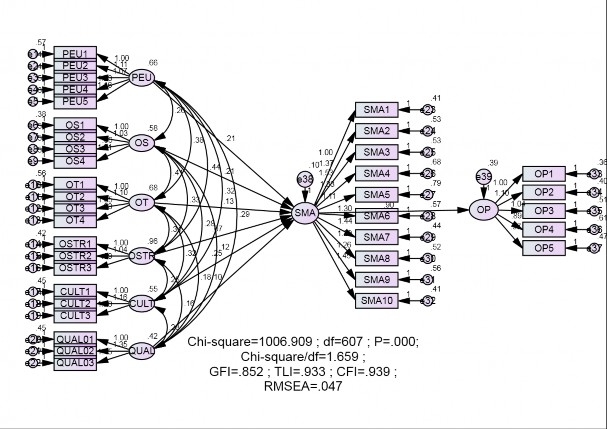
SEM model for coefficients df = 607 degrees of freedom; chi – Square = 1006.909; Chi- Square/df = 1.659 < 2; TLI = 0.933 > 0.9; CFI = 0.939 > 0.9; RMSEA = 0.047 < 0.08
and P = 0.00. The indicators of the research data all satisfy the conditions for SEM analysis, so the model is suitable for the data of the topic. The estimated ᵦ of the model all have a (+) sign, showing the positive influence between the factors on the implementation of KTQTCL and between the implementation of KTQTCL and the results. The model results of the topic are presented in Figure 4.2.
Source: AMOS 22
Figure 4-2 SEM results of theoretical model
The SEM model results are presented in Table 4-18.
Table 4-18 Results of estimating the relationship between factors in the theoretical model (unstandardized)
Relationship
Estimate | SE | CR | P | |||
SMA | <--- | PEU | 0.206 | 0.052 | 3,979 | *** |
SMA | <--- | OS | 0.212 | 0.054 | 3,931 | *** |
SMA | <--- | OT | 0.130 | 0.051 | 2,554 | 0.011 |
SMA | <--- | CULT | 0.254 | 0.052 | 4,907 | *** |
SMA | <--- | OSTR | 0.072 | 0.032 | 2,234 | 0.025 |
SMA | <--- | QUAL | 0.097 | 0.053 | 1,850 | 0.064 |
OP | <--- | SMA | 0.896 | 0.088 | 10,135 | *** |
Source: AMOS software
Analyzing the estimated relationship in the topic, concluding that the factors in the model are all statistically significant. proving that the concepts of the topic such as PEU, OS, OT, CULT,
QUAL, OSTR, both have positive influence on SMA, and SMA implementation affects the efficiency of Vietnamese SMEs. Therefore, this result concludes that the concepts in the model have theoretical value.
4.4.2 Testing research model estimates using Bootstrap
Bootstrap is used to verify the parameters in the theoretical model after testing the SEM model. Bootstrap method is used to verify the selection of repeated samples with changes from the original sample. Use 500 samples to verify Bootstrap for the topic.
Table 4-19 Bootstrap estimation results with N = 500
Relationship
R | SE | SE-SE | Mean | Bias | SE-Bias | CR | |||
SMA | <--- | PEU | 0.255 | 0.073 | 0.002 | 0.262 | 0.003 | 0.003 | 1.00 |
SMA | <--- | OS | 0.245 | 0.069 | 0.002 | 0.249 | 0.004 | 0.003 | 1.33 |
SMA | <--- | OT | 0.163 | 0.077 | 0.002 | 0.155 | -0.007 | 0.004 | -1.75 |
SMA | <--- | CULT | 0.287 | 0.073 | 0.002 | 0.296 | 0.003 | 0.003 | 1.00 |
SMA | <--- | OSTR | 0.108 | 0.042 | 0.001 | 0.104 | -0.003 | 0.002 | -1.50 |
SMA | <--- | QUAL | 0.096 | 0.064 | 0.002 | 0.092 | -0.004 | 0.003 | -1.33 |
OP | <--- | SMA | 0.686 | 0.044 | 0.001 | 0.685 | -0.001 | 0.002 | -0.50 |
Source: AMOS 22 software processing results
Validation through Bootstrap shows that bias (Bisa) and standard deviation (SE- Bias) are present, but not large. The absolute value CR <2. It can be concluded that the standard deviation is very small and not statistically significant at 95% confidence level. Therefore, with the help of tested data, Bootstrap can draw a reliable model conclusion.
4.4.3 Hypothesis testing results
According to the results of model testing and bootstrap testing in SEM analysis, the hypotheses in the topic are statistically significant. Among them, when the significance level of a hypothesis is 10%, the highest p value is 0.064, and the other hypotheses reach the significance level of 5%. Therefore, based on this result, it can be concluded that 7 hypotheses are accepted. The β index of the relationship between factors has a positive sign, showing the positive influence of the factors.
Table 4-20 Results of testing research hypotheses
Relationship
Estimate | Estimate (standard) chemical) | P | Conclude | |||
SMA | <--- | PEU | 0.206 | 0.255 | *** | Accept H1 |
SMA | <--- | OSTR | 0.072 | 0.108 | 0.025 | Accept H2 |
SMA | <--- | OT | 0.130 | 0.163 | .011 | Accept H3 |
SMA | <--- | OS | 0.212 | 0.245 | *** | Accept H4 |
SMA | <--- | CULT | 0.254 | 0.287 | *** | Accept H5 |
SMA | <--- | QUAL | 0.097 | 0.096 | 0.064 | Accept H6 |
OP | <--- | SMA | 0.896 | 0.686 | *** | Accept H7 |
Source: Processing results from AMOS 22 software.
Testing H1 : PEU positively affects SMA performance
The standardized β index is positive and non-zero in the SEM model analysis. This proves the positive influence of PEU and implementation of KTQTCL. With β = 0.206 and β (standardized) = 0.255. P = *** < 0.01. That means hypothesis H1 is accepted by the experimental sample. It proves that PEU has a positive impact on implementation of KTQTCL in Vietnamese enterprises.
Testing H2 : Management hierarchy structure has a positive and non-zero influence on SMA implementation. The standardized β index is positive and non-zero in the SEM model analysis.
This demonstrates the positive relationship between OSTR and SMA performance. With β
=0.072 and β (standardized) = 0.108 P level =0.025 < 0.05. This proves that H2 is accepted by the experimental sample. Proving that OSTR has a positive impact on the implementation of KTQTCL in Vietnamese DNSX.
Testing H3: Information technology application has positive impact on KTQTCL implementation
The standardized β is positive and non-zero in the SEM test. It shows a positive correlation between the OT factor and SMA. With β =0.130 and β (standardized) = 0.163. The P level =0.011< 0.01. This means that H3 is accepted by the test sample. This result proves that OT has a positive impact on the implementation of KTQTCL in Vietnamese manufacturing enterprises.
Testing H4: DNSX implementing offensive business strategy has positive impact on SMA implementation
The results of the standardized β index are positive and non-zero in the SEM model analysis. This proves the positive correlation between the attack strategy and KTQTCL. β =0.212 and β (standardized) = 0.245; significance P =*** < 0.01. That means H4 is accepted by the experimental sample. It proves that OS has a positive impact on the implementation of KTQTCL in Vietnamese manufacturing enterprises.
Testing H5: CULT has a positive influence on SMA implementation
The standardized β index is positive and non-zero in the SEM model analysis. This proves the positive relationship between CULT and KTQTCL implementation. β =0.254 and β (standardized) = 0.287 and P =*** < 0.01. That is, the hypothesis H5 is accepted by the test sample. This result proves that CULT has a positive impact on KTQTCL implementation in Vietnamese SMEs.
Testing H6: QUAL has a positive influence on SMA implementation
The standardized β index is positive and non-zero in the SEM model analysis. This proves the positive relationship between MA staff qualifications and SMA implementation. β =0.097 and β (standardized) = 0.096. P =0.064 < 0.1. That is, H6 is accepted by the experimental sample. This result proves that QUAL has a positive effect on SMA implementation in Vietnamese manufacturing enterprises.
Testing H7: Implementing SMA has a positive and non-zero effect on OP of Vietnamese DNSX. The standardized β index is positive and non-zero in the SEM model analysis.
This proves the positive correlation between SMA implementation and OP. β =0.896 and β (standardized) = 0.686. P =*** < 0.01. That is, H7 is accepted by the experimental sample. This result proves that KTQTCL implementation has a positive impact on the efficiency of Vietnamese manufacturing enterprises.
4.5 Discussion of research results
4.5.1 Discussion of main findings from the study
The results collected from the enterprises show that the enterprises have applied quality management accounting in the production and business process with the average value of the SMA implementation scale being 3.481. In which, the ABC activity-based costing technique is the most commonly applied with an average value of 3.61. The buyer-asset evaluation technique is the least used with an average value of 3.34. At the same time, the results of the topic also verify that the implementation of SMA has a positive impact on the performance of the enterprises. Therefore, this result shows that it is necessary to strengthen the implementation of quality management accounting in the enterprises to improve the performance of the enterprises.
The coefficient R 2 = 47% of OP in the SEM model (Appendix 11) shows the level of resolution.
The preference of the factor implementing KTQTCL directly affects the OP factor by 47% at 1%. With the above results, when DNSX wants to increase efficiency, it must strengthen the implementation of KTQTCL, which means that DNSX needs to use a combination of many types of KTQTCL techniques, thereby helping DNSX have more data to make strategic decisions. This result is consistent with the research results of Cadez and Guilding (2008) and the theoretical expectations of the thesis.
The indirect relationship affecting OP through the intermediate variable implementing SMA has a coefficient R 2 = 77.6% in the SEM model (Appendix 11). That is, the factors affecting the implementation of KTQTCL are explained by 77.6%>50% by the factors in the topic. This level of explanation is relatively high, proving that the factors selected for research in the topic are suitable and specific to DNSX affecting the variable OP through KTQTCL.
In which, PEU positively affects SMA implementation with a significance of 1%; OT positively affects SMA with a significance of 5%; and OS also positively affects SMA with a significance of 1%. The conclusion of the topic is consistent with the theoretical assumptions and results in the topic of author Ojra (2014).
The positive correlation of CULT and QUAL factors to SMA has a significance level of 1% for CULT factor and 10% for QUAL factor. The results of the topic are assessed as consistent with the expectations set out in theory and are supported by a number of topics.
before support. As Ahmad (2012) study supports the factor of international accounting level affecting the implementation of international accounting techniques. Or Erserim (2012) study shows that the DNSX builds a supportive culture with unanimous support to implement the common goals of the organization, the more the use of international accounting tools increases.
According to the direct influence relationship of the six factors on SMA. The influence of the CULT variable is the strongest with a standardized β of 0.287, followed by the PEU factor with a standardized β of 0.255; The third strongest influence is the OS factor with a β of 0.179; The OT factor has the fourth strongest influence with a standardized β of 0.163; The OSTR factor has the fourth strongest influence with a standardized β of 0.108; and QUAL has the smallest impact in the model with a standardized β of 0.096.
4.5.2 Factors affecting the implementation of KTQTCL
4.5.2.1 CULT factor affecting SMA
For the DNSX culture factor in this study, it is understood that employees have support from leaders, support from departments in DNSX and members strive for the common goal of DNSX. Quantitative PPNC shows that the cultural factor has a positive impact on KTQTQL in DNSX, that is, the DNSX culture supports and aims towards the goal of DNSX, which will create favorable conditions for implementing KTQTQL in DNSX.
In the current period, DNSX culture is considered by many scholars to be the decisive factor for success and also a lifebuoy for DNSX to overcome the shock of economic crisis. For DNSX, competitors can copy everything such as products, technological processes... But culture is the only thing that competitors cannot copy and this is the factor that creates a superior difference compared to competitors. In the world in the field of manufacturing, DNSX culture has brought success such as at DNSX Toyota, DNSX Intel. In Vietnam, according to the thesis survey, cultural factors are also highly appreciated by DNSX in influencing the implementation of KTQTCL. Evidence for the success and sustainable development of leading DNSX in Vietnam thanks to culture
Strong DNSX, such as in the Textile and Garment sector is Phong Phu Corporation; in the food industry is Vietnam Dairy Products Joint Stock Company, Acecook Vietnam Joint Stock Company,... Culture is the thread connecting members of DNSX together towards the common goal of DNSX, so when DNSX builds a strong culture, it will support and create favorable conditions for the implementation of KTQTCL.
The results in the thesis are also consistent with the expectation built on the random, superior framework on the important role of DNSX culture in the organization of implementing KTQTCL at DNSX (With the β index of 0.287). This result means that when DNSX has consensus support among employees, departments, and leaders, it is easy to create business strategies, business goals, as well as being able to apply management tools to control the implementation of these strategies, and in which KTQTCL is also a management tool. This result is also consistent with the topics of Erserim (2012), Tran Ngoc Hung (2016).
4.5.2.2 PEU factor affects SMA
After synthesizing the previous topics and the qualitative PPNC, the PEU factor is the level of awareness of the competition for market share; The current business environment threatens the existence of the DNSX; the high level of competition in terms of selling prices; The quality and innovation of competitors; The ability to predict the needs of buyers; The product needs of potential buyers. According to the random framework, Institutions, superiors. KTQT needs to change to keep up with the changes of the market. Therefore, the PEU factor is proposed as a random factor that has a positive impact on the implementation of SMA of Vietnamese DNSX. Quantitative PPNC shows that the PEU factor plays a second important role in the motivation model for KTQTCL (In the structural model, the standardized β index is 0.255).
Since Vietnam joined the WTO in 2007, along with a series of trade agreements, this is an opportunity for Vietnamese enterprises to expand their potential markets, but also brings competitive pressure on product quality and price.