The impact between the solvency ratio and the bad debt ratio as analyzed in the chart above is an opposite impact. From 2007 to 2014, the bad debt ratio tended to increase while the solvency ratio tended to decrease. Commercial banks with a reasonable equity structure will enhance the bank's position as well as meet liquidity requirements when RRTD occurs. This is most clearly seen in large commercial banks such as BIDV, Vietcombank, Vietinbank, ...
3.5.5. Non-interest income
Non-interest income and bad debt ratio
25.00%
19.66%
20.00%
19.14%
17.26%
16.50%
14.87%
15.00%
13.94%
11.64%
10.96%
10.00%
5.00%
3.40%
3.60%
3.30%
0.00%
Non-interest income
Bad debt ratio
Figure 3.14. Non-interest income and bad debt ratio
1.50% 2.20%
1.80% | 2.10% | 2.80% | ||||
2007 2008 | 2009 | 2010 | 2011 | 2012 | 2013 | 2014 |
Maybe you are interested!
-
 General Comments on the Current Status of Credit Risk Management and Factors Affecting Credit Risk Management at Vpbank
 -
 Model of the Impact of Credit Risk on the Business Performance of Commercial Banks
 -
 The influence of factors belonging to bank characteristics on credit risk at Vietnamese commercial banks - 13
 -
 Factors Affecting Credit Risk Management of Commercial Banks
 -
 Current Status of Factors Affecting Credit Risk at Vietnamese Commercial Banks in the Period 2008 - 2016:
(Source: WB, Financial Statements of Vietnamese Commercial Banks)
The chart shows the inverse relationship between non-interest income and bad debt ratio. In addition to pure interest income, commercial banks also have non-interest income such as: income from service activities, brokerage commissions, securities investment, capital contribution, share purchase, etc. All of these activities will create a source of non-interest income for commercial banks, contributing to strengthening their competitiveness as well as their financial potential. These non-interest incomes help businesses diversify their sources of income and meet liquidity requirements and the ability to bear risks when bad debt occurs. In 2014, Viet Capital Commercial Joint Stock Bank had the highest non-interest income ratio, accounting for 40.55% of the total income of the Bank; Viet Asia Commercial Joint Stock Bank had the lowest non-interest income ratio, only reaching 1.72% of the total income of the Bank.
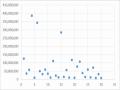
3.5.6. Scale
The chart shows that bank size (considered by total assets) and bad debt ratio have opposite effects. Both variables increased over the years from 2007 to 2014. Vietnamese commercial banks, especially large-scale banks, often provide capital to large enterprises with many preferential policies as well as flexibility in the process of evaluating customers and mortgage assets. Therefore, once these enterprises encounter financial difficulties, it will greatly affect the operations of the bank, thereby increasing RRTD and contributing to increasing bad debt for the commercial banking system. In 2014 alone, Vietinbank had the highest total assets in the whole system, reaching 661,131 billion VND; Saigon Commercial Joint Stock Bank for Industry and Trade had the lowest total assets in the whole system, reaching only 15,823 billion VND.
Figure 3.15. Average total assets and bad debt ratio
Average total assets and bad debt ratio
180,000
160,000
140,000
3.60%
3.40%
3.30%
2.80%
120,000
100,000
80,000
60,000
40,000
20,000
0
2.20%
2.10%
1.80%
1.50%
165,139
123,156
128,140
142,442
99,442
69,387
42,973
50,696
4.00%
3.50%
3.00%
2.50%
2.00%
1.50%
1.00%
0.50%
0.00%
2007 2008 2009 2010 2011 2012 2013 2014
Average total assets (billion VND)
Bad debt ratio
(Source: WB, Financial Statements of Vietnamese Commercial Banks)
3.5.7. Profitability
Figure 3.16. Profitability and bad debt ratio
Profitability and bad debt ratio
14.00%
12.91% 12.80%
11.90%
12.34%
12.00%
9.58%
10.00%
7.98%
8.00%
5.90%
5.99%
6.00%
4.00%
3.40%
3.60%
3.30%
2.20%
2.80%
1.80%
2.10%
2.00%
1.50%
0.00%
2007
2008
2009
2010
2011
2012
2013
2014
Profitability
Bad debt ratio
(Source: WB, Financial Statements of Vietnamese Commercial Banks)
Through the analysis of actual data from 2007 to 2014, it can be seen that in the operation of the commercial banking system, the profitability (represented by the ROE indicator) has an inverse impact on the bad debt ratio. In the commercial banking system, the more effectively the banks operate, the more reasonable the capital structure, the better the cost control, the more certain and objective the appraisal of loans, the higher the efficiency of the bank's operations. From there, the bank is fully capable of meeting liquidity requirements in case of any risks as well as controlling the bad debt ratio appropriately according to expectations. In 2014, the ROE of the Military Commercial Joint Stock Bank accounted for the highest proportion, reaching 15.11%, while the National Commercial Joint Stock Bank had the lowest ROE, reaching only 0.25%.
3.6. The impact of macroeconomic factors on credit risk at Vietnamese commercial banks from 2007 to 2014
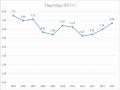
3.6.1. Real GDP growth rate
Figure 3.17. Real GDP growth rate and bad debt ratio in Vietnam
9.00%
8.00%
7.00%
6.00%
5.00%
4.00%
3.00%
2.00%
1.00%
0.00%
Real GDP growth rate and bad debt ratio
8.50%
6.80%
6.20%
5.90%
6.00%
5.30%
5.20%
5.40%
4.62%
3.50%
4.34%
3.30%
3.30%
2.20%
2.47%
1.50%
2007
2008
2009
2010
2011
2012
2013
2014
Real GDP growth rate
Bad debt ratio
(Source: WB, ADB)
The graph shows the inverse relationship between real GDP growth rate and bad debt ratio of Vietnamese commercial banks from 2007 to 2014, when real GDP growth rate increases, bad debt ratio decreases and vice versa. Vietnam's economy experienced a period of high growth in 2007 (real GDP growth rate reached 8.50%), at which time the bad debt ratio of commercial banks was only 1.5%. Starting from 2008 onwards, real GDP growth rate decreased and averaged about 6.00% due to the unstable impact of the economy and the great impact on the business activities of domestic economic sectors, so the bad debt ratio tends to increase over time. In addition, real GDP growth rate affects the bad debt ratio of commercial banks with a certain delay, usually one year.
3.6.2. Inflation rate
Figure 3.18. Inflation rate and bad debt ratio in Vietnam
Inflation rate and bad debt rate
25.00% 23.00%
20.00%
18.70%
15.00%
10.00%
8.30%
9.20%
9.20%
6.90%
4.34%
5.00%
3.50%
3.30%
6.60%
4.62%
4.10%
1.50%
2.20%
2.47%
3.30%
0.00%
2007
2008
2009
2010
2011
2012
2013
2014
Inflation rate
Bad debt ratio
(Source: WB, ADB)
Through the analysis graph, the inflation rate and the bad debt rate of Vietnamese commercial banks have the same impact. This impact is reflected in the period when the economy fell into recession due to the impact of the global financial crisis in 2008 and the European debt crisis in 2011. In 2008, the global crisis affected the world price situation and thereby strongly affected Vietnam's inflation. In 2008, inflation reached 23%. This has significantly affected the operations of individuals and businesses in the economy, causing a series of these subjects to fall into a state of illiquidity due to the pressure of loan maturity at banks and causing bad debt in banks to increase in 2008. This process also occurred similarly under the impact of the European debt crisis in 2011.
3.6.3. Real interest rate
The chart shows the inverse relationship between real interest rates and bad debt ratios of commercial banks. In 2008, to curb excessively high inflation, the Government implemented a tight monetary policy, which caused nominal interest rates to increase, but this increase was not equal to the increase in inflation, which made real interest rates negative. The problem of increased nominal interest rates under the impact of tight monetary policy has significantly affected individuals and businesses in the economy because they have to bear excessively high interest costs, which can easily lead to a debt crisis and this has increased bad debt for commercial banks.
Figure 3.19. Real interest rates and bad debt ratio in Vietnam
Real interest rate and bad debt ratio
6.00%
4.00%
2.00%
0.00%
-2.00%
-4.00%
-6.00%
5.40%
3.50%
1.40%
1.50%
3.60%
2.20%
2.47%
0.90%
3.30%
4.34%
2.30%
4.62%
4.80%
3.30%
2007
2008
2009
2010
2011
-
2012
2013
2014
3.60%
-5.60%
Real interest rate
Bad debt ratio
(Source: http://data.worldbank.org/indicator )
3.6.4. Unemployment rate
The chart shows that the unemployment rate and the bad debt ratio of commercial banks have a positive impact. However, this impact is not clear. From 2010 to 2012, the unemployment rate decreased while the economic context was extremely difficult due to the impact of the global financial crisis, economic recession and the European sovereign debt crisis. The reason can be explained by the fact that during this period there was a labor shift, workers accepted to change from full-time jobs to part-time, precarious jobs.
Figure 3.20. Unemployment rate and bad debt ratio
5.00%
4.50%
4.00%
3.50%
3.00%
2.50%
2.00%
1.50%
1.00%
0.50%
0.00%
Unemployment rate and bad debt rate
4.62%
4.34%
3.50%
3.30%
3.30%
2.90%
2.88%
2.15%
2.38%
2.20%
2.47%
2.22%
2.28%
2.40%
1.99%
1.50%
2007 2008 2009 2010 2011 2012 2013 2014
Bad debt ratio
(Source: http://data.worldbank.org/indicator )
3.6.5. Exchange rate
Figure 3.21. Exchange rate and bad debt ratio
USD/VND exchange rate and bad debt ratio
25000
20510
20828
21159
20000
18613
20935
3.60%
16105
16302
17065
3.40%
3.30%
15000 2.80%
10000
2.20%
2.10%
1.80%
1.50%
5000
0
4.00%
3.50%
3.00%
2.50%
2.00%
1.50%
1.00%
0.50%
0.00%
2007 2008 2009 2010 2011 2012 2013 2014
Exchange rate
Bad debt ratio
(Source: WB, Vietstock)
The chart shows that the impact of exchange rate on the bad debt ratio of commercial banks in the period from 2007 to 2014 is not clear. This can be explained by the proportion of loans to enterprises with import-export activities.
The ratio of foreign exchange rate to total outstanding loans of commercial banks is relatively low. In fact, the State Bank always implements many solutions to stabilize the exchange rate, not allowing the VND to appreciate or depreciate too much, affecting the business performance of economic sectors, thereby affecting the RRTD of commercial banks. On the other hand, the relationship between exchange rate, interest rate and inflation is very complicated, sometimes stabilizing the exchange rate causes inflationary pressure, interest rate increases, affecting the operations of commercial banks, and bad debt increases.
Chapter 3 Conclusion
In 2007, Vietnam officially became a member of the WTO, the Vietnamese economy also opened up, integrating more deeply into the international economy, thanks to which Vietnam's economic growth has improved a lot, typically the real GDP growth rate in 2007 reached 8.50%. However, in the period from 2008 to 2014, the world economy faced many difficulties, especially the impact of the global financial crisis, economic recession and European public debt crisis and Vietnam could not escape the impact of these difficulties. The activities of all individuals and organizations were extremely difficult, thereby greatly affecting the economy, including credit institutions. Bad debts of the commercial banking system tended to increase over the years, proving that the credit activities of commercial banks still had many limitations. In this chapter, the author analyzed the current situation of Vietnam's macro economy from 2007 to 2014 and the current situation of credit risk and bad debt of Vietnamese commercial banks. In addition, analyzing the impact of banking and macroeconomic factors on bank credit risk, represented by the bad debt ratio, is very necessary to review the operation of the Vietnamese commercial banking system in recent years, thereby helping policy makers have the right direction to perfect legal documents so that credit activities are increasingly of better quality, safer and more effective.