Management and risk management capacity of banks are still limited. When bad debt is high, it will hinder the production and circulation of goods in the economy due to the stagnation and delay of capital circulation.
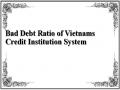
Thanks to the implementation of the project to handle outstanding debts, the first restructuring of the commercial banking system as well as the issuance of legal documents to facilitate the handling of bad debts, the bad debt ratio from 7.19% in 2002 has continuously decreased over the years, stopping at 1.97% in 2007. In addition to the reason for the decrease in bad debt value in 2003 and 2004, the high credit growth from 2003 to 2007 contributed greatly to the reduction of the bad debt ratio. During this period, credit was continuously expanded, the economy grew strongly, so borrowers did not encounter many difficulties in capital turnover and bank debt repayment. The value of bad debt in 2003 was 9 trillion VND and increased to 20 trillion VND in 2007, while the corresponding credit balance increased from 297 trillion VND to 1,017 trillion VND. However, in 2008, the value of bad debt increased sharply to 45 trillion VND, equivalent to an increase of 130% compared to the previous year. The reason was the global financial crisis and the economic downturn in Vietnam. The bad debt ratio increased from 1.97% in 2007 to 3.53% in 2008. However, the economic stimulus package in 2009 created conditions for credit to grow again at a high level, increasing by more than 30% in two consecutive years, which somewhat reduced the bad debt ratio in 2009 and 2010. However, in general, the decrease in the bad debt ratio during this period was more mechanical than intrinsic, as the value of bad debt still increased but the bad debt ratio decreased due to high credit growth (denominator). When abundant credit capital was provided to customers, capital turnover for production and business as well as debt repayment became more favorable. However, this led to the consequence that bad debt was not fundamentally resolved, with the potential risk of re-emergence. The reality shows that the consequences of the credit expansion policy in the period of 2011-2014 are very clear when the value of bad debt and the bad debt ratio both increased sharply when the credit capital was tightened and the macro economy fell into recession. Especially overdue debt and bad debt in 2012 changed in a bad direction. Specifically, the credit growth rate was low compared to previous years but overdue debt and bad debt increased and tended to continue to increase. Outstanding credit in 2012 increased by 20% compared to the end of 2011, but bad debt increased by nearly 50%. The value of bad debt in 2011 was 85 trillion VND, accounting for a bad debt ratio of 3.3% of the total outstanding debt, while in 2012 the value of bad debt was 126 trillion VND, accounting for a bad debt ratio of 4.08% of the total.
In addition, the total overdue debt of the whole system in 2012 was 310 trillion VND, an increase of 49 trillion VND compared to the end of 2011 and accounting for 11.2% of the total outstanding loans, including a part of overdue debt and bad debt that has been restructured by banks, including debt restructured under Decision No. 780/QD-NHNN and restructured debt of Vinashin and Vinalines.
8.00%
7.00%
6.00%
5.00%
4.00%
3.00%
2.00%
1.00%
0.00%
2000
2002
2004
2006
2008
2010
2012
2014
2016
2018
With the experience of handling bad debt in countries around the world, it shows that the establishment of a national-scale Asset Management Company (AMC) is a solution that plays a particularly important role in handling bad debt in many countries around the world. Therefore, on June 27, 2013, VAMC was established. Accordingly, VAMC is a special tool of the State to contribute to quickly handling bad debt, making finance healthy, minimizing risks for credit institutions, enterprises and promoting reasonable credit growth for the economy. The results after the establishment of VAMC showed that Vietnam's solution to handle bad debt is completely on the right track, the bad debt ratio in the period of 2015-2018 remained below 3% compared to the total outstanding credit according to international classification standards. Not only that, there are quite a few banks that buy back bad debt sold to VAMC to handle it themselves, up to now, 11 banks have announced that they have cleared bad debt at VAMC. However, according to foreign economic experts, these bad debt assessment figures are not really complete. Specifically, according to the independent credit rating organization Fitch Ratings, Vietnam's bad debt ratio may be 4 times higher than the reported figure, so Moody's has downgraded the credit rating of Vietnam's domestic and foreign currency bonds from B1 to B2 due to bad debt issues. Therefore, to avoid negative comments from foreign economic experts, Vietnamese banks need to implement and comply with international regulations more.
Maybe you are interested!
-
 Bad Debt Ratio of Vietnam's Credit Institution System
 -
 Solution Group on Bad Debt Monitoring and Handling Violations of Vietnam's Commercial Banking System
 -
 Bad Debt Management Vietnam Joint Stock Commercial Bank for Industry and Trade
 -
 Compare Vietnam's Loan-to-Deposit Ratio to Some Other Countries
 -
 Compare Profit Ratio And Bad Debt Credit Xk
Figure 4.5: Trends in Vietnam's bad debt ratio (2000 -2019)
(Source: According to annual report from the National Financial Supervisory Commission)
4.1.2 Economic growth status
Starting from a rather backward economy after the country's reunification in 1975, the economic growth rate was quite low, even negative (-3.5%) in 1980, the economic conditions were embargoed, aid from the Soviet Union and Eastern European countries was no longer available. Faced with that situation, Vietnam decided to reform the economy at the 6th Congress of the Communist Party of Vietnam in 1986. With the Government's innovation policies, Vietnam opened up to international economic integration, promoting remarkable economic growth, from a country under embargo to self-sufficiency in food, becoming an exporter of agricultural and aquatic products, becoming a country with a fairly average income in the world.
After the 1986 renovation policy, the economic growth rate always reached over 5% per year, even in 1989 the growth rate reached 7.36%, the highest in 5 years since the renovation. In the period 1992-1997, Vietnam's economic growth rate was quite high, the average annual growth rate reached 8.8%, in which in two consecutive years 95 and 96 the economic growth rate was 9.54% and 9.34% respectively. However, in 1998 and 1999, the growth rate decreased sharply to 5.76% and 4.77%, then recovered and grew steadily throughout the period 2000-2007. In this period, the average growth rate was nearly 7% per year. After joining the WTO, the economic growth rate decreased due to the impact of the global financial crisis, so the economic growth rate was only 5.66 and 5.39 in 2008 and 2009. However, after many efforts to overcome the crisis, the economy recovered, the average annual economic growth rate in the period 2010-2018 was over 6%, in which in 2018 the economic growth rate reached 7.1%, the highest in more than ten years since 2007 and was among the fastest growing economies in the region and the world. Compared to some countries with fast economic growth rates in the world over the past 32 years, Vietnam's average GDP growth is only behind China at 9.4%, above Korea and Malaysia at 5.9%, above Thailand at 5.2%, above the US at 2.6%, Japan at 1.7% and Germany at 1.8%. In addition, in terms of economic scale, when Vietnam was embargoed by the US, the economy grew very low with a scale of only 6.3 billion USD. After the US embargo was lifted in 1995, along with Vietnam's bilateral and multilateral cooperation with other countries, it helped economic growth and the scale of the economy gradually increased. In particular, from 2002 to 2007, the scale of the economy grew strongly when the Vietnam - US bilateral trade agreement officially took effect. According to IMF statistics, if in 2016, the size of Vietnam's economy reached about 217 billion USD , then by 2018...
10.00%
9.00%
8.00%
7.00%
6.00%
5.00%
4.00%
3.00%
2.00%
1.00%
0.00%
Vietnam's economic scale reached 240 billion USD, an increase of 20 billion USD compared to 2017, helping Vietnam enter the top 50 with the 49th position in the ranking of the top 50 economies in the world. And by the end of 2019, it achieved a growth of up to 7.02%, bringing the economic scale in 2019 to more than 262 billion USD, the highest ever.
2000Q1
2000Q4
2001Q3
2002Q2
2003Q1
2003Q4
2004Q3
2005Q2
2006Q1
2006Q4
2007Q3
2008Q2
2009Q1
2009Q4
2010Q3
2011Q2
2012Q1
2012Q4
2013Q3
2014Q2
2015Q1
2015Q4
2016Q3
2017Q2
2018Q1
2018Q4
2019Q3
Figure 4.6: Vietnam's economic growth trend (2000 - 2019)
(Source: International Monetary Fund)
4.1.3 Current status of trade openness
1998
2000
2004
2006
2016
2018
Exchange policy
new
A prominent advantage in the renovation policy is that Vietnam has quickly overcome the economic embargo. From a country that only had economic and trade relations mainly with former socialist countries, Vietnam has actively and proactively integrated into the regional and global economy. International relations and international trade have expanded both bilaterally and multilaterally, creating conditions for Vietnam to promote its comparative advantages.
1986
1992
1995
Main | Family | Sign | Association | Family | Main | TPP | |
determine | awake | enter | union | determine | enter | awake | Have |
about | family | APEC | determine | next | WTO | Sign | effect |
May | enter | love | short-sighted | TPP | force | ||
wear | ASEAN | trade | school | ||||
with | with | EU | |||||
EU | America |
Figure 4.7: Important milestones in Vietnam's international cooperation
(Source: author's synthesis)
60%
50%
40%
30%
20%
10%
0%
Immediately after the policy reform, Vietnam's export turnover has changed significantly. From a self-sufficient country that relied mainly on aid from socialist countries, it is now able to export agricultural and aquatic products to other countries. This has helped to change the import and export turnover significantly.
Billion USD
80
70
60
50
40
30
20
10
0
Export Import
2000Q1
2000Q4
2001Q3
2002Q2
2003Q1
2003Q4
2004Q3
2005Q2
2006Q1
2006Q4
2007Q3
2008Q2
2009Q1
2009Q4
2010Q3
2011Q2
2012Q1
2012Q4
2013Q3
2014Q2
2015Q1
2015Q4
2016Q3
2017Q2
2018Q1
2018Q4
2019Q3
Figure 4.8: Trends in Vietnam's trade openness (2000 - 2019) ( Source: International Monetary Fund )
2000Q1
2000Q4
2001Q3
2002Q2
2003Q1
2003Q4
2004Q3
2005Q2
2006Q1
2006Q4
2007Q3
2008Q2
2009Q1
2009Q4
2010Q3
2011Q2
2012Q1
2012Q4
2013Q3
2014Q2
2015Q1
2015Q4
2016Q3
2017Q2
2018Q1
2018Q4
2019Q3
Figure 4.9: Vietnam's import-export turnover (2000 - 2019) ( Source: International Monetary Fund )
Export turnover up to the fourth quarter of 2000 reached 14.3 billion USD, exceeding the level of a poor country, helping the export growth rate to be 24.1%, 3.6 times higher than the GDP growth rate. Total export turnover of goods in the period 2000-2005 reached 111 billion USD. Of which, up to the fourth quarter of 2005, total export turnover of goods increased very strongly, estimated at 32.2 billion USD. Export turnover of goods in the fourth quarter of 2005 had a high growth rate thanks to both increased export prices and volume. The average export price of goods increased by 11.5%, increasing export turnover by 3.3 billion USD. Meanwhile, the volume of goods exported increased by an average of nearly 9.4%, thereby increasing export turnover by about 2.4 billion USD. Meanwhile, the import turnover of goods in the fourth quarter of 2005 was estimated at 36.98 billion USD. However, this was the year with the lowest import growth rate since 2000, much lower than the average growth rate of 19.1% per year in the period 2000-2005. The import turnover in 2005 increased mainly due to the average increase in import prices of 11.5%, causing the import turnover to increase by 3.52 billion USD. During the period 2002-2011, Vietnam's export turnover had an impressive growth rate of about 19% per year, corresponding to 46% of GDP in 2001 to 78% of GDP in 2011, but imports increased at a higher rate from 61% to 84% of GDP in the same period, causing the trade balance during this period to always be in deficit. The trade deficit began to increase rapidly since 2002 at 62% of GDP and reached 19.3 billion USD after 2 years when Vietnam signed the bilateral agreement with the United States. The trade deficit continued to increase in the following years, averaging from 8.8% to 8.9% of GDP, corresponding to the periods 2002 - 2007 and 2008 - 2011. Import turnover increased faster than export, leading to a sudden increase in Vietnam's trade deficit in 2007. The trade deficit value skyrocketed from 5.06 billion USD in 2006 to 14.12 billion USD in 2007 and reached 18.02 billion USD in 2008. In the two years 2007 - 2008, the trade deficit value was 1.27 times higher than the entire period 2000 - 2006. In the period 2009 - 2011, the trade deficit value continued to be high, then tended to decrease gradually. In particular, Vietnam's trade deficit in the period 2002 - 2011 has been considered one of the serious macroeconomic imbalances at a high and prolonged level, causing many negative impacts on the economy and putting pressure on state budget spending. Because the structure of imported goods is mainly raw materials for domestic production industries, the trade deficit has increased the price level and Vietnam's price level has been pushed up due to the impact of price increases or inflation abroad. Moreover, the trade deficit also puts pressure on foreign currency supply and demand and devaluation of domestic currency, increasing
The burden of foreign debt and negative impact on income and social life. By 2012, Vietnam's trade balance suddenly shifted to a surplus of about 8.71 billion USD and began the surplus period of 2012 - 2015. It can be seen that the total two-way trade turnover in 2012 reached about 220.3 billion USD, of which export turnover was estimated at 114.5 billion USD, up 18.2%, while import turnover was approximately 105.8 billion USD, up 6.6% compared to 2011. By 2013, for the second consecutive year, our country had a trade surplus, estimated at 8.3 billion USD, export and import turnover both achieved very high increases compared to 2012, respectively at 132.1 billion USD and 123.3 billion USD. The trade surplus continued to be maintained in 2014 and 2015, respectively, at 11.9 billion USD or 6.3% of GDP and 7.39 billion USD or 3.6% of GDP. In 2015, the trade balance fell into a deficit of 3.55 billion USD and in 2016, it unexpectedly reached a surplus peak of 2.52 billion USD. By 2018, the total import-export value of Vietnam in 2018 reached 480.17 billion USD, an increase of 12.2%, equivalent to an increase of 52.05 billion USD in absolute terms compared to 2017. Thus, Vietnam's trade balance in 2018 reached a surplus of 6.8 billion USD, 3.2 times higher than the surplus in 2017. With the opening of economic and trade integration, Vietnam's import-export ranking (according to the WTO ranking) has increased significantly. If in 2006 Vietnam was ranked 50th in the world in terms of export and 44th in terms of import, by 2018 Vietnam had made impressive progress. That is, it was ranked 26th in terms of export of goods and 23rd in terms of import of goods. With this result, Vietnam is continuously in the group of 30 countries and territories with the largest import and export value of goods in the world, and within the ASEAN bloc, Vietnam is in third place in import and export, after Singapore and Thailand. At the end of 2019, the total import and export turnover of goods of the whole country reached 517.26 billion USD, an increase of 7.6% (equivalent to an increase of 36.69 billion USD) compared to 2018. Of which, the value of exported goods reached 264.19 billion USD, an increase of 8.4% and imported goods reached 253.07 billion USD, an increase of 6.8%, contributing to the country's trade surplus of goods in 2019 reaching a record surplus of 11.12 billion USD.
4.1.4 Inflation situation
With the 1986 renovation policy, not only did it help economic growth and import-export turnover increase significantly, but it also helped a country that was suffering from hyperinflation when the inflation rate from 3 digits in the period 1986-1988 was 398.1%, 362.6% and 411% respectively. The cause of the prolonged hyperinflation was hidden inflation that had occurred.
25.00%
20.00%
15.00%
10.00%
5.00%
0.00%
-5.00%
appeared in the late 70s and early 80s because the nature of the market was not determined by supply and demand, but the market distributed subsidies in kind, banks did not perform the function of financial intermediation, the budget did not follow the principle of using revenue to spend, so to compensate for cash deficit, budget deficit had to print money, then made a mistake when reforming salary prices in 1985.
2000Q1
2000Q4
2001Q3
2002Q2
2003Q1
2003Q4
2004Q3
2005Q2
2006Q1
2006Q4
2007Q3
2008Q2
2009Q1
2009Q4
2010Q3
2011Q2
2012Q1
2012Q4
2013Q3
2014Q2
2015Q1
2015Q4
2016Q3
2017Q2
2018Q1
2018Q4
2019Q3
Figure 4.10: Inflation fluctuations in Vietnam (2000 - 2019) ( Source: International Monetary Fund )
However, with the efforts of the renovation policy, the inflation rate from 3 digits was reduced to 2 digits during the period 1989-1995 and to 5.7% in 1996. However, the Asian financial crisis in 1997 affected Vietnam's goods exports, the demand for goods and services in the domestic market decreased sharply, while the supply of goods in the domestic market increased sharply, due to the results of the renovation and expansion of production and business of domestic enterprises and the increase in export inventory due to the sharp decline in demand for goods in the world market. The impact of both aggregate supply and aggregate demand has reduced domestic economic growth, and at the same time created pressure causing the domestic commodity price index to decline sharply in 1998 - 1999, even negative inflation in 2000 and 2001. In the face of this situation, the Government has taken measures to stimulate demand through loosening monetary and fiscal policies to free up and improve the efficiency of resource use, promote production and economic growth. This solution has helped the inflation rate increase steadily in the following years. In the period of 2002-2007, although inflation was below 8%,