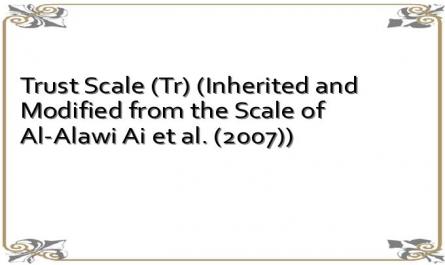
Table 3.1: Trust scale (TR) (inherited and adjusted from the scale of Al-Alawi AI et al. (2007))
STT
Encryption | Observation variable name | |
1 | TR1 | I believe I am treated fairly in the company. |
2 | TR2 | I trust that my colleagues will help me when needed. |
3 | TR3 | I trust that my co-workers will not disclose my personal information. with others |
4 | TR4 | I believe that colleagues have used the knowledge gained to solve problems. solve general company problems |
5 | TR5 | I believe that the company has certain rules and regulations to protect protect me from the harmful intentions of others |
6 | TR6 | I have a certain amount of trust in my colleagues in the company. |
Maybe you are interested!
-
 Research on treatment of rotator cuff tears using modified Mason-Allen tendon endoscopic suturing technique and creating micro-damage at the attachment area - 2
 -
 “Cronbach's Alpha Cost Factor Scale”
 -
 Managing cultural activities at the Center for Culture, Sports and Tourism of Phu Ninh district, Phu Tho province - 1
 -
 Some Pictures of the Transformation of Traditional Culture of Thai People in Mai Chau
 -
 Comparison of Geographical Conditions, Structure of Culture and Tourism Activities
Source: Qualitative research results
Table 3.2: Communication scale (CO) (inherited and adjusted from the scale of Al-Alawi AI et al. (2007))
STT
Encryption | Observation variable name | |
1 | CO1 | Employees regularly engage in direct (face-to-face) dialogue to facilitate facilitate knowledge sharing at my workplace |
2 | CO2 | Group discussion and collaborative work enhance communication skills. continue to promote knowledge sharing |
3 | CO3 | At the company, the language of communication between employees does not affect influence knowledge sharing |
4 | CO4 | The company regularly organizes communication skills training courses. for staff |
Source: Qualitative research results
Table 3.3: Leadership scale (LS) (inherited and adjusted from the scale of Jahani et al. (2011))
STT
Encryption | Observation variable name | |
1 | LS1 | Leaders always encourage participation and contribution of ideas. staff in decision making |
2 | LS2 | Leaders always show dedication to work |
3 | LS3 | Leaders always get the consensus of employees in their work. where i work |
4 | LS4 | Leaders always care about employees' lives |
5 | LS5 | Leaders regularly organize training programs and seminars. improve staff expertise |
Source: Qualitative research results
Table 3.4: Organizational structure (OS) scale (inherited and adapted from the scale of Al-Alawi AI et al. (2007), Lok and Crawford (2000)).
STT
Encryption | Observation variable name | |
1 | OS1 | Employees actively participate in the decision making process of company |
2 | OS2 | Knowledge sharing is made easy in the workplace. company regardless of employee or management |
3 | OS3 | Some company tasks require team formation from the Combine different departments to get the job done well |
4 | OS4 | My work structure is well designed. |
5 | OS5 | I find the work in the company is divided fairly. logic |
6 | OS6 | In my opinion, the human resources department contributes to the company's development. |
7 | OS7 | I find the HR department to be organized flexibly. |
Source: Qualitative research results
Table 3.5: Reward system (RS) scale (inherited and adapted from the scale of Al-Alawi AI et al. (2007), Jahani et al. (2011))
STT
Encryption | Observation variable name | |
1 | RS1 | Where I work, employees are rewarded when they share your knowledge with colleagues |
2 | RS2 | Rewards are effective in encouraging knowledge sharing. employee awareness in the company |
3 | RS3 | Employees are rewarded based on high teamwork performance. more than individual work efficiency |
4 | RS4 | I get compliments from my colleagues when I share my knowledge. my consciousness with them |
5 | RS5 | When I share knowledge, I have the opportunity to demonstrate my skills and abilities. self |
6 | RS6 | The more knowledge I share, the more my reputation and prestige increase. |
Source: Qualitative research results
Table 3.6: Information system (IT) scale (inherited and adjusted from the scale of Al-Alawi AI et al. (2007))
STT
Encryption | Observation variable name | |
1 | IT1 | A fully equipped information technology system will promote effective knowledge sharing |
2 | IT2 | I feel comfortable and easy when using technology devices. technology available in the company to share knowledge |
3 | IT3 | The company applies good information technology systems to improve performance |
4 | IT4 | Sharing knowledge accumulated systematically through the system information |
Source: Qualitative research results
Table 3.7: Knowledge Sharing Scale (KS) (inherited and adapted from the scale of Al-Alawi AI et al. (2007))
STT
Encryption | Observation variable name | |
1 | KS1 | Some tasks have to be done through teamwork, cooperation between employees |
2 | KS2 | I do not hesitate to share my professional knowledge. me and my colleagues |
3 | KS3 | In my company, most employees are willing to share knowledge. of their own freely and openly |
4 | KS4 | My colleagues often exchange knowledge and experience. them while working |
5 | KS5 | I am not harmed when sharing knowledge with colleagues. |
Source: Qualitative research results
3.3 Quantitative research
3.3.1 Research sample design
Survey subjects: employees working at Joint Stock Commercial Banks in Can Tho province.
Sample size:
The research model consists of 37 variables representing the attributes of 7 factors. According to Hair et al. (2006), the minimum sample size for this study will be 185 observed variables (5 observations x 37 variables). In order for the research sample to reach a good level and ensure reliability, the author chose a sample size of 235 observations for this research topic. However, to achieve a sample size of 235 observations after eliminating samples that did not meet information requirements or were of low quality, the author decided to use 300 questionnaires and send them to 300 employees working at Joint Stock Commercial Banks in Can Tho province.
3.3.2 Questionnaire design
The questionnaire was designed in the following 3 steps:
Step 1: The questionnaire was constructed based on the components and measurement attributes after qualitative research. The study used a 5-point Likert scale with
5 levels from “strongly disagree” to “strongly agree” to assess the level of agreement/disagreement of the survey subjects
Table 3.8: 5-point Likert scale table
1
2 | 3 | 4 | 5 | |
Completely disagree | Disagree | Neutral | Agree | Completely Agree |
Source: Author's synthesis Step 2: The preliminary questionnaire was designed and a pilot interview was conducted with about 20 respondents to preliminarily evaluate the scale and adjust the wording to suit the research content as well as the context in Vietnam to ensure that respondents can understand and answer correctly according to the purpose of the study.
rescue.
Step 3: After basing on the results of the pilot interview, the author edited the official questionnaire used to collect information from the research sample. The official interview questionnaire includes 37 observation variables, divided into 2 parts:
- Part 1: Questions to collect employees' assessments of organizational culture factors that affect employee knowledge sharing (37 questions).
- Part 2: Personal information of the survey subjects for later data classification and analysis (3 questions).
3.3.3 Data collection
To collect data, the author sent questionnaires directly and via email to employees working at Commercial Joint Stock Banks in Can Tho province.
The survey sample was selected by a non-probability convenience method. Information about the collected sample: 300 questionnaires were sent out (including 210 direct questionnaires and 90 questionnaires collected via Google Docs). After screening and eliminating invalid responses, 274 valid questionnaires were collected (reaching a rate of 91.33%).
3.3.4 Research data processing methods
Data was analyzed and processed using SPSS 20.0 software with the following contents:
Descriptive statistical analysis : The purpose of the analysis is to provide an overview of the research sample based on frequency, proportion, average, maximum value, minimum value, statistical charts...
Cronbach's Alpha coefficient analysis : According to Nunnally and Bernstein (1994), inappropriate observed variables will be eliminated if the variable-total correlation coefficient is less than
0.3 and the scale will be accepted when Cronbach's Alpha ≥ 0.6.
Exploratory factor analysis (EFA): Test the correlation between measured variables using the arlett test with a significance level of 5% (Hair et al., 2006; Nguyen Dinh Tho, 2011); test KMO > 0.5 to test the correlation (Nguyen Dinh Tho, 2011). The method of extracting coefficients used is Principal Components and Varimax rotation. Criteria for selecting the number of factors: Based on Eigenvalues index > 1 and available theoretical model (Nguyen Dinh Tho, 2011). Test the suitability of the EFA model compared to the survey data: Total extracted variance (Cumulative %) ≥ 50% (Nguyen Dinh Tho, 2011). Test convergent validity: To achieve discriminant validity, the variables must have factor loading coefficients ≥ 0.5; Variables with factor loading ≤ 0.5 will be eliminated (Nguyen Dinh Tho, 2011).
Correlation analysis: There are two ways to evaluate the level of correlation in linear regression analysis: through scatter plots or Pearson correlation coefficient. In which, the closer the Pearson correlation coefficient is to 1, the more closely the correlation between the two variables is (Hoang Trong and Chu Nguyen Mong Ngoc, 2008).
Regression analysis : Linear regression method analyzes the relationship between one or more independent variables and a quantitative dependent variable and is a commonly used method to test the suitability of the model. And test the suitability of the model through the F test and adjusted R2 coefficient. (Hoang Trong and Chu Nguyen Mong Ngoc, 2008) .
+ The adjusted R2 coefficient is the usual standard used to determine the level of
fit of the constructed linear regression model to the data.
+ F test to examine the suitability of the overall linear regression model. F test for the variation of regression deviation and residual deviation is also used to test the suitability of the regression model. F test has the hypothesis H 0 stating that the regression coefficients of the model are all equal to 0. If this hypothesis is rejected, we can conclude that the regression model is suitable.
+ Evaluate the level of impact (strong/weak) between independent variables on dependent variables through the eta coefficient.
+ In addition, to ensure that multicollinearity does not occur, the author also considers the correlation between independent variables. Hoang Trong and Chu Nguyen Mong Ngoc (2008) said that multicollinearity can be tested through the variance inflation factor (VIF) and if VIF > 10, multicollinearity will occur.
Chapter 3 Summary
Chapter 3 presents the research process, survey methods and data processing methods. This chapter also presents the qualitative research results and the official scale used in the survey. The official scale includes 32 observed variables of 6 organizational culture factors and 5 observed variables of knowledge sharing.
Chapter 4: RESEARCH RESULTS
Chapter 4 focuses on processing the collected data and performing the following analyses: descriptive statistics of the sample, evaluating the scale through Cronbach's Alpha reliability coefficient and exploratory factor analysis (EFA), testing the research model and research hypothesis using correlation analysis and multiple regression.
4.1 Descriptive statistics of the research sample
Table 4.1: Sample descriptive statistics
Characteristic
Quantity | Rate (%) | ||
Sex | Male | 120 | 43.8 |
Female | 154 | 56.2 | |
Add | 274 | 100.00 | |
Age | 18-35 years old | 195 | 71.17 |
36-45 years old | 60 | 21.90 | |
>45 years old | 19 | 6.93 | |
Add | 274 | 100.00 | |
Education level | Secondary, college | 41 | 14.96 |
University | 197 | 71.90 | |
Postgraduate | 36 | 13.14 | |
Add | 274 | 100.00 | |
after:
Source: Author's data analysis results
The results of descriptive statistics of the sample (Table 4.1) used for research analysis are as follows:
Regarding gender: in the survey sample of 274 respondents, there were 120 males (43.8%) and
154 female (56.2%).
About age: from 18-35 years old, there are 195 people, accounting for 71.17%; from 36-45 years old, there are 60 people.
21.90% of people are over 45 years old, 19 people are over 45 years old, 6.93%.
Regarding education level: 41 people (14.96%) have intermediate or college degrees; 197 people (71.90%) have university degrees and 36 people (13.14%) have postgraduate degrees.