Table 3.38. Chi-square test of PT preserving neurovascular bundle-RLC.
Parameter
Index | Degree of freedom | p-value | |
Chi squared | 15,333 | 2 | 0.001 |
Difference coefficient | 15,792 | 2 | 0.002 |
Linear relationship between two variables | 13,888 | 1 | 0.001 |
Total | 41 |
Maybe you are interested!
-
![Mobile Phone Usage in Hanoi Inner City Area
zt2i3t4l5ee
zt2a3gsconsumer,consumption,consumer behavior,marketing,mobile marketing
zt2a3ge
zc2o3n4t5e6n7ts
- Test the relationship between demographic variables and consumer behavior for Mobile Marketing activities
The analysis method used is the Chi-square test (χ2), with statistical hypotheses H0 and H1 and significance level α = 0.05. In case the P index (p-value) or Sig. index in SPSS has a value less than or equal to the significance level α, the hypothesis H0 is rejected and vice versa. With this testing procedure, the study can evaluate the difference in behavioral trends between demographic groups.
CHAPTER 4
RESEARCH RESULTS
During two months, 1,100 survey questionnaires were distributed to mobile phone users in the inner city of Hanoi using various methods such as direct interviews, sending via email or using questionnaires designed on the Internet. At the end of the survey, after checking and eliminating erroneous questionnaires, the study collected 858 complete questionnaires, equivalent to a rate of about 78%. In addition, the research subjects of the thesis are only people who are using mobile phones, so people who do not use mobile phones are not within the scope of the thesis, therefore, the questionnaires with the option of not using mobile phones were excluded from the scope of analysis. The number of suitable survey questionnaires included in the statistical analysis was 835.
4.1 Demographic characteristics of the sample
The structure of the survey sample is divided and statistically analyzed according to criteria such as gender, age, occupation, education level and personal income. (Detailed statistical table in Appendix 6)
- Gender structure: Of the 835 completed questionnaires, 49.8% of respondents were male, equivalent to 416 people, and 50.2% were female, equivalent to 419 people. The survey results of the study are completely consistent with the gender ratio in the population structure of Vietnam in general and Hanoi in particular (Male/Female: 49/51).
- Age structure: 36.6% of respondents are <23 years old, equivalent to 306 people. People from 23-34 years old
accounting for the highest proportion: 44.8% equivalent to 374 people, people aged 35-45 and >45 are 70 and 85 people equivalent to 8.4% and 10.2% respectively. Looking at the results of this survey, we can see that the young people - youth account for a large proportion of the total number of people participating in the survey. Meanwhile, the middle-aged people including two age groups of 35 - 45 and >45 have a low rate of participation in the survey. This is completely consistent with the reality when Mobile Marketing is identified as a Marketing service aimed at young people (people under 35 years old).
- Structure by educational level: among 835 valid responses, 541 respondents had university degrees, accounting for the highest proportion of ~ 75%, 102 had secondary school degrees, ~ 13.1%, and 93 had post-graduate degrees, ~ 11.9%.
- Occupational structure: office workers and civil servants are the group with the highest rate of participation with 39.4%, followed by students with 36.6%. Self-employed people account for 12%, retired housewives are 7.8% and other occupational groups account for 4.2%. The survey results show that the student group has the same rate as the group aged <23 at 36.6%. This shows the accuracy of the survey data. In addition, the survey results distributed by occupational criteria have a rate almost similar to the sample division rate in chapter 3. Therefore, it can be concluded that the survey data is suitable for use in analysis activities.
- Income structure: the group with income from 3 to 5 million has the highest rate with 39% of the total number of respondents. This is consistent with the income structure of Hanoi people and corresponds to the average income of the group of civil servants and office workers. Those
People with no income account for 23%, income under 3 million VND accounts for 13% and income over 5 million VND accounts for 25%.
4.2 Mobile phone usage in Hanoi inner city area
According to the survey results, most respondents said they had used the phone for more than 1 year, specifically: 68.4% used mobile phones from 4 to 10 years, 23.2% used from 1 to 3 years, 7.8% used for more than 10 years. Those who used mobile phones for less than 1 year accounted for only a very small proportion of ~ 0.6%. (Table 4.1)
Table 4.1: Time spent using mobile phones
Frequency
Ratio (%)
Valid Percentage
Cumulative Percentage
Alid
<1 year
5
.6
.6
.6
1-3 years
194
23.2
23.2
23.8
4-10 years
571
68.4
68.4
92.2
>10 years
65
7.8
7.8
100.0
Total
835
100.0
100.0
The survey indexes on the time of using mobile phones of consumers in the inner city of Hanoi are very impressive for a developing country like Vietnam and also prove that Vietnamese consumers have a lot of experience using this high-tech device. Moreover, with the majority of consumers surveyed having a relatively long time of use (4-10 years), it partly proves that mobile phones have become an important and essential item in peoples daily lives.
When asked about the mobile phone network they are using, 31% of respondents said they are using the network of Vietel company, 29% use the network of
of Mobifone company, 27% use Vinaphone companys network and 13% use networks of other providers such as E-VN telecom, S-fone, Beeline, Vietnammobile. (Figure 4.1).
Figure 4.1: Mobile phone network in use
Compared with the announced market share of mobile telecommunications service providers in Vietnam (Vietel: 36%, Mobifone: 29%, Vinaphone: 28%, the remaining networks: 7%), we see that the survey results do not have many differences. However, the statistics show that there is a difference in the market share of other networks because the Hanoi market is one of the two main markets of small networks, so their market share in this area will certainly be higher than that of the whole country.
According to a report by NielsenMobile (2009) [8], the number of prepaid mobile phone subscribers in Hanoi accounts for 95% of the total number of subscribers, however, the results of this survey show that the percentage of prepaid subscribers has decreased by more than 20%, only at 70.8%. On the contrary, the number of postpaid subscribers tends to increase from 5% in 2009 to 19.2%. Those who are simultaneously using both types of subscriptions account for 10%. (Table 4.2).
Table 4.2: Types of mobile phone subscribers
Frequency
Ratio (%)
Valid Percentage
Cumulative Percentage
Valid
Prepay
591
70.8
70.8
70.8
Pay later
160
19.2
19.2
89.9
Both of the above
84
10.1
10.1
100.0
Total
835
100.0
100.0
The above figures show the change in the psychology and consumption habits of Vietnamese consumers towards mobile telecommunications services, when the use of prepaid subscriptions and junk SIMs is replaced by the use of two types of subscriptions for different purposes and needs or switching to postpaid subscriptions to enjoy better customer care services.
In addition, the majority of respondents have an average spending level for mobile phone services from 100 to 300 thousand VND (406 ~ 48.6% of total respondents). The high spending level (> 500 thousand VND) is the spending level with the lowest number of people with only 8.4%, on the contrary, the low spending level (under 100 thousand VND) accounts for the second highest proportion among the groups of respondents with 25.4%. People with low spending levels mainly fall into the group of students and retirees/housewives - those who have little need to use or mainly use promotional SIM cards. (Table 4.3).
Table 4.3: Spending on mobile phone charges
Frequency
Ratio (%)
Valid Percentage
Cumulative Percentage
Valid
<100,000
212
25.4
25.4
25.4
100-300,000
406
48.6
48.6
74.0
300,000-500,000
147
17.6
17.6
91.6
>500,000
70
8.4
8.4
100.0
Total
835
100.0
100.0
The statistics in Table 4.3 are similar to the percentages in the NielsenMobile survey results (2009) with 73% of mobile phone users having medium spending levels and only 13% having high spending levels.
The survey results also showed that up to 31% ~ nearly one-third of respondents said they sent more than 10 SMS messages/day, meaning that on average they sent 1 SMS message for every working hour. Those with an average SMS message volume (from 3 to 10 messages/day) accounted for 51.1% and those with a low SMS message volume (less than 3 messages/day) accounted for 17%. (Table 4.4)
Table 4.4: Number of SMS messages sent per day
Frequency
Ratio (%)
Valid Percentage
Cumulative Percentage
Valid
<3 news
142
17.0
17.0
17.0
3-10 news
427
51.1
51.1
68.1
>10 news
266
31.9
31.9
100.0
Total
835
100.0
100.0
Similar to sending messages, those with an average message receiving rate (from 3-10 messages/day) accounted for the highest percentage of ~ 55%, followed by those with a high number of messages (over 10 messages/day) ~ 24% and those with a low number of messages received daily (under 3 messages/day) remained at the bottom with 21%. (Table 4.5)
Table 4.5: Number of SMS messages received per day
Frequency
Ratio (%)
Valid Percentage
Cumulative Percentage
Valid
<3 news
175
21.0
21.0
21.0
3-10 news
436
55.0
55.0
76.0
>10 news
197
24.0
24.0
100.0
Total
835
100.0
100.0
When comparing the data of the two result tables 4.4 and 4.5, we can see the reasonableness between the ratio of the number of messages sent and the number of messages received daily by the interview participants.
4.3 Current status of SMS advertising and Mobile Marketing
According to the interview results, in the 3 months from the time of the survey and before, 94% of respondents, equivalent to 785 people, said they received advertising messages, while only a very small percentage of 6% (only 50 people) did not receive advertising messages (Table 4.6).
Table 4.6: Percentage of people receiving advertising messages in the last 3 months
Frequency
Ratio (%)
Valid Percentage
Cumulative Percentage
Valid
Have
785
94.0
94.0
94.0
Are not
50
6.0
6.0
100.0
Total
835
100.0
100.0
The results of Table 4.6 show that consumers in the inner city of Hanoi are very familiar with advertising messages. This result is also the basis for assessing the knowledge, experience and understanding of the respondents in the interview. This is also one of the important factors determining the accuracy of the survey results.
In addition, most respondents said they had received promotional messages, but only 24% of them had ever taken the action of registering to receive promotional messages, while 76% of the remaining respondents did not register to receive promotional messages but still received promotional messages every day. This is the first sign indicating the weaknesses and shortcomings of lax management of this activity in Vietnam. (Table 4.7)
div.maincontent .s1 { color: black; font-family:Times New Roman, serif; font-style: italic; font-weight: normal; text-decoration: none; font-size: 14pt; } div.maincontent .s2 { color: black; font-family:Times New Roman, serif; font-style: normal; font-weight: bold; text-decoration: none; font-size: 14pt; } div.maincontent .s3 { color: black; font-family:Times New Roman, serif; font-style: normal; font-weight: bold; text-decoration: none; font-size: 14pt; } div.maincontent .p { color: black; font-family:Times New Roman, serif; font-style: normal; font-weight: normal; text-decoration: none; font-size: 14pt; margin:0pt; } div.maincontent p { color: black; font-family:Times New Roman, serif; font-style: normal; font-weight: normal; text-decoration: none; font-size: 14pt; margin:0pt; } div.maincontent .s4 { color: black; font-family:Times New Roman, serif; font-style: normal; font-weight: normal; text-decoration: none; font-size: 9.5pt; vertical-align: 6pt; } div.maincontent .s5 { color: black; font-family:Times New Roman, serif; font-style: normal; font-weight: bold; text-decoration: none; font-size: 14pt; } div.maincontent .s6 { color: black; font-family:Times New Roman, serif; font-style: normal; font-weight: bold; text-decoration: none; font-size: 14pt; } div.maincontent .s7 { color: black; font-family:Times New Roman, serif; font-style: italic; font-weight: normal; text-decoration: none; font-size: 14pt; } div.maincontent .s8 { color: black; font-family:Times New Roman, serif; font-style: italic; font-weight: bold; text-decoration: none; font-size: 14pt; } div.maincontent .s9 { color: black; font-family:Arial, sans-serif; font-style: normal; font-weight: normal; text-decoration: none; font-size: 14pt; } div.maincontent .s10 { color: black; font-family:Arial, sans-serif; font-style: normal; font-weight: normal; text-decoration: none; font-size: 12pt; } div.maincontent .s11 { color: black; font-family:Times New Roman, serif; font-style: normal; font-weight: normal; font-size: 14pt; } div.maincontent .s12 { color: black; font-family:Arial, sans-serif; font-style: normal; font-weight: normal; text-decoration: none; font-size: 14pt; } div.maincontent .s13 { color: black; font-family:Times New Roman, serif; font-style: normal; font-weight: normal; text-decoration: none; font-size: 14pt; } div.maincontent .s14 { color: black; font-family:Times New Roman, serif; font-style: normal; font-weight: bold; text-decoration: none; font-size: 13pt; } div.maincontent .s15 { color: black; font-family:Times New Roman, serif; font-style: italic; font-weight: normal; text-decoration: none; font-size: 9.5pt; vertical-align: 6pt; } div.maincontent .s16 { color: black; font-family:Times New Roman, serif; font-style: normal; font-weight: normal; text-decoration: none; font-size: 5.5pt; vertical-align: 3pt; } div.maincontent .s17 { color: black; font-family:Times New Roman, serif; font-style: normal; font-weight: normal; text-decoration: none; font-size: 8.5pt; } div.maincontent .s18 { color: black; font-family:Times New Roman, serif; font-style: italic; font-weight: bold; font-size: 14pt; } div.maincontent .s19 { color: black; font-family:Times New Roman, serif; font-style: normal; font-weight: bold; font-size: 14pt; } div.maincontent .s20 { color: black; font-family:Times New Roman, serif; font-style: italic; font-weight: normal; text-decoration: none; font-size: 13pt; } div.maincontent .s21 { color: black; font-family:Times New Roman, serif; font-style: normal; font-weight: normal; text-decoration: none; font-size: 14pt; } div.maincontent .s22 { color: black; font-family:Courier New, monospace; font-style: normal; font-weight: normal; text-decoration: none; font-size: 14pt; } div.maincontent .s23 { color: black; font-family:Times New Roman, serif; font-style: normal; font-weight: normal; text-decoration: none; font-size: 13pt; } div.maincontent .s24 { color: black; font-family:Times New Roman, serif; font-style: italic; font-weight: normal; text-decoration: none; font-size: 13pt; } div.maincontent .s25 { color: black; font-family:Times New Roman, serif; font-style: normal; font-weight: bold; text-decoration: none; font-size: 14pt; } div.maincontent .s26 { color: black; font-family:Times New Roman, serif; font-style: normal; font-weight: normal; text-decoration: none; font-size: 14pt; } div.maincontent .s27 { color: black; font-family:Times New Roman, serif; font-style: normal; font-weight: normal; text-decoration: none; font-size: 1.5pt; } div.maincontent .s28 { color: black; font-family:Times New Roman, serif; font-style: normal; font-weight: normal; text-decoration: none; font-size: 11pt; } div.maincontent .s29 { color: black; font-family:Times New Roman, serif; font-style: normal; font-weight: bold; text-decoration: none; font-size: 13pt; } div.maincontent .s30 { color: black; font-family:Times New Roman, serif; font-style: italic; font-weight: bold; text-decoration: none; font-size: 13pt; } div.maincontent .s31 { color: black; font-family:Times New Roman, serif; font-style: normal; font-weight: normal; text-decoration: none; font-size: 13pt; } div.maincontent .s32 { color: black; font-family:Arial, sans-serif; font-style: normal; font-weight: normal; text-decoration: none; font-size: 10.5pt; } div.maincontent .s33 { color: black; font-family:Arial, sans-serif; font-style: normal; font-weight: normal; text-decoration: none; font-size: 11pt; } div.maincontent .s35 { color: black; font-family:Arial, sans-serif; font-style: normal; font-weight: bold; text-decoration: none; font-size: 10.5pt; } div.maincontent .s36 { color: #F00; font-family:Arial, sans-serif; font-style: italic; font-weight: bold; text-decoration: none; font-size: 10.5pt; } div.maincontent .s37 { color: black; font-family:Arial, sans-serif; font-style: normal; font-weight: bold; text-decoration: none; font-size: 10.5pt; } div.maincontent .s38 { color: black; font-family:Times New Roman, serif; font-style: normal; font-weight: bold; text-decoration: none; font-size: 8.5pt; vertical-align: 5pt; } div.maincontent .s39 { color: black; font-family:Arial, sans-serif; font-style: normal; font-weight: normal; text-decoration: none; font-size: 10.5pt; } div.maincontent .s40 { color: black; font-family:Arial, sans-serif; font-style: normal; font-weight: normal; text-decoration: none; font-size: 7pt; vertical-align: 4pt; } div.maincontent .s41 { color: black; font-family:Arial, sans-serif; font-style: normal; font-weight: bold; text-decoration: none; font-size: 10.5pt; } div.maincontent .s42 { color: black; font-family:Arial, sans-serif; font-style: normal; font-weight: bold; text-decoration: none; font-size: 11pt; } div.maincontent .s43 { color: black; font-family:Arial, sans-serif; font-style: normal; font-weight: bold; text-decoration: none; font-size: 7.5pt; vertical-align: 5pt; } div.maincontent .s44 { color: black; font-family:Arial, sans-serif; font-style: normal; font-weight: normal; text-decoration: none; font-size: 7pt; vertical-align: 5pt; } div.maincontent .s45 { color: #F00; font-family:Arial, sans-serif; font-style: normal; font-weight: bold; text-decoration: none; font-size: 10.5pt; } div.maincontent .s46 { color: black; font-family:Arial, sans-serif; font-style: normal; font-weight: bold; text-decoration: none; font-size: 7pt; vertical-align: 5pt; } div.maincontent .s47 { color: black; font-family:Arial, sans-serif; font-style: normal; font-weight: bold; text-decoration: none; font-size: 11pt; } div.maincontent .s48 { color: black; font-family:Times New Roman, serif; font-style: normal; font-weight: normal; text-decoration: none; font-size: 14pt; } div.maincontent .s49 { color: black; font-family:Times New Roman, serif; font-style: italic; font-weight: normal; text-decoration: none; font-size: 9.5pt; vertical-align: -2pt; } div.maincontent .s50 { color: black; font-family:Times New Roman, serif; font-style: normal; font-weight: normal; text-decoration: none; font-size: 9.5pt; } div.maincontent .s51 { color: black; font-family:Times New Roman, serif; font-style: italic; font-weight: normal; text-decoration: none; font-size: 9.5pt; vertical-align: -1pt; } div.maincontent .s52 { color: black; font-family:Times New Roman, serif; font-style: normal; font-weight: normal; text-decoration: none; font-size: 9.5pt; vertical-align: -2pt; } div.maincontent .s53 { color: black; font-family:Times New Roman, serif; font-style: normal; font-weight: normal; text-decoration: none; font-size: 13pt; } div.maincontent .s54 { color: black; font-family:Times New Roman, serif; font-style: normal; font-weight: normal; text-decoration: none; font-size: 9.5pt; vertical-align: -1pt; } div.maincontent .s55 { color: black; font-family:Arial, sans-serif; font-style: normal; font-weight: normal; text-decoration: none; font-size: 10.5pt; } div.maincontent .s56 { color: #00F; font-family:Times New Roman, serif; font-style: normal; font-weight: normal; font-size: 14pt; } div.maincontent .s57 { color: #00F; font-family:Times New Roman, serif; font-style: normal; font-weight: normal; text-decoration: none; font-size: 14pt; } div.maincontent .s58 { color: #00F; font-family:Times New Roman, serif; font-style: normal; font-weight: normal; font-size: 14pt; } div.maincontent .s59 { color: #00F; font-family:Times New Roman, serif; font-style: normal; font-weight: normal; text-decoration: none; font-size: 13pt; } div.maincontent .s60 { color: #00F; font-family:Times New Roman, serif; font-style: normal; font-weight: normal; font-size: 13pt; } div.maincontent .s61 { color: black; font-family:Times New Roman, serif; font-style: normal; font-weight: bold; text-decoration: none; font-size: 14pt; } div.maincontent .s62 { color: black; font-family:Times New Roman, serif; font-style: italic; font-weight: bold; text-decoration: none; font-size: 14pt; } div.maincontent .s63 { color: black; font-family:Times New Roman, serif; font-style: italic; font-weight: bold; text-decoration: none; font-size: 14pt; } div.maincontent .content_head2 { color: #F00; font-family:Times New Roman, serif; font-style: normal; font-weight: bold; text-decoration: none; font-size: 14pt; } div.maincontent .s64 { color: black; font-family:Times New Roman, serif; font-style: italic; font-weight: bold; text-decoration: none; font-size: 13pt; } div.maincontent .s67 { color: black; font-family:Arial, sans-serif; font-style: normal; font-weight: normal; text-decoration: none; font-size: 9.5pt; } div.maincontent .s68 { color: black; font-family:Times New Roman, serif; font-style: normal; font-weight: bold; text-decoration: none; font-size: 12pt; } div.maincontent .s69 { color: black; font-family:Times New Roman, serif; font-style: italic; font-weight: normal; text-decoration: none; font-size: 12pt; } div.maincontent .s70 { color: black; font-family:Times New Roman, serif; font-style: normal; font-weight: normal; tex](https://tailieuthamkhao.com/uploads/2022/12/03/cac-nhan-to-anh-huong-den-hanh-vi-nguoi-tieu-dung-doi-voi-hoat-dong-13-1-120x90.jpg)
![Mobile Phone Usage in Hanoi Inner City Area
zt2i3t4l5ee
zt2a3gsconsumer,consumption,consumer behavior,marketing,mobile marketing
zt2a3ge
zc2o3n4t5e6n7ts
- Test the relationship between demographic variables and consumer behavior for Mobile Marketing activities
The analysis method used is the Chi-square test (χ2), with statistical hypotheses H0 and H1 and significance level α = 0.05. In case the P index (p-value) or Sig. index in SPSS has a value less than or equal to the significance level α, the hypothesis H0 is rejected and vice versa. With this testing procedure, the study can evaluate the difference in behavioral trends between demographic groups.
CHAPTER 4
RESEARCH RESULTS
During two months, 1,100 survey questionnaires were distributed to mobile phone users in the inner city of Hanoi using various methods such as direct interviews, sending via email or using questionnaires designed on the Internet. At the end of the survey, after checking and eliminating erroneous questionnaires, the study collected 858 complete questionnaires, equivalent to a rate of about 78%. In addition, the research subjects of the thesis are only people who are using mobile phones, so people who do not use mobile phones are not within the scope of the thesis, therefore, the questionnaires with the option of not using mobile phones were excluded from the scope of analysis. The number of suitable survey questionnaires included in the statistical analysis was 835.
4.1 Demographic characteristics of the sample
The structure of the survey sample is divided and statistically analyzed according to criteria such as gender, age, occupation, education level and personal income. (Detailed statistical table in Appendix 6)
- Gender structure: Of the 835 completed questionnaires, 49.8% of respondents were male, equivalent to 416 people, and 50.2% were female, equivalent to 419 people. The survey results of the study are completely consistent with the gender ratio in the population structure of Vietnam in general and Hanoi in particular (Male/Female: 49/51).
- Age structure: 36.6% of respondents are <23 years old, equivalent to 306 people. People from 23-34 years old
accounting for the highest proportion: 44.8% equivalent to 374 people, people aged 35-45 and >45 are 70 and 85 people equivalent to 8.4% and 10.2% respectively. Looking at the results of this survey, we can see that the young people - youth account for a large proportion of the total number of people participating in the survey. Meanwhile, the middle-aged people including two age groups of 35 - 45 and >45 have a low rate of participation in the survey. This is completely consistent with the reality when Mobile Marketing is identified as a Marketing service aimed at young people (people under 35 years old).
- Structure by educational level: among 835 valid responses, 541 respondents had university degrees, accounting for the highest proportion of ~ 75%, 102 had secondary school degrees, ~ 13.1%, and 93 had post-graduate degrees, ~ 11.9%.
- Occupational structure: office workers and civil servants are the group with the highest rate of participation with 39.4%, followed by students with 36.6%. Self-employed people account for 12%, retired housewives are 7.8% and other occupational groups account for 4.2%. The survey results show that the student group has the same rate as the group aged <23 at 36.6%. This shows the accuracy of the survey data. In addition, the survey results distributed by occupational criteria have a rate almost similar to the sample division rate in chapter 3. Therefore, it can be concluded that the survey data is suitable for use in analysis activities.
- Income structure: the group with income from 3 to 5 million has the highest rate with 39% of the total number of respondents. This is consistent with the income structure of Hanoi people and corresponds to the average income of the group of civil servants and office workers. Those
People with no income account for 23%, income under 3 million VND accounts for 13% and income over 5 million VND accounts for 25%.
4.2 Mobile phone usage in Hanoi inner city area
According to the survey results, most respondents said they had used the phone for more than 1 year, specifically: 68.4% used mobile phones from 4 to 10 years, 23.2% used from 1 to 3 years, 7.8% used for more than 10 years. Those who used mobile phones for less than 1 year accounted for only a very small proportion of ~ 0.6%. (Table 4.1)
Table 4.1: Time spent using mobile phones
Frequency
Ratio (%)
Valid Percentage
Cumulative Percentage
Alid
<1 year
5
.6
.6
.6
1-3 years
194
23.2
23.2
23.8
4-10 years
571
68.4
68.4
92.2
>10 years
65
7.8
7.8
100.0
Total
835
100.0
100.0
The survey indexes on the time of using mobile phones of consumers in the inner city of Hanoi are very impressive for a developing country like Vietnam and also prove that Vietnamese consumers have a lot of experience using this high-tech device. Moreover, with the majority of consumers surveyed having a relatively long time of use (4-10 years), it partly proves that mobile phones have become an important and essential item in peoples daily lives.
When asked about the mobile phone network they are using, 31% of respondents said they are using the network of Vietel company, 29% use the network of
of Mobifone company, 27% use Vinaphone companys network and 13% use networks of other providers such as E-VN telecom, S-fone, Beeline, Vietnammobile. (Figure 4.1).
Figure 4.1: Mobile phone network in use
Compared with the announced market share of mobile telecommunications service providers in Vietnam (Vietel: 36%, Mobifone: 29%, Vinaphone: 28%, the remaining networks: 7%), we see that the survey results do not have many differences. However, the statistics show that there is a difference in the market share of other networks because the Hanoi market is one of the two main markets of small networks, so their market share in this area will certainly be higher than that of the whole country.
According to a report by NielsenMobile (2009) [8], the number of prepaid mobile phone subscribers in Hanoi accounts for 95% of the total number of subscribers, however, the results of this survey show that the percentage of prepaid subscribers has decreased by more than 20%, only at 70.8%. On the contrary, the number of postpaid subscribers tends to increase from 5% in 2009 to 19.2%. Those who are simultaneously using both types of subscriptions account for 10%. (Table 4.2).
Table 4.2: Types of mobile phone subscribers
Frequency
Ratio (%)
Valid Percentage
Cumulative Percentage
Valid
Prepay
591
70.8
70.8
70.8
Pay later
160
19.2
19.2
89.9
Both of the above
84
10.1
10.1
100.0
Total
835
100.0
100.0
The above figures show the change in the psychology and consumption habits of Vietnamese consumers towards mobile telecommunications services, when the use of prepaid subscriptions and junk SIMs is replaced by the use of two types of subscriptions for different purposes and needs or switching to postpaid subscriptions to enjoy better customer care services.
In addition, the majority of respondents have an average spending level for mobile phone services from 100 to 300 thousand VND (406 ~ 48.6% of total respondents). The high spending level (> 500 thousand VND) is the spending level with the lowest number of people with only 8.4%, on the contrary, the low spending level (under 100 thousand VND) accounts for the second highest proportion among the groups of respondents with 25.4%. People with low spending levels mainly fall into the group of students and retirees/housewives - those who have little need to use or mainly use promotional SIM cards. (Table 4.3).
Table 4.3: Spending on mobile phone charges
Frequency
Ratio (%)
Valid Percentage
Cumulative Percentage
Valid
<100,000
212
25.4
25.4
25.4
100-300,000
406
48.6
48.6
74.0
300,000-500,000
147
17.6
17.6
91.6
>500,000
70
8.4
8.4
100.0
Total
835
100.0
100.0
The statistics in Table 4.3 are similar to the percentages in the NielsenMobile survey results (2009) with 73% of mobile phone users having medium spending levels and only 13% having high spending levels.
The survey results also showed that up to 31% ~ nearly one-third of respondents said they sent more than 10 SMS messages/day, meaning that on average they sent 1 SMS message for every working hour. Those with an average SMS message volume (from 3 to 10 messages/day) accounted for 51.1% and those with a low SMS message volume (less than 3 messages/day) accounted for 17%. (Table 4.4)
Table 4.4: Number of SMS messages sent per day
Frequency
Ratio (%)
Valid Percentage
Cumulative Percentage
Valid
<3 news
142
17.0
17.0
17.0
3-10 news
427
51.1
51.1
68.1
>10 news
266
31.9
31.9
100.0
Total
835
100.0
100.0
Similar to sending messages, those with an average message receiving rate (from 3-10 messages/day) accounted for the highest percentage of ~ 55%, followed by those with a high number of messages (over 10 messages/day) ~ 24% and those with a low number of messages received daily (under 3 messages/day) remained at the bottom with 21%. (Table 4.5)
Table 4.5: Number of SMS messages received per day
Frequency
Ratio (%)
Valid Percentage
Cumulative Percentage
Valid
<3 news
175
21.0
21.0
21.0
3-10 news
436
55.0
55.0
76.0
>10 news
197
24.0
24.0
100.0
Total
835
100.0
100.0
When comparing the data of the two result tables 4.4 and 4.5, we can see the reasonableness between the ratio of the number of messages sent and the number of messages received daily by the interview participants.
4.3 Current status of SMS advertising and Mobile Marketing
According to the interview results, in the 3 months from the time of the survey and before, 94% of respondents, equivalent to 785 people, said they received advertising messages, while only a very small percentage of 6% (only 50 people) did not receive advertising messages (Table 4.6).
Table 4.6: Percentage of people receiving advertising messages in the last 3 months
Frequency
Ratio (%)
Valid Percentage
Cumulative Percentage
Valid
Have
785
94.0
94.0
94.0
Are not
50
6.0
6.0
100.0
Total
835
100.0
100.0
The results of Table 4.6 show that consumers in the inner city of Hanoi are very familiar with advertising messages. This result is also the basis for assessing the knowledge, experience and understanding of the respondents in the interview. This is also one of the important factors determining the accuracy of the survey results.
In addition, most respondents said they had received promotional messages, but only 24% of them had ever taken the action of registering to receive promotional messages, while 76% of the remaining respondents did not register to receive promotional messages but still received promotional messages every day. This is the first sign indicating the weaknesses and shortcomings of lax management of this activity in Vietnam. (Table 4.7)
div.maincontent .s1 { color: black; font-family:Times New Roman, serif; font-style: italic; font-weight: normal; text-decoration: none; font-size: 14pt; } div.maincontent .s2 { color: black; font-family:Times New Roman, serif; font-style: normal; font-weight: bold; text-decoration: none; font-size: 14pt; } div.maincontent .s3 { color: black; font-family:Times New Roman, serif; font-style: normal; font-weight: bold; text-decoration: none; font-size: 14pt; } div.maincontent .p { color: black; font-family:Times New Roman, serif; font-style: normal; font-weight: normal; text-decoration: none; font-size: 14pt; margin:0pt; } div.maincontent p { color: black; font-family:Times New Roman, serif; font-style: normal; font-weight: normal; text-decoration: none; font-size: 14pt; margin:0pt; } div.maincontent .s4 { color: black; font-family:Times New Roman, serif; font-style: normal; font-weight: normal; text-decoration: none; font-size: 9.5pt; vertical-align: 6pt; } div.maincontent .s5 { color: black; font-family:Times New Roman, serif; font-style: normal; font-weight: bold; text-decoration: none; font-size: 14pt; } div.maincontent .s6 { color: black; font-family:Times New Roman, serif; font-style: normal; font-weight: bold; text-decoration: none; font-size: 14pt; } div.maincontent .s7 { color: black; font-family:Times New Roman, serif; font-style: italic; font-weight: normal; text-decoration: none; font-size: 14pt; } div.maincontent .s8 { color: black; font-family:Times New Roman, serif; font-style: italic; font-weight: bold; text-decoration: none; font-size: 14pt; } div.maincontent .s9 { color: black; font-family:Arial, sans-serif; font-style: normal; font-weight: normal; text-decoration: none; font-size: 14pt; } div.maincontent .s10 { color: black; font-family:Arial, sans-serif; font-style: normal; font-weight: normal; text-decoration: none; font-size: 12pt; } div.maincontent .s11 { color: black; font-family:Times New Roman, serif; font-style: normal; font-weight: normal; font-size: 14pt; } div.maincontent .s12 { color: black; font-family:Arial, sans-serif; font-style: normal; font-weight: normal; text-decoration: none; font-size: 14pt; } div.maincontent .s13 { color: black; font-family:Times New Roman, serif; font-style: normal; font-weight: normal; text-decoration: none; font-size: 14pt; } div.maincontent .s14 { color: black; font-family:Times New Roman, serif; font-style: normal; font-weight: bold; text-decoration: none; font-size: 13pt; } div.maincontent .s15 { color: black; font-family:Times New Roman, serif; font-style: italic; font-weight: normal; text-decoration: none; font-size: 9.5pt; vertical-align: 6pt; } div.maincontent .s16 { color: black; font-family:Times New Roman, serif; font-style: normal; font-weight: normal; text-decoration: none; font-size: 5.5pt; vertical-align: 3pt; } div.maincontent .s17 { color: black; font-family:Times New Roman, serif; font-style: normal; font-weight: normal; text-decoration: none; font-size: 8.5pt; } div.maincontent .s18 { color: black; font-family:Times New Roman, serif; font-style: italic; font-weight: bold; font-size: 14pt; } div.maincontent .s19 { color: black; font-family:Times New Roman, serif; font-style: normal; font-weight: bold; font-size: 14pt; } div.maincontent .s20 { color: black; font-family:Times New Roman, serif; font-style: italic; font-weight: normal; text-decoration: none; font-size: 13pt; } div.maincontent .s21 { color: black; font-family:Times New Roman, serif; font-style: normal; font-weight: normal; text-decoration: none; font-size: 14pt; } div.maincontent .s22 { color: black; font-family:Courier New, monospace; font-style: normal; font-weight: normal; text-decoration: none; font-size: 14pt; } div.maincontent .s23 { color: black; font-family:Times New Roman, serif; font-style: normal; font-weight: normal; text-decoration: none; font-size: 13pt; } div.maincontent .s24 { color: black; font-family:Times New Roman, serif; font-style: italic; font-weight: normal; text-decoration: none; font-size: 13pt; } div.maincontent .s25 { color: black; font-family:Times New Roman, serif; font-style: normal; font-weight: bold; text-decoration: none; font-size: 14pt; } div.maincontent .s26 { color: black; font-family:Times New Roman, serif; font-style: normal; font-weight: normal; text-decoration: none; font-size: 14pt; } div.maincontent .s27 { color: black; font-family:Times New Roman, serif; font-style: normal; font-weight: normal; text-decoration: none; font-size: 1.5pt; } div.maincontent .s28 { color: black; font-family:Times New Roman, serif; font-style: normal; font-weight: normal; text-decoration: none; font-size: 11pt; } div.maincontent .s29 { color: black; font-family:Times New Roman, serif; font-style: normal; font-weight: bold; text-decoration: none; font-size: 13pt; } div.maincontent .s30 { color: black; font-family:Times New Roman, serif; font-style: italic; font-weight: bold; text-decoration: none; font-size: 13pt; } div.maincontent .s31 { color: black; font-family:Times New Roman, serif; font-style: normal; font-weight: normal; text-decoration: none; font-size: 13pt; } div.maincontent .s32 { color: black; font-family:Arial, sans-serif; font-style: normal; font-weight: normal; text-decoration: none; font-size: 10.5pt; } div.maincontent .s33 { color: black; font-family:Arial, sans-serif; font-style: normal; font-weight: normal; text-decoration: none; font-size: 11pt; } div.maincontent .s35 { color: black; font-family:Arial, sans-serif; font-style: normal; font-weight: bold; text-decoration: none; font-size: 10.5pt; } div.maincontent .s36 { color: #F00; font-family:Arial, sans-serif; font-style: italic; font-weight: bold; text-decoration: none; font-size: 10.5pt; } div.maincontent .s37 { color: black; font-family:Arial, sans-serif; font-style: normal; font-weight: bold; text-decoration: none; font-size: 10.5pt; } div.maincontent .s38 { color: black; font-family:Times New Roman, serif; font-style: normal; font-weight: bold; text-decoration: none; font-size: 8.5pt; vertical-align: 5pt; } div.maincontent .s39 { color: black; font-family:Arial, sans-serif; font-style: normal; font-weight: normal; text-decoration: none; font-size: 10.5pt; } div.maincontent .s40 { color: black; font-family:Arial, sans-serif; font-style: normal; font-weight: normal; text-decoration: none; font-size: 7pt; vertical-align: 4pt; } div.maincontent .s41 { color: black; font-family:Arial, sans-serif; font-style: normal; font-weight: bold; text-decoration: none; font-size: 10.5pt; } div.maincontent .s42 { color: black; font-family:Arial, sans-serif; font-style: normal; font-weight: bold; text-decoration: none; font-size: 11pt; } div.maincontent .s43 { color: black; font-family:Arial, sans-serif; font-style: normal; font-weight: bold; text-decoration: none; font-size: 7.5pt; vertical-align: 5pt; } div.maincontent .s44 { color: black; font-family:Arial, sans-serif; font-style: normal; font-weight: normal; text-decoration: none; font-size: 7pt; vertical-align: 5pt; } div.maincontent .s45 { color: #F00; font-family:Arial, sans-serif; font-style: normal; font-weight: bold; text-decoration: none; font-size: 10.5pt; } div.maincontent .s46 { color: black; font-family:Arial, sans-serif; font-style: normal; font-weight: bold; text-decoration: none; font-size: 7pt; vertical-align: 5pt; } div.maincontent .s47 { color: black; font-family:Arial, sans-serif; font-style: normal; font-weight: bold; text-decoration: none; font-size: 11pt; } div.maincontent .s48 { color: black; font-family:Times New Roman, serif; font-style: normal; font-weight: normal; text-decoration: none; font-size: 14pt; } div.maincontent .s49 { color: black; font-family:Times New Roman, serif; font-style: italic; font-weight: normal; text-decoration: none; font-size: 9.5pt; vertical-align: -2pt; } div.maincontent .s50 { color: black; font-family:Times New Roman, serif; font-style: normal; font-weight: normal; text-decoration: none; font-size: 9.5pt; } div.maincontent .s51 { color: black; font-family:Times New Roman, serif; font-style: italic; font-weight: normal; text-decoration: none; font-size: 9.5pt; vertical-align: -1pt; } div.maincontent .s52 { color: black; font-family:Times New Roman, serif; font-style: normal; font-weight: normal; text-decoration: none; font-size: 9.5pt; vertical-align: -2pt; } div.maincontent .s53 { color: black; font-family:Times New Roman, serif; font-style: normal; font-weight: normal; text-decoration: none; font-size: 13pt; } div.maincontent .s54 { color: black; font-family:Times New Roman, serif; font-style: normal; font-weight: normal; text-decoration: none; font-size: 9.5pt; vertical-align: -1pt; } div.maincontent .s55 { color: black; font-family:Arial, sans-serif; font-style: normal; font-weight: normal; text-decoration: none; font-size: 10.5pt; } div.maincontent .s56 { color: #00F; font-family:Times New Roman, serif; font-style: normal; font-weight: normal; font-size: 14pt; } div.maincontent .s57 { color: #00F; font-family:Times New Roman, serif; font-style: normal; font-weight: normal; text-decoration: none; font-size: 14pt; } div.maincontent .s58 { color: #00F; font-family:Times New Roman, serif; font-style: normal; font-weight: normal; font-size: 14pt; } div.maincontent .s59 { color: #00F; font-family:Times New Roman, serif; font-style: normal; font-weight: normal; text-decoration: none; font-size: 13pt; } div.maincontent .s60 { color: #00F; font-family:Times New Roman, serif; font-style: normal; font-weight: normal; font-size: 13pt; } div.maincontent .s61 { color: black; font-family:Times New Roman, serif; font-style: normal; font-weight: bold; text-decoration: none; font-size: 14pt; } div.maincontent .s62 { color: black; font-family:Times New Roman, serif; font-style: italic; font-weight: bold; text-decoration: none; font-size: 14pt; } div.maincontent .s63 { color: black; font-family:Times New Roman, serif; font-style: italic; font-weight: bold; text-decoration: none; font-size: 14pt; } div.maincontent .content_head2 { color: #F00; font-family:Times New Roman, serif; font-style: normal; font-weight: bold; text-decoration: none; font-size: 14pt; } div.maincontent .s64 { color: black; font-family:Times New Roman, serif; font-style: italic; font-weight: bold; text-decoration: none; font-size: 13pt; } div.maincontent .s67 { color: black; font-family:Arial, sans-serif; font-style: normal; font-weight: normal; text-decoration: none; font-size: 9.5pt; } div.maincontent .s68 { color: black; font-family:Times New Roman, serif; font-style: normal; font-weight: bold; text-decoration: none; font-size: 12pt; } div.maincontent .s69 { color: black; font-family:Times New Roman, serif; font-style: italic; font-weight: normal; text-decoration: none; font-size: 12pt; } div.maincontent .s70 { color: black; font-family:Times New Roman, serif; font-style: normal; font-weight: normal; tex](data:image/svg+xml,%3Csvg%20xmlns=%22http://www.w3.org/2000/svg%22%20viewBox=%220%200%2075%2075%22%3E%3C/svg%3E) Mobile Phone Usage in Hanoi Inner City Area
zt2i3t4l5ee
zt2a3gsconsumer,consumption,consumer behavior,marketing,mobile marketing
zt2a3ge
zc2o3n4t5e6n7ts
- Test the relationship between demographic variables and consumer behavior for Mobile Marketing activities
The analysis method used is the Chi-square test (χ2), with statistical hypotheses H0 and H1 and significance level α = 0.05. In case the P index (p-value) or Sig. index in SPSS has a value less than or equal to the significance level α, the hypothesis H0 is rejected and vice versa. With this testing procedure, the study can evaluate the difference in behavioral trends between demographic groups.
CHAPTER 4
RESEARCH RESULTS
During two months, 1,100 survey questionnaires were distributed to mobile phone users in the inner city of Hanoi using various methods such as direct interviews, sending via email or using questionnaires designed on the Internet. At the end of the survey, after checking and eliminating erroneous questionnaires, the study collected 858 complete questionnaires, equivalent to a rate of about 78%. In addition, the research subjects of the thesis are only people who are using mobile phones, so people who do not use mobile phones are not within the scope of the thesis, therefore, the questionnaires with the option of not using mobile phones were excluded from the scope of analysis. The number of suitable survey questionnaires included in the statistical analysis was 835.
4.1 Demographic characteristics of the sample
The structure of the survey sample is divided and statistically analyzed according to criteria such as gender, age, occupation, education level and personal income. (Detailed statistical table in Appendix 6)
- Gender structure: Of the 835 completed questionnaires, 49.8% of respondents were male, equivalent to 416 people, and 50.2% were female, equivalent to 419 people. The survey results of the study are completely consistent with the gender ratio in the population structure of Vietnam in general and Hanoi in particular (Male/Female: 49/51).
- Age structure: 36.6% of respondents are <23 years old, equivalent to 306 people. People from 23-34 years old
accounting for the highest proportion: 44.8% equivalent to 374 people, people aged 35-45 and >45 are 70 and 85 people equivalent to 8.4% and 10.2% respectively. Looking at the results of this survey, we can see that the young people - youth account for a large proportion of the total number of people participating in the survey. Meanwhile, the middle-aged people including two age groups of 35 - 45 and >45 have a low rate of participation in the survey. This is completely consistent with the reality when Mobile Marketing is identified as a Marketing service aimed at young people (people under 35 years old).
- Structure by educational level: among 835 valid responses, 541 respondents had university degrees, accounting for the highest proportion of ~ 75%, 102 had secondary school degrees, ~ 13.1%, and 93 had post-graduate degrees, ~ 11.9%.
- Occupational structure: office workers and civil servants are the group with the highest rate of participation with 39.4%, followed by students with 36.6%. Self-employed people account for 12%, retired housewives are 7.8% and other occupational groups account for 4.2%. The survey results show that the student group has the same rate as the group aged <23 at 36.6%. This shows the accuracy of the survey data. In addition, the survey results distributed by occupational criteria have a rate almost similar to the sample division rate in chapter 3. Therefore, it can be concluded that the survey data is suitable for use in analysis activities.
- Income structure: the group with income from 3 to 5 million has the highest rate with 39% of the total number of respondents. This is consistent with the income structure of Hanoi people and corresponds to the average income of the group of civil servants and office workers. Those
People with no income account for 23%, income under 3 million VND accounts for 13% and income over 5 million VND accounts for 25%.
4.2 Mobile phone usage in Hanoi inner city area
According to the survey results, most respondents said they had used the phone for more than 1 year, specifically: 68.4% used mobile phones from 4 to 10 years, 23.2% used from 1 to 3 years, 7.8% used for more than 10 years. Those who used mobile phones for less than 1 year accounted for only a very small proportion of ~ 0.6%. (Table 4.1)
Table 4.1: Time spent using mobile phones
Frequency
Ratio (%)
Valid Percentage
Cumulative Percentage
Alid
<1 year
5
.6
.6
.6
1-3 years
194
23.2
23.2
23.8
4-10 years
571
68.4
68.4
92.2
>10 years
65
7.8
7.8
100.0
Total
835
100.0
100.0
The survey indexes on the time of using mobile phones of consumers in the inner city of Hanoi are very impressive for a developing country like Vietnam and also prove that Vietnamese consumers have a lot of experience using this high-tech device. Moreover, with the majority of consumers surveyed having a relatively long time of use (4-10 years), it partly proves that mobile phones have become an important and essential item in people's daily lives.
When asked about the mobile phone network they are using, 31% of respondents said they are using the network of Vietel company, 29% use the network of
of Mobifone company, 27% use Vinaphone company's network and 13% use networks of other providers such as E-VN telecom, S-fone, Beeline, Vietnammobile. (Figure 4.1).
Figure 4.1: Mobile phone network in use
Compared with the announced market share of mobile telecommunications service providers in Vietnam (Vietel: 36%, Mobifone: 29%, Vinaphone: 28%, the remaining networks: 7%), we see that the survey results do not have many differences. However, the statistics show that there is a difference in the market share of other networks because the Hanoi market is one of the two main markets of small networks, so their market share in this area will certainly be higher than that of the whole country.
According to a report by NielsenMobile (2009) [8], the number of prepaid mobile phone subscribers in Hanoi accounts for 95% of the total number of subscribers, however, the results of this survey show that the percentage of prepaid subscribers has decreased by more than 20%, only at 70.8%. On the contrary, the number of postpaid subscribers tends to increase from 5% in 2009 to 19.2%. Those who are simultaneously using both types of subscriptions account for 10%. (Table 4.2).
Table 4.2: Types of mobile phone subscribers
Frequency
Ratio (%)
Valid Percentage
Cumulative Percentage
Valid
Prepay
591
70.8
70.8
70.8
Pay later
160
19.2
19.2
89.9
Both of the above
84
10.1
10.1
100.0
Total
835
100.0
100.0
The above figures show the change in the psychology and consumption habits of Vietnamese consumers towards mobile telecommunications services, when the use of prepaid subscriptions and junk SIMs is replaced by the use of two types of subscriptions for different purposes and needs or switching to postpaid subscriptions to enjoy better customer care services.
In addition, the majority of respondents have an average spending level for mobile phone services from 100 to 300 thousand VND (406 ~ 48.6% of total respondents). The high spending level (> 500 thousand VND) is the spending level with the lowest number of people with only 8.4%, on the contrary, the low spending level (under 100 thousand VND) accounts for the second highest proportion among the groups of respondents with 25.4%. People with low spending levels mainly fall into the group of students and retirees/housewives - those who have little need to use or mainly use promotional SIM cards. (Table 4.3).
Table 4.3: Spending on mobile phone charges
Frequency
Ratio (%)
Valid Percentage
Cumulative Percentage
Valid
<100,000
212
25.4
25.4
25.4
100-300,000
406
48.6
48.6
74.0
300,000-500,000
147
17.6
17.6
91.6
>500,000
70
8.4
8.4
100.0
Total
835
100.0
100.0
The statistics in Table 4.3 are similar to the percentages in the NielsenMobile survey results (2009) with 73% of mobile phone users having medium spending levels and only 13% having high spending levels.
The survey results also showed that up to 31% ~ nearly one-third of respondents said they sent more than 10 SMS messages/day, meaning that on average they sent 1 SMS message for every working hour. Those with an average SMS message volume (from 3 to 10 messages/day) accounted for 51.1% and those with a low SMS message volume (less than 3 messages/day) accounted for 17%. (Table 4.4)
Table 4.4: Number of SMS messages sent per day
Frequency
Ratio (%)
Valid Percentage
Cumulative Percentage
Valid
<3 news
142
17.0
17.0
17.0
3-10 news
427
51.1
51.1
68.1
>10 news
266
31.9
31.9
100.0
Total
835
100.0
100.0
Similar to sending messages, those with an average message receiving rate (from 3-10 messages/day) accounted for the highest percentage of ~ 55%, followed by those with a high number of messages (over 10 messages/day) ~ 24% and those with a low number of messages received daily (under 3 messages/day) remained at the bottom with 21%. (Table 4.5)
Table 4.5: Number of SMS messages received per day
Frequency
Ratio (%)
Valid Percentage
Cumulative Percentage
Valid
<3 news
175
21.0
21.0
21.0
3-10 news
436
55.0
55.0
76.0
>10 news
197
24.0
24.0
100.0
Total
835
100.0
100.0
When comparing the data of the two result tables 4.4 and 4.5, we can see the reasonableness between the ratio of the number of messages sent and the number of messages received daily by the interview participants.
4.3 Current status of SMS advertising and Mobile Marketing
According to the interview results, in the 3 months from the time of the survey and before, 94% of respondents, equivalent to 785 people, said they received advertising messages, while only a very small percentage of 6% (only 50 people) did not receive advertising messages (Table 4.6).
Table 4.6: Percentage of people receiving advertising messages in the last 3 months
Frequency
Ratio (%)
Valid Percentage
Cumulative Percentage
Valid
Have
785
94.0
94.0
94.0
Are not
50
6.0
6.0
100.0
Total
835
100.0
100.0
The results of Table 4.6 show that consumers in the inner city of Hanoi are very familiar with advertising messages. This result is also the basis for assessing the knowledge, experience and understanding of the respondents in the interview. This is also one of the important factors determining the accuracy of the survey results.
In addition, most respondents said they had received promotional messages, but only 24% of them had ever taken the action of registering to receive promotional messages, while 76% of the remaining respondents did not register to receive promotional messages but still received promotional messages every day. This is the first sign indicating the weaknesses and shortcomings of lax management of this activity in Vietnam. (Table 4.7)
div.maincontent .s1 { color: black; font-family:"Times New Roman", serif; font-style: italic; font-weight: normal; text-decoration: none; font-size: 14pt; } div.maincontent .s2 { color: black; font-family:"Times New Roman", serif; font-style: normal; font-weight: bold; text-decoration: none; font-size: 14pt; } div.maincontent .s3 { color: black; font-family:"Times New Roman", serif; font-style: normal; font-weight: bold; text-decoration: none; font-size: 14pt; } div.maincontent .p { color: black; font-family:"Times New Roman", serif; font-style: normal; font-weight: normal; text-decoration: none; font-size: 14pt; margin:0pt; } div.maincontent p { color: black; font-family:"Times New Roman", serif; font-style: normal; font-weight: normal; text-decoration: none; font-size: 14pt; margin:0pt; } div.maincontent .s4 { color: black; font-family:"Times New Roman", serif; font-style: normal; font-weight: normal; text-decoration: none; font-size: 9.5pt; vertical-align: 6pt; } div.maincontent .s5 { color: black; font-family:"Times New Roman", serif; font-style: normal; font-weight: bold; text-decoration: none; font-size: 14pt; } div.maincontent .s6 { color: black; font-family:"Times New Roman", serif; font-style: normal; font-weight: bold; text-decoration: none; font-size: 14pt; } div.maincontent .s7 { color: black; font-family:"Times New Roman", serif; font-style: italic; font-weight: normal; text-decoration: none; font-size: 14pt; } div.maincontent .s8 { color: black; font-family:"Times New Roman", serif; font-style: italic; font-weight: bold; text-decoration: none; font-size: 14pt; } div.maincontent .s9 { color: black; font-family:Arial, sans-serif; font-style: normal; font-weight: normal; text-decoration: none; font-size: 14pt; } div.maincontent .s10 { color: black; font-family:Arial, sans-serif; font-style: normal; font-weight: normal; text-decoration: none; font-size: 12pt; } div.maincontent .s11 { color: black; font-family:"Times New Roman", serif; font-style: normal; font-weight: normal; font-size: 14pt; } div.maincontent .s12 { color: black; font-family:Arial, sans-serif; font-style: normal; font-weight: normal; text-decoration: none; font-size: 14pt; } div.maincontent .s13 { color: black; font-family:"Times New Roman", serif; font-style: normal; font-weight: normal; text-decoration: none; font-size: 14pt; } div.maincontent .s14 { color: black; font-family:"Times New Roman", serif; font-style: normal; font-weight: bold; text-decoration: none; font-size: 13pt; } div.maincontent .s15 { color: black; font-family:"Times New Roman", serif; font-style: italic; font-weight: normal; text-decoration: none; font-size: 9.5pt; vertical-align: 6pt; } div.maincontent .s16 { color: black; font-family:"Times New Roman", serif; font-style: normal; font-weight: normal; text-decoration: none; font-size: 5.5pt; vertical-align: 3pt; } div.maincontent .s17 { color: black; font-family:"Times New Roman", serif; font-style: normal; font-weight: normal; text-decoration: none; font-size: 8.5pt; } div.maincontent .s18 { color: black; font-family:"Times New Roman", serif; font-style: italic; font-weight: bold; font-size: 14pt; } div.maincontent .s19 { color: black; font-family:"Times New Roman", serif; font-style: normal; font-weight: bold; font-size: 14pt; } div.maincontent .s20 { color: black; font-family:"Times New Roman", serif; font-style: italic; font-weight: normal; text-decoration: none; font-size: 13pt; } div.maincontent .s21 { color: black; font-family:"Times New Roman", serif; font-style: normal; font-weight: normal; text-decoration: none; font-size: 14pt; } div.maincontent .s22 { color: black; font-family:"Courier New", monospace; font-style: normal; font-weight: normal; text-decoration: none; font-size: 14pt; } div.maincontent .s23 { color: black; font-family:"Times New Roman", serif; font-style: normal; font-weight: normal; text-decoration: none; font-size: 13pt; } div.maincontent .s24 { color: black; font-family:"Times New Roman", serif; font-style: italic; font-weight: normal; text-decoration: none; font-size: 13pt; } div.maincontent .s25 { color: black; font-family:"Times New Roman", serif; font-style: normal; font-weight: bold; text-decoration: none; font-size: 14pt; } div.maincontent .s26 { color: black; font-family:"Times New Roman", serif; font-style: normal; font-weight: normal; text-decoration: none; font-size: 14pt; } div.maincontent .s27 { color: black; font-family:"Times New Roman", serif; font-style: normal; font-weight: normal; text-decoration: none; font-size: 1.5pt; } div.maincontent .s28 { color: black; font-family:"Times New Roman", serif; font-style: normal; font-weight: normal; text-decoration: none; font-size: 11pt; } div.maincontent .s29 { color: black; font-family:"Times New Roman", serif; font-style: normal; font-weight: bold; text-decoration: none; font-size: 13pt; } div.maincontent .s30 { color: black; font-family:"Times New Roman", serif; font-style: italic; font-weight: bold; text-decoration: none; font-size: 13pt; } div.maincontent .s31 { color: black; font-family:"Times New Roman", serif; font-style: normal; font-weight: normal; text-decoration: none; font-size: 13pt; } div.maincontent .s32 { color: black; font-family:Arial, sans-serif; font-style: normal; font-weight: normal; text-decoration: none; font-size: 10.5pt; } div.maincontent .s33 { color: black; font-family:Arial, sans-serif; font-style: normal; font-weight: normal; text-decoration: none; font-size: 11pt; } div.maincontent .s35 { color: black; font-family:Arial, sans-serif; font-style: normal; font-weight: bold; text-decoration: none; font-size: 10.5pt; } div.maincontent .s36 { color: #F00; font-family:Arial, sans-serif; font-style: italic; font-weight: bold; text-decoration: none; font-size: 10.5pt; } div.maincontent .s37 { color: black; font-family:Arial, sans-serif; font-style: normal; font-weight: bold; text-decoration: none; font-size: 10.5pt; } div.maincontent .s38 { color: black; font-family:"Times New Roman", serif; font-style: normal; font-weight: bold; text-decoration: none; font-size: 8.5pt; vertical-align: 5pt; } div.maincontent .s39 { color: black; font-family:Arial, sans-serif; font-style: normal; font-weight: normal; text-decoration: none; font-size: 10.5pt; } div.maincontent .s40 { color: black; font-family:Arial, sans-serif; font-style: normal; font-weight: normal; text-decoration: none; font-size: 7pt; vertical-align: 4pt; } div.maincontent .s41 { color: black; font-family:Arial, sans-serif; font-style: normal; font-weight: bold; text-decoration: none; font-size: 10.5pt; } div.maincontent .s42 { color: black; font-family:Arial, sans-serif; font-style: normal; font-weight: bold; text-decoration: none; font-size: 11pt; } div.maincontent .s43 { color: black; font-family:Arial, sans-serif; font-style: normal; font-weight: bold; text-decoration: none; font-size: 7.5pt; vertical-align: 5pt; } div.maincontent .s44 { color: black; font-family:Arial, sans-serif; font-style: normal; font-weight: normal; text-decoration: none; font-size: 7pt; vertical-align: 5pt; } div.maincontent .s45 { color: #F00; font-family:Arial, sans-serif; font-style: normal; font-weight: bold; text-decoration: none; font-size: 10.5pt; } div.maincontent .s46 { color: black; font-family:Arial, sans-serif; font-style: normal; font-weight: bold; text-decoration: none; font-size: 7pt; vertical-align: 5pt; } div.maincontent .s47 { color: black; font-family:Arial, sans-serif; font-style: normal; font-weight: bold; text-decoration: none; font-size: 11pt; } div.maincontent .s48 { color: black; font-family:"Times New Roman", serif; font-style: normal; font-weight: normal; text-decoration: none; font-size: 14pt; } div.maincontent .s49 { color: black; font-family:"Times New Roman", serif; font-style: italic; font-weight: normal; text-decoration: none; font-size: 9.5pt; vertical-align: -2pt; } div.maincontent .s50 { color: black; font-family:"Times New Roman", serif; font-style: normal; font-weight: normal; text-decoration: none; font-size: 9.5pt; } div.maincontent .s51 { color: black; font-family:"Times New Roman", serif; font-style: italic; font-weight: normal; text-decoration: none; font-size: 9.5pt; vertical-align: -1pt; } div.maincontent .s52 { color: black; font-family:"Times New Roman", serif; font-style: normal; font-weight: normal; text-decoration: none; font-size: 9.5pt; vertical-align: -2pt; } div.maincontent .s53 { color: black; font-family:"Times New Roman", serif; font-style: normal; font-weight: normal; text-decoration: none; font-size: 13pt; } div.maincontent .s54 { color: black; font-family:"Times New Roman", serif; font-style: normal; font-weight: normal; text-decoration: none; font-size: 9.5pt; vertical-align: -1pt; } div.maincontent .s55 { color: black; font-family:Arial, sans-serif; font-style: normal; font-weight: normal; text-decoration: none; font-size: 10.5pt; } div.maincontent .s56 { color: #00F; font-family:"Times New Roman", serif; font-style: normal; font-weight: normal; font-size: 14pt; } div.maincontent .s57 { color: #00F; font-family:"Times New Roman", serif; font-style: normal; font-weight: normal; text-decoration: none; font-size: 14pt; } div.maincontent .s58 { color: #00F; font-family:"Times New Roman", serif; font-style: normal; font-weight: normal; font-size: 14pt; } div.maincontent .s59 { color: #00F; font-family:"Times New Roman", serif; font-style: normal; font-weight: normal; text-decoration: none; font-size: 13pt; } div.maincontent .s60 { color: #00F; font-family:"Times New Roman", serif; font-style: normal; font-weight: normal; font-size: 13pt; } div.maincontent .s61 { color: black; font-family:"Times New Roman", serif; font-style: normal; font-weight: bold; text-decoration: none; font-size: 14pt; } div.maincontent .s62 { color: black; font-family:"Times New Roman", serif; font-style: italic; font-weight: bold; text-decoration: none; font-size: 14pt; } div.maincontent .s63 { color: black; font-family:"Times New Roman", serif; font-style: italic; font-weight: bold; text-decoration: none; font-size: 14pt; } div.maincontent .content_head2 { color: #F00; font-family:"Times New Roman", serif; font-style: normal; font-weight: bold; text-decoration: none; font-size: 14pt; } div.maincontent .s64 { color: black; font-family:"Times New Roman", serif; font-style: italic; font-weight: bold; text-decoration: none; font-size: 13pt; } div.maincontent .s67 { color: black; font-family:Arial, sans-serif; font-style: normal; font-weight: normal; text-decoration: none; font-size: 9.5pt; } div.maincontent .s68 { color: black; font-family:"Times New Roman", serif; font-style: normal; font-weight: bold; text-decoration: none; font-size: 12pt; } div.maincontent .s69 { color: black; font-family:"Times New Roman", serif; font-style: italic; font-weight: normal; text-decoration: none; font-size: 12pt; } div.maincontent .s70 { color: black; font-family:"Times New Roman", serif; font-style: normal; font-weight: normal; tex
Mobile Phone Usage in Hanoi Inner City Area
zt2i3t4l5ee
zt2a3gsconsumer,consumption,consumer behavior,marketing,mobile marketing
zt2a3ge
zc2o3n4t5e6n7ts
- Test the relationship between demographic variables and consumer behavior for Mobile Marketing activities
The analysis method used is the Chi-square test (χ2), with statistical hypotheses H0 and H1 and significance level α = 0.05. In case the P index (p-value) or Sig. index in SPSS has a value less than or equal to the significance level α, the hypothesis H0 is rejected and vice versa. With this testing procedure, the study can evaluate the difference in behavioral trends between demographic groups.
CHAPTER 4
RESEARCH RESULTS
During two months, 1,100 survey questionnaires were distributed to mobile phone users in the inner city of Hanoi using various methods such as direct interviews, sending via email or using questionnaires designed on the Internet. At the end of the survey, after checking and eliminating erroneous questionnaires, the study collected 858 complete questionnaires, equivalent to a rate of about 78%. In addition, the research subjects of the thesis are only people who are using mobile phones, so people who do not use mobile phones are not within the scope of the thesis, therefore, the questionnaires with the option of not using mobile phones were excluded from the scope of analysis. The number of suitable survey questionnaires included in the statistical analysis was 835.
4.1 Demographic characteristics of the sample
The structure of the survey sample is divided and statistically analyzed according to criteria such as gender, age, occupation, education level and personal income. (Detailed statistical table in Appendix 6)
- Gender structure: Of the 835 completed questionnaires, 49.8% of respondents were male, equivalent to 416 people, and 50.2% were female, equivalent to 419 people. The survey results of the study are completely consistent with the gender ratio in the population structure of Vietnam in general and Hanoi in particular (Male/Female: 49/51).
- Age structure: 36.6% of respondents are <23 years old, equivalent to 306 people. People from 23-34 years old
accounting for the highest proportion: 44.8% equivalent to 374 people, people aged 35-45 and >45 are 70 and 85 people equivalent to 8.4% and 10.2% respectively. Looking at the results of this survey, we can see that the young people - youth account for a large proportion of the total number of people participating in the survey. Meanwhile, the middle-aged people including two age groups of 35 - 45 and >45 have a low rate of participation in the survey. This is completely consistent with the reality when Mobile Marketing is identified as a Marketing service aimed at young people (people under 35 years old).
- Structure by educational level: among 835 valid responses, 541 respondents had university degrees, accounting for the highest proportion of ~ 75%, 102 had secondary school degrees, ~ 13.1%, and 93 had post-graduate degrees, ~ 11.9%.
- Occupational structure: office workers and civil servants are the group with the highest rate of participation with 39.4%, followed by students with 36.6%. Self-employed people account for 12%, retired housewives are 7.8% and other occupational groups account for 4.2%. The survey results show that the student group has the same rate as the group aged <23 at 36.6%. This shows the accuracy of the survey data. In addition, the survey results distributed by occupational criteria have a rate almost similar to the sample division rate in chapter 3. Therefore, it can be concluded that the survey data is suitable for use in analysis activities.
- Income structure: the group with income from 3 to 5 million has the highest rate with 39% of the total number of respondents. This is consistent with the income structure of Hanoi people and corresponds to the average income of the group of civil servants and office workers. Those
People with no income account for 23%, income under 3 million VND accounts for 13% and income over 5 million VND accounts for 25%.
4.2 Mobile phone usage in Hanoi inner city area
According to the survey results, most respondents said they had used the phone for more than 1 year, specifically: 68.4% used mobile phones from 4 to 10 years, 23.2% used from 1 to 3 years, 7.8% used for more than 10 years. Those who used mobile phones for less than 1 year accounted for only a very small proportion of ~ 0.6%. (Table 4.1)
Table 4.1: Time spent using mobile phones
Frequency
Ratio (%)
Valid Percentage
Cumulative Percentage
Alid
<1 year
5
.6
.6
.6
1-3 years
194
23.2
23.2
23.8
4-10 years
571
68.4
68.4
92.2
>10 years
65
7.8
7.8
100.0
Total
835
100.0
100.0
The survey indexes on the time of using mobile phones of consumers in the inner city of Hanoi are very impressive for a developing country like Vietnam and also prove that Vietnamese consumers have a lot of experience using this high-tech device. Moreover, with the majority of consumers surveyed having a relatively long time of use (4-10 years), it partly proves that mobile phones have become an important and essential item in people's daily lives.
When asked about the mobile phone network they are using, 31% of respondents said they are using the network of Vietel company, 29% use the network of
of Mobifone company, 27% use Vinaphone company's network and 13% use networks of other providers such as E-VN telecom, S-fone, Beeline, Vietnammobile. (Figure 4.1).
Figure 4.1: Mobile phone network in use
Compared with the announced market share of mobile telecommunications service providers in Vietnam (Vietel: 36%, Mobifone: 29%, Vinaphone: 28%, the remaining networks: 7%), we see that the survey results do not have many differences. However, the statistics show that there is a difference in the market share of other networks because the Hanoi market is one of the two main markets of small networks, so their market share in this area will certainly be higher than that of the whole country.
According to a report by NielsenMobile (2009) [8], the number of prepaid mobile phone subscribers in Hanoi accounts for 95% of the total number of subscribers, however, the results of this survey show that the percentage of prepaid subscribers has decreased by more than 20%, only at 70.8%. On the contrary, the number of postpaid subscribers tends to increase from 5% in 2009 to 19.2%. Those who are simultaneously using both types of subscriptions account for 10%. (Table 4.2).
Table 4.2: Types of mobile phone subscribers
Frequency
Ratio (%)
Valid Percentage
Cumulative Percentage
Valid
Prepay
591
70.8
70.8
70.8
Pay later
160
19.2
19.2
89.9
Both of the above
84
10.1
10.1
100.0
Total
835
100.0
100.0
The above figures show the change in the psychology and consumption habits of Vietnamese consumers towards mobile telecommunications services, when the use of prepaid subscriptions and junk SIMs is replaced by the use of two types of subscriptions for different purposes and needs or switching to postpaid subscriptions to enjoy better customer care services.
In addition, the majority of respondents have an average spending level for mobile phone services from 100 to 300 thousand VND (406 ~ 48.6% of total respondents). The high spending level (> 500 thousand VND) is the spending level with the lowest number of people with only 8.4%, on the contrary, the low spending level (under 100 thousand VND) accounts for the second highest proportion among the groups of respondents with 25.4%. People with low spending levels mainly fall into the group of students and retirees/housewives - those who have little need to use or mainly use promotional SIM cards. (Table 4.3).
Table 4.3: Spending on mobile phone charges
Frequency
Ratio (%)
Valid Percentage
Cumulative Percentage
Valid
<100,000
212
25.4
25.4
25.4
100-300,000
406
48.6
48.6
74.0
300,000-500,000
147
17.6
17.6
91.6
>500,000
70
8.4
8.4
100.0
Total
835
100.0
100.0
The statistics in Table 4.3 are similar to the percentages in the NielsenMobile survey results (2009) with 73% of mobile phone users having medium spending levels and only 13% having high spending levels.
The survey results also showed that up to 31% ~ nearly one-third of respondents said they sent more than 10 SMS messages/day, meaning that on average they sent 1 SMS message for every working hour. Those with an average SMS message volume (from 3 to 10 messages/day) accounted for 51.1% and those with a low SMS message volume (less than 3 messages/day) accounted for 17%. (Table 4.4)
Table 4.4: Number of SMS messages sent per day
Frequency
Ratio (%)
Valid Percentage
Cumulative Percentage
Valid
<3 news
142
17.0
17.0
17.0
3-10 news
427
51.1
51.1
68.1
>10 news
266
31.9
31.9
100.0
Total
835
100.0
100.0
Similar to sending messages, those with an average message receiving rate (from 3-10 messages/day) accounted for the highest percentage of ~ 55%, followed by those with a high number of messages (over 10 messages/day) ~ 24% and those with a low number of messages received daily (under 3 messages/day) remained at the bottom with 21%. (Table 4.5)
Table 4.5: Number of SMS messages received per day
Frequency
Ratio (%)
Valid Percentage
Cumulative Percentage
Valid
<3 news
175
21.0
21.0
21.0
3-10 news
436
55.0
55.0
76.0
>10 news
197
24.0
24.0
100.0
Total
835
100.0
100.0
When comparing the data of the two result tables 4.4 and 4.5, we can see the reasonableness between the ratio of the number of messages sent and the number of messages received daily by the interview participants.
4.3 Current status of SMS advertising and Mobile Marketing
According to the interview results, in the 3 months from the time of the survey and before, 94% of respondents, equivalent to 785 people, said they received advertising messages, while only a very small percentage of 6% (only 50 people) did not receive advertising messages (Table 4.6).
Table 4.6: Percentage of people receiving advertising messages in the last 3 months
Frequency
Ratio (%)
Valid Percentage
Cumulative Percentage
Valid
Have
785
94.0
94.0
94.0
Are not
50
6.0
6.0
100.0
Total
835
100.0
100.0
The results of Table 4.6 show that consumers in the inner city of Hanoi are very familiar with advertising messages. This result is also the basis for assessing the knowledge, experience and understanding of the respondents in the interview. This is also one of the important factors determining the accuracy of the survey results.
In addition, most respondents said they had received promotional messages, but only 24% of them had ever taken the action of registering to receive promotional messages, while 76% of the remaining respondents did not register to receive promotional messages but still received promotional messages every day. This is the first sign indicating the weaknesses and shortcomings of lax management of this activity in Vietnam. (Table 4.7)
div.maincontent .s1 { color: black; font-family:"Times New Roman", serif; font-style: italic; font-weight: normal; text-decoration: none; font-size: 14pt; } div.maincontent .s2 { color: black; font-family:"Times New Roman", serif; font-style: normal; font-weight: bold; text-decoration: none; font-size: 14pt; } div.maincontent .s3 { color: black; font-family:"Times New Roman", serif; font-style: normal; font-weight: bold; text-decoration: none; font-size: 14pt; } div.maincontent .p { color: black; font-family:"Times New Roman", serif; font-style: normal; font-weight: normal; text-decoration: none; font-size: 14pt; margin:0pt; } div.maincontent p { color: black; font-family:"Times New Roman", serif; font-style: normal; font-weight: normal; text-decoration: none; font-size: 14pt; margin:0pt; } div.maincontent .s4 { color: black; font-family:"Times New Roman", serif; font-style: normal; font-weight: normal; text-decoration: none; font-size: 9.5pt; vertical-align: 6pt; } div.maincontent .s5 { color: black; font-family:"Times New Roman", serif; font-style: normal; font-weight: bold; text-decoration: none; font-size: 14pt; } div.maincontent .s6 { color: black; font-family:"Times New Roman", serif; font-style: normal; font-weight: bold; text-decoration: none; font-size: 14pt; } div.maincontent .s7 { color: black; font-family:"Times New Roman", serif; font-style: italic; font-weight: normal; text-decoration: none; font-size: 14pt; } div.maincontent .s8 { color: black; font-family:"Times New Roman", serif; font-style: italic; font-weight: bold; text-decoration: none; font-size: 14pt; } div.maincontent .s9 { color: black; font-family:Arial, sans-serif; font-style: normal; font-weight: normal; text-decoration: none; font-size: 14pt; } div.maincontent .s10 { color: black; font-family:Arial, sans-serif; font-style: normal; font-weight: normal; text-decoration: none; font-size: 12pt; } div.maincontent .s11 { color: black; font-family:"Times New Roman", serif; font-style: normal; font-weight: normal; font-size: 14pt; } div.maincontent .s12 { color: black; font-family:Arial, sans-serif; font-style: normal; font-weight: normal; text-decoration: none; font-size: 14pt; } div.maincontent .s13 { color: black; font-family:"Times New Roman", serif; font-style: normal; font-weight: normal; text-decoration: none; font-size: 14pt; } div.maincontent .s14 { color: black; font-family:"Times New Roman", serif; font-style: normal; font-weight: bold; text-decoration: none; font-size: 13pt; } div.maincontent .s15 { color: black; font-family:"Times New Roman", serif; font-style: italic; font-weight: normal; text-decoration: none; font-size: 9.5pt; vertical-align: 6pt; } div.maincontent .s16 { color: black; font-family:"Times New Roman", serif; font-style: normal; font-weight: normal; text-decoration: none; font-size: 5.5pt; vertical-align: 3pt; } div.maincontent .s17 { color: black; font-family:"Times New Roman", serif; font-style: normal; font-weight: normal; text-decoration: none; font-size: 8.5pt; } div.maincontent .s18 { color: black; font-family:"Times New Roman", serif; font-style: italic; font-weight: bold; font-size: 14pt; } div.maincontent .s19 { color: black; font-family:"Times New Roman", serif; font-style: normal; font-weight: bold; font-size: 14pt; } div.maincontent .s20 { color: black; font-family:"Times New Roman", serif; font-style: italic; font-weight: normal; text-decoration: none; font-size: 13pt; } div.maincontent .s21 { color: black; font-family:"Times New Roman", serif; font-style: normal; font-weight: normal; text-decoration: none; font-size: 14pt; } div.maincontent .s22 { color: black; font-family:"Courier New", monospace; font-style: normal; font-weight: normal; text-decoration: none; font-size: 14pt; } div.maincontent .s23 { color: black; font-family:"Times New Roman", serif; font-style: normal; font-weight: normal; text-decoration: none; font-size: 13pt; } div.maincontent .s24 { color: black; font-family:"Times New Roman", serif; font-style: italic; font-weight: normal; text-decoration: none; font-size: 13pt; } div.maincontent .s25 { color: black; font-family:"Times New Roman", serif; font-style: normal; font-weight: bold; text-decoration: none; font-size: 14pt; } div.maincontent .s26 { color: black; font-family:"Times New Roman", serif; font-style: normal; font-weight: normal; text-decoration: none; font-size: 14pt; } div.maincontent .s27 { color: black; font-family:"Times New Roman", serif; font-style: normal; font-weight: normal; text-decoration: none; font-size: 1.5pt; } div.maincontent .s28 { color: black; font-family:"Times New Roman", serif; font-style: normal; font-weight: normal; text-decoration: none; font-size: 11pt; } div.maincontent .s29 { color: black; font-family:"Times New Roman", serif; font-style: normal; font-weight: bold; text-decoration: none; font-size: 13pt; } div.maincontent .s30 { color: black; font-family:"Times New Roman", serif; font-style: italic; font-weight: bold; text-decoration: none; font-size: 13pt; } div.maincontent .s31 { color: black; font-family:"Times New Roman", serif; font-style: normal; font-weight: normal; text-decoration: none; font-size: 13pt; } div.maincontent .s32 { color: black; font-family:Arial, sans-serif; font-style: normal; font-weight: normal; text-decoration: none; font-size: 10.5pt; } div.maincontent .s33 { color: black; font-family:Arial, sans-serif; font-style: normal; font-weight: normal; text-decoration: none; font-size: 11pt; } div.maincontent .s35 { color: black; font-family:Arial, sans-serif; font-style: normal; font-weight: bold; text-decoration: none; font-size: 10.5pt; } div.maincontent .s36 { color: #F00; font-family:Arial, sans-serif; font-style: italic; font-weight: bold; text-decoration: none; font-size: 10.5pt; } div.maincontent .s37 { color: black; font-family:Arial, sans-serif; font-style: normal; font-weight: bold; text-decoration: none; font-size: 10.5pt; } div.maincontent .s38 { color: black; font-family:"Times New Roman", serif; font-style: normal; font-weight: bold; text-decoration: none; font-size: 8.5pt; vertical-align: 5pt; } div.maincontent .s39 { color: black; font-family:Arial, sans-serif; font-style: normal; font-weight: normal; text-decoration: none; font-size: 10.5pt; } div.maincontent .s40 { color: black; font-family:Arial, sans-serif; font-style: normal; font-weight: normal; text-decoration: none; font-size: 7pt; vertical-align: 4pt; } div.maincontent .s41 { color: black; font-family:Arial, sans-serif; font-style: normal; font-weight: bold; text-decoration: none; font-size: 10.5pt; } div.maincontent .s42 { color: black; font-family:Arial, sans-serif; font-style: normal; font-weight: bold; text-decoration: none; font-size: 11pt; } div.maincontent .s43 { color: black; font-family:Arial, sans-serif; font-style: normal; font-weight: bold; text-decoration: none; font-size: 7.5pt; vertical-align: 5pt; } div.maincontent .s44 { color: black; font-family:Arial, sans-serif; font-style: normal; font-weight: normal; text-decoration: none; font-size: 7pt; vertical-align: 5pt; } div.maincontent .s45 { color: #F00; font-family:Arial, sans-serif; font-style: normal; font-weight: bold; text-decoration: none; font-size: 10.5pt; } div.maincontent .s46 { color: black; font-family:Arial, sans-serif; font-style: normal; font-weight: bold; text-decoration: none; font-size: 7pt; vertical-align: 5pt; } div.maincontent .s47 { color: black; font-family:Arial, sans-serif; font-style: normal; font-weight: bold; text-decoration: none; font-size: 11pt; } div.maincontent .s48 { color: black; font-family:"Times New Roman", serif; font-style: normal; font-weight: normal; text-decoration: none; font-size: 14pt; } div.maincontent .s49 { color: black; font-family:"Times New Roman", serif; font-style: italic; font-weight: normal; text-decoration: none; font-size: 9.5pt; vertical-align: -2pt; } div.maincontent .s50 { color: black; font-family:"Times New Roman", serif; font-style: normal; font-weight: normal; text-decoration: none; font-size: 9.5pt; } div.maincontent .s51 { color: black; font-family:"Times New Roman", serif; font-style: italic; font-weight: normal; text-decoration: none; font-size: 9.5pt; vertical-align: -1pt; } div.maincontent .s52 { color: black; font-family:"Times New Roman", serif; font-style: normal; font-weight: normal; text-decoration: none; font-size: 9.5pt; vertical-align: -2pt; } div.maincontent .s53 { color: black; font-family:"Times New Roman", serif; font-style: normal; font-weight: normal; text-decoration: none; font-size: 13pt; } div.maincontent .s54 { color: black; font-family:"Times New Roman", serif; font-style: normal; font-weight: normal; text-decoration: none; font-size: 9.5pt; vertical-align: -1pt; } div.maincontent .s55 { color: black; font-family:Arial, sans-serif; font-style: normal; font-weight: normal; text-decoration: none; font-size: 10.5pt; } div.maincontent .s56 { color: #00F; font-family:"Times New Roman", serif; font-style: normal; font-weight: normal; font-size: 14pt; } div.maincontent .s57 { color: #00F; font-family:"Times New Roman", serif; font-style: normal; font-weight: normal; text-decoration: none; font-size: 14pt; } div.maincontent .s58 { color: #00F; font-family:"Times New Roman", serif; font-style: normal; font-weight: normal; font-size: 14pt; } div.maincontent .s59 { color: #00F; font-family:"Times New Roman", serif; font-style: normal; font-weight: normal; text-decoration: none; font-size: 13pt; } div.maincontent .s60 { color: #00F; font-family:"Times New Roman", serif; font-style: normal; font-weight: normal; font-size: 13pt; } div.maincontent .s61 { color: black; font-family:"Times New Roman", serif; font-style: normal; font-weight: bold; text-decoration: none; font-size: 14pt; } div.maincontent .s62 { color: black; font-family:"Times New Roman", serif; font-style: italic; font-weight: bold; text-decoration: none; font-size: 14pt; } div.maincontent .s63 { color: black; font-family:"Times New Roman", serif; font-style: italic; font-weight: bold; text-decoration: none; font-size: 14pt; } div.maincontent .content_head2 { color: #F00; font-family:"Times New Roman", serif; font-style: normal; font-weight: bold; text-decoration: none; font-size: 14pt; } div.maincontent .s64 { color: black; font-family:"Times New Roman", serif; font-style: italic; font-weight: bold; text-decoration: none; font-size: 13pt; } div.maincontent .s67 { color: black; font-family:Arial, sans-serif; font-style: normal; font-weight: normal; text-decoration: none; font-size: 9.5pt; } div.maincontent .s68 { color: black; font-family:"Times New Roman", serif; font-style: normal; font-weight: bold; text-decoration: none; font-size: 12pt; } div.maincontent .s69 { color: black; font-family:"Times New Roman", serif; font-style: italic; font-weight: normal; text-decoration: none; font-size: 12pt; } div.maincontent .s70 { color: black; font-family:"Times New Roman", serif; font-style: normal; font-weight: normal; tex -
 Studies Testing the Relationship Between Inflation and Economic Growth in Cstt Management
 -
 Relationship Between System Audit Testing and Basic Audit Testing
 -
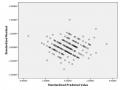 Testing the Linear Relationship Between the Dependent Variable and the Independent Variable.
 -
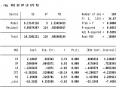 Table of Data Converted to Logarithm Base E

With p = 0.001 < 0.05, the study can reject the hypothesis, meaning that there is a relationship between neurovascular bundle preservation and postoperative erectile dysfunction.
3.5.5. Verifying the relationship between patient age and erectile dysfunction
To test the relationship between patient age and erectile dysfunction, the study performed a chi-square test.
Hypothesize that there is no relationship between patient age and postoperative erectile dysfunction.
Table 3.39. Chi-square test of patient age - erectile dysfunction.
Parameter
Index | Degree of freedom | p-value | |
Chi squared | 1,1321 | 2 | 0.517 |
Difference coefficient | 1,414 | 2 | 0.493 |
Linear relationship between two variables | 1,061 | 1 | 0.303 |
Total | 41 |
In the test, with p = 0.517 > 0.05, the study could not reject the hypothesis, meaning that there was no association between patient age and postoperative erectile dysfunction.
3.5.6. Examination of the association between neurovascular bundle preservation and urinary incontinence
To test the association between neurovascular sparing surgery and urinary incontinence, the chi-square test was performed.
Hypothesize that there is no association between neurovascular preservation and postoperative urinary incontinence.
Table 3.40. Chi-square test for preservation of neurovascular bundles - TKKS.
Parameter
Index | Degree of freedom | p-value | |
Chi squared | 2,687 | 2 | 0.261 |
Difference coefficient | 3,425 | 2 | 0.180 |
Linear relationship between two variables | 2,134 | 1 | 0.144 |
Total | 41 |
With p = 0.261 > 0.05, the study could not reject the hypothesis, meaning there was no association between neurovascular preservation surgery and urinary incontinence.
3.5.7. Verify the relationship between surgical time and blood loss during surgery
To test the relationship between operative time and intraoperative blood loss, the study performed a mean test between operative time and intraoperative blood loss.
The study was divided into two groups: group 1: cases with surgical time ≤ 194.69 minutes (this was the average surgical time of the study), and group 2: cases with surgical time > 194.69 minutes. The mean test was used to test the difference in intraoperative blood loss. The hypothesis was that there was no difference in blood loss between the two groups.
Table 3.41. Relationship between surgical time and blood loss during surgery.
Surgery time (minute) | Number TH | Medium | Deviation standard | |
Blood loss (ml) | ≤ 194.69 | 27 | 312.96 | 185,323 |
> 194.69 | 22 | 581.82 | 377,821 |
Table 3.42. Mean test between operative time - blood loss during surgery.
Leven test | t test | |||||
F | p-value | t | Degree of freedom | p-value | ||
Blood loss (ml) | Relative variance present | 9,231 | 0.004 | -3,253 | 47 | 0.002 |
Zero variance equivalent | -3052 | 29, 136 | 0.005 | |||
With p = 0.002 < 0.005, the study can reject the hypothesis, meaning that there is a relationship between surgical time and intraoperative blood loss.
3.5.8. Verifying the relationship between surgery time and prostate volume
To test the relationship between surgical time and prostate volume, the study performed a mean test between surgical time and prostate volume.
The study was divided into 2 groups: group 1: cases with surgical time ≤ 194.69 minutes (this was the average surgical time of the study), and group 2: cases with surgical time > 194.69 minutes.
Hypothesize that there is no difference in prostate volume between the 2 groups.
Table 3.43. Relationship between surgical time and TTL volume.
Surgery time (minutes) | Number TH | Medium | Standard deviation | |
TTL weight (gr) | ≤ 194.69 | 27 | 31.11 | 6,699 |
> 194.69 | 22 | 40.23 | 16,510 |
Table 3.44. Mean test of surgical time – TTL volume.
Leven test | t test | |||||
F | p-value | t | Degree of freedom | p-value | ||
TTL Weight (gr) | Equivalent variance | 6,889 | 0.012 | -2,621 | 47 | 0.012 |
Non-equivalent variances | -2,432 | 26,625 | 0.022 | |||
With p = 0.012 < 0.05, the study can reject the hypothesis, meaning that there is a relationship between surgical time and TTL volume.
3.5.9. Test the relationship between prostate mass and blood loss during surgery
To test the relationship between prostate volume and intraoperative blood loss, a mean test was performed.
The study was divided into 2 groups: group 1: cases with prostate mass ≤ 40 grams, and group 2: cases with prostate mass > 40 grams [29].
Hypothesize that there is no difference in blood loss between the two groups. Table 3.45. Relationship between TTL volume - blood loss during surgery.
Weight (gr) | Number TH | Medium | Deviation standard | |
Blood loss (ml) | ≤ 40 | 27 | 418.42 | 319,717 |
> 40 | 22 | 486.36 | 307,482 |
Table 3.46. Mean test between TTL volume and blood loss during surgery.
Leven test | t test | |||||
F | p-value | t | Degree of freedom | p-value | ||
Blood loss (ml) | Relative variance present | 0.027 | 0.869 | -626 | 47 | 0.535 |
Zero variance equivalent | -646 | 16,794 | 0.531 | |||
With p = 0.535 > 0.05, the study could not reject the hypothesis, meaning that there is a relationship between prostate mass and blood loss during surgery.
Chapter 4: DISCUSSION
To achieve good results in radical prostatectomy, in addition to the surgeon's experience, patient selection plays an important role. When performing surgery in cases that are too indicated, the results are often not good.
4.1. DISCUSSION ON TREATMENT
4.1.1. Discussion of surgical methods
Although there are many methods of treating localized cancer, surgery is still the treatment method chosen by many doctors. The purpose of radical prostatectomy (open or laparoscopic surgery) is to remove the entire prostate, seminal vesicles, and vas deferens into one block, avoiding missing or dropping cancer cells.
Of the 49 patients who underwent radical prostatectomy in the study, 9/49 underwent radical prostatectomy without pelvic lymphadenectomy. The longest operative time of these cases was 240 minutes (2 cases), the shortest was 120 minutes (1 case). There were 3 cases with operative time of 150 minutes. Because no time was spent on lymphadenectomy, the operative time was shortened, with an average operative time of 179.44 minutes.
± 43.33 minutes.
40/49 cases performed radical prostatectomy with pelvic lymph node dissection. The longest surgery time was 315 minutes (1 case) and the shortest was 120 minutes (2 cases). 9 cases had surgery time > 240 minutes. The average surgery time for laparoscopic surgery with pelvic lymph node dissection was 198.13 ± 46.66 minutes (18.69 minutes longer than surgery without lymph node dissection).
The average blood loss in 9/49 cases of laparoscopic surgery without lymph node dissection was 316.67 ± 222.20 ml. The minimum blood loss was 150 ml (2 cases), the maximum was 700 ml (2 cases). Meanwhile, the average blood loss in laparoscopic surgery with lymph node dissection was 460 ± 328.98 ml (144 ml more than laparoscopic surgery without lymph node dissection). The minimum blood loss in laparoscopic surgery with pelvic lymph node dissection was 100 ml (6 cases) and the maximum was 1500 ml (1 case). The cases with blood loss of 100 ml were cases of small prostates, not much adherent to surrounding tissues, and easy to separate. There were 18 cases of laparoscopic surgery with lymph node dissection requiring blood transfusion during surgery.
In Mariano's study, the average surgical time was 125 minutes, with an average blood loss of 335 ml. According to the author, long surgical time is common when patients have a large prostate mass or when cancer adheres to surrounding tissues. In the author's study, 17.39% of post-operative cancer stage diagnosis was pT3 [58]. The results were similar to those in Guilloneau's study. In 3 years, the author performed radical prostatectomy in 567 cases, of which 80.6% did not perform pelvic lymph node dissection. The average surgical time was 134 minutes, with an average blood loss of 380 ml.
± 195ml, the rate of patients requiring blood transfusion during surgery was 4.9% [39].
In the study, 18/49 cases of retrograde endoscopic prostatectomy and 31/49 cases of antegrade surgery. Radical prostatectomy can be performed retrograde, meaning cutting the urethra first and then going upstream to cut the seminal vesicles and prostate. But it can also be performed antegrade, in which the seminal vesicles and vas deferens are cut first, then the prostate and finally the urethra is cut. In the study, the average time of antegrade surgery was shorter than that of retrograde surgery (188.87 minutes vs. 204.72 minutes). The shortest time of antegrade endoscopic surgery was 120
minutes (1 case) and the longest was 270 minutes (2 cases). The average blood loss during antegrade surgery was less than that during retrograde surgery (391.94 ml compared to 505.56 ml during retrograde cutting). The least amount of blood loss during antegrade cutting was 100 ml (4 cases) and the most was 1200 ml (1 case). After performing retrograde and antegrade cutting, the study found that the venous plexus was the cause of the most bleeding, so when antegrade cutting, the venous plexus and urethra were cut last, the bleeding time would be less, the amount of blood loss would be less than with retrograde cutting.
Another advantage the study found during antegrade resection: the urethra is more clearly dissected, so after prostatectomy, the remaining urethra will be long, making it easier to suture the bladder neck - urethra with continuous sutures [56]. In 18 cases of retrograde resection in the study, after prostatectomy, 8 cases had continuous bladder - urethral sutures. 10 cases had separate sutures. While if antegrade resection, continuous sutures could be used in 29 cases.
In Van Velthoven's study, when performing continuous anastomosis in 122 cases after endoscopic retrograde prostatectomy, the author found that the urethra was clearly dissected, so the bladder neck could be anastomosis.
- urethral suture with continuous sutures, thereby shortening the anastomosis time. The author's anastomosis time was 35 minutes, and no cases of bladder neck stenosis were recorded after surgery [95].
4.1.2. Discussion on lymph node dissection
In the study, lymph node dissection was performed in 40/49 patients (81.6%). In 2 cases, lymph node dissection was not indicated before surgery, but during surgery, unilateral pelvic lymph nodes were observed (1 patient had right lymph nodes and 1 patient had left lymph nodes), so lymph node dissection was performed.