method Preliminary rich | as sulfate (Ba(Ra)SO 4 ) | as lead sulfate ([Pb(Ra)SO 4 ]) | in the form of carbonate (Ca(Ra)CO 3 ) | ||||
Direction separation method | Cation anion exchange | change and | TBP extraction and cation exchange | ||||
Direction | Electricity | stool | Electrolysis | ||||
electromagnetism | in | alcohol | in solution | ||||
stool | propane | ammonium solution | |||||
acetate | |||||||
Current/voltage | 120mA/90- 100V, | 600 mA/ 12 V | |||||
Electrolysis time | 1 hour | 4 hours | |||||
Efficiency cup | 95% | 80% | 80% | ||||
Limit detect | 0.05 mBq/L | 0.02 mBq/L | 0.01 mBq/L | ||||
Accuracy body | Error about 35% | obtain 30- | Error about 25% | obtain 20- | Error reached about 15- 20% | ||
Time | 24 hours (time) | 32 hours | 16 hours | ||||
perform | measurement time) | ||||||
(from the start) | |||||||
split head to | |||||||
end of power | |||||||
feces) | |||||||
02 | Sediment sample | Not yet | |||||
Mass | 0.6 kg | 0.02 kg | |||||
Efficiency cup | 85% | ||||||
Accuracy body | Error reached about 25% | Error reached about 15% | |||||
Limit detect | 0.01 | 0.005 Bq/kg dry | |||||
03 | Biological sample | Not yet | |||||
Mass | 5kg | 2kg | |||||
Maybe you are interested!
-

 Survey Results by Question Content (Based on the Summary Table of Tourist Feedback in the Multiple Choice Questions Section)
 -
 Distribution of Ballots by Survey Subjects in Survey Units
 -
 Distribution of Survey Forms by Type of Pig Farm
 -
 Main Content of the Survey Form and Survey Results
 -
 Content of Implementation of Legal Policy on Management of Education Sector Officials
sea | sample | |||
(algae, | Efficiency cup | 85% | ||
cuttlefish, | ||||
shrimp, | ||||
Accuracy body | Error reached about 30% | Error reached about 15- 20% | ||
clam,...) | ||||
Limit detect | 0.001 Bq/kg I |
3.2. Survey on the distribution of 226 Ra content in environmental objects
sea in experimental areas
3.2.1. Distribution of 226 Ra content in Vinh Hai sea area
Tables 3.10 to 3.14 show the content, average content and content range of 226 Ra in environmental objects in Vinh Hai sea area (Detailed data are shown in Appendix 3).
Table 3.10. Concentration of 226 Ra in water and marine sediments according to collection time
Contribute to Vinh Hai sea area
ST T
Sample collection time | Coordinates (Latitude/Longitude) | Water (mBq/L) | Marine sediments (Bq/kg dry) | |||
Content | Error | Content | Error | |||
01 | 8-9am, 03/02/08 | 11 o 39'50''N/ 109 o 10'40''E | 1.65 | 0.28 | 18.10 | 3.56 |
02 | 8-9am, 05/02/08 | -nt- | 1.68 | 0.31 | 19.70 | 3.82 |
03 | 8-9am, 08/02/08 | -nt- | 1.72 | 0.31 | 17.46 | 3.49 |
04 | 8-9am, 11/02/08 | -nt- | 1.92 | 0.33 | 18.31 | 3.61 |
05 | 8-9am, 03/02/09 | -nt- | 1.71 | 0.32 | 21.34 | 5.12 |
06 | 8-9am, 02/05/09 | -nt- | 1.83 | 0.39 | 19.32 | 3.86 |
07 | 8-9am, 08/02/09 | -nt- | 2.05 | 0.32 | 18.50 | 3.70 |
08 | 8-9am, 11/02/09 | -nt- | 2.36 | 0.37 | 22.51 | 5.24 |
Average value | 1.86 | 0.32 | 19.41 | 4.05 | ||
ST T | Sample collection time | Coordinates (Latitude/Longitude) | Unit of measure | Seaweed | |
Content | Error | ||||
01 | 9-10am, March 2, 2008 | 11 o 39'N/109 o 10'E | Bq/kg fresh | 0.296 | 0.059 |
02 | 9-10am, May 2, 2008 | -nt- | -nt- | 1,382 | 0.276 |
03 | 9-10am, August 2, 2008 | -nt- | -nt- | 0.409 | 0.082 |
04 | 9-10am, March 2, 2009 | -nt- | -nt- | 0.652 | 0.130 |
Average value | 0.685 | 0.137 | |||
Table 3.11. Content of 226 Ra in Mo seaweed according to collection time in Vinh Hai sea area
Table 3.12. The content of 226 Ra in some types of fish according to collection time in
Vinh Hai sea area
ST T
Sample collection time | Coordinates (Latitude/Longitude) | Pompano (Bq/kg fresh) | Anchovies (Bq/kg fresh) | Tuna (Bq/kg fresh) | ||||
Jaw quantity | Wrong number | Jaw quantity | Wrong number | Jaw quantity | Wrong number | |||
01 | 7-9am, 03/02/08 | 11 o 39'N/ 109 o 10'E | 0.051 | 0.011 | ||||
02 | 7-9am, 05/02/08 | -nt- | 0.040 | 0.008 | ||||
03 | 7-9am, 08/02/08 | -nt- | 0.243 | 0.051 | 0.840 | 0.176 | ||
04 | 7-9am, 11/02/08 | -nt- | 0.284 | 0.06 | ||||
05 | 7-9am, 05/02/09 | -nt- | 0.028 | 0.006 | 0.136 | 0.029 | ||
06 | 7-9am, 08/02/09 | -nt- | 0.284 | 0.06 | < 0.001 | |||
07 | 7-9am, 11/02/09 | -nt- | 0.028 | 0.006 | ||||
Average value | 0.173 | 0.04 | 0.840 | 0.176 | 0.076 | 0.015 | ||
Table 3.13. 226 Ra content in Squid according to collection time in Vinh Hai sea area
STT
Sample collection time | Coordinates (Latitude/longitude) | Cuttlefish (Bq/kg fresh) | ||
Content | Error | |||
01 | 7-9am, 03/02/08 | 11 o 39'N/109 o 10'E | 0.123 | 0.036 |
02 | 7-9am, 05/02/08 | -nt- | 0.036 | 0.040 |
03
7-9am, 08/02/08 | -nt- | 0.042 | 0.016 | |
04 | 7-9am, 05/02/09 | -nt- | 0.083 | 0.024 |
05 | 7-9am, 08/02/09 | -nt- | 0.087 | 0.017 |
Average value | 0.074 | 0.027 | ||
Table 3.14. Average content and range of 226 Ra in Vinh sea area
Sea
STT
Sample symbol | Model name | Sample collection coordinates | Unit calculate | Content | |
01 | NVH | Water | Latitude: 11 o 39'50''N Longitude: 109 o 10'40''E | mBq/L | 1.86 0.57 |
1.65 2.36 | |||||
02 | TTVH | Sediment | -nt- | Bq/kg dry | 19.41 4.05 |
17.46 22.51 | |||||
03 | RVH | Seaweed | Latitude: 11 o 39'N Longitude: 109 o 10'E | Bq/kg fresh | 0.685 0.137 |
0.296 1.382 | |||||
04 | CVH | Fish | -nt- | Bq/kg fresh | 0.225 0.047 |
0.028 0.840 | |||||
05 | MVH | Squid | -nt- | Bq/kg fresh | 0.074 0.027 |
0.036 0.123 |
3.2.2. Distribution of 226 Ra content in Phuoc Dinh sea area
Tables 3.15 to 3.19 show the content, average content and range of 226 Ra in environmental objects in Phuoc Dinh sea area (Detailed data are shown in Appendix 3).
Table 3.15. Concentration of 226 Ra in water and marine sediments according to collection time
Contribute to Phuoc Dinh sea area
ST T
Sample collection time | Coordinates (Latitude/Longitude) | Water (mBq/L) | Marine sediments (Bq/kg dry) | |||
Jaw quantity | Error | Jaw quantity | Error | |||
01 | 8-9am, 03/01/08 | 11 o 39'50''N/ | 1.76 | 0.31 | 24.34 | 4.61 |
109 o 10'40''E | ||||||
02 | 8-9am, 01/05/08 | -nt- | 1.85 | 0.35 | 25.29 | 5.49 |
03 | 8-9am, 01/08/08 | -nt- | 1.98 | 0.33 | 26.16 | 7.94 |
04 | 8-9am, 11/01/08 | -nt- | 2.43 | 0.43 | 28.91 | 6.71 |
05 | 8-9am, 03/01/09 | -nt- | 2.05 | 0.31 | 19.01 | 3.38 |
06 | 8-9am, May 1, 2009 | -nt- | 2.38 | 0.41 | 26.66 | 6.21 |
07 | 8-9am, 01/08/09 | -nt- | 2.46 | 0.44 | 28.28 | 6.61 |
08 | 8-9am, 11/01/09 | -nt- | 2.89 | 0.47 | 29.95 | 6.94 |
Average value | 2.01 | 0.41 | 26.07 | 5.99 | ||
Table 3.16. Content of 226 Ra in Mo seaweed according to collection time in Phuoc Dinh sea area
ST
T
Sample collection time | Coordinates (Latitude/Longitude) | Unit of measure | Seaweed | ||
Content | Error | ||||
01 | 9-10am, 3/1/08 | 11 o 25'N/109 o 01'E | Bq/kg fresh | 0.412 | 0.084 |
02 | 9-10am, May 1, 2008 | -nt- | -nt- | 0.547 | 0.115 |
03 | 9-10am, 8/1/08 | -nt- | -nt- | 1,184 | 0.257 |
04 | 9-10am, 3/1/09 | -nt- | -nt- | 0.463 | 0.093 |
05 | 9-10am, May 1, 2009 | -nt- | -nt- | 0.735 | 0.147 |
06 | 9-10am, 11/1/09 | -nt- | -nt- | 1,348 | 0.282 |
Average value | 0.782 | 0.163 | |||
Table 3.17a. The content of 226 Ra in some fish species according to collection time in
Phuoc Dinh sea area
ST T
Sample collection time | Coordinates (Latitude/longitude) | Pompano (Bq/kg fresh) | Anchovies (Bq/kg fresh) | Tuna (Bq/kg fresh) | ||||
Jaw quantity | Wrong number | Jaw quantity | Wrong number | Jaw quantity | Wrong number | |||
01 | 7-9am, 03/01/08 | 11 o 25'N/ 109 o 01'E | 0.010 | 0.002 | ||||
02 | 7-9am, May 1, 2008 | -nt- | 0.474 | 0.104 | 0.095 | 0.021 | ||
03 | 7-9am, 08/01/08 | -nt- | 0.835 | 0.206 | ||||
04 | 7-9am, 03/01/09 | -nt- | 0.093 | 0.020 | ||||
05
7-9am, May 1, 2009 | -nt- | 0.241 | 0.053 | |||||
06 | 7-9am, 01/08/09 | -nt- | 0.615 | 0.140 | 0.103 | 0.023 | ||
Average value | 0.545 | 0.109 | 0.835 | 0.206 | 0.108 | 0.022 | ||
Table 3.17b. The content of 226 Ra in some fish species according to collection time in
Phuoc Dinh sea area
ST T
Sample collection time | Coordinates (Latitude/longitude) | Mackerel (Bq/kg fresh) | Sardines (Bq/kg fresh) | Silver Pomfret (Bq/kg fresh) | ||||
Jaw quantity | Wrong number | Jaw quantity | Wrong number | Jaw quantity | Wrong number | |||
01 | 7-9am, 03/01/08 | 11 o 25'N/ 109 o 01'E | 0.014 | 0.003 | 0.091 | 0.020 | ||
02 | 7-9am, 03/01/09 | -nt- | 0.124 | 0.027 | ||||
03 | 7-9am, 01/08/09 | -nt- | 0.150 | 0.033 | ||||
04 | 7-9am, 11/01/09 | -nt- | 0.535 | 0.129 | ||||
Average value | 0.014 | 0.003 | 0.122 | 0.024 | 0.535 | 0.129 | ||
Table 3.18. Content of 226 Ra in some other seafood over time
collected in Phuoc Dinh sea area
ST T
Sample collection time | Coordinates (Latitude/Longitude) | Cuttlefish (Bq/kg fresh) | Shrimp (Bq/kg fresh) | Clam (Bq/kg fresh) | ||||
Jaw quantity | Wrong number | Jaw quantity | Wrong number | Jaw quantity | Wrong number | |||
01 | 7-9am, 03/02/08 | 11 o 25'N/ 109 o 01'E | 0.041 | 0.008 | 0.618 | 0.155 | ||
02 | 7-9am, 05/02/08 | -nt- | 0.052 | 0.014 | 0.091 | 0.015 | ||
03 | 7-9am, 08/02/08 | -nt- | 0.114 | 0.018 | 0.117 | 0.027 | 0.706 | 0.164 |
04 | 7-9am, 11/02/08 | -nt- | 0.110 | 0.030 | 0.142 | 0.031 | 0.652 | 0.16 |
05 | 7-9am, 03/02/09 | -nt- | 0.027 | 0.06 | 0.235 | 0.045 | ||
06 | 7-9am, 05/02/09 | -nt- | 0.035 | 0.007 | 0.205 | 0.035 | ||
07 | 7-9am, 08/02/09 | -nt- | 0.277 | 0.055 | ||||
08 | 7-9am, 11/02/09 | -nt- | 0.215 | 0.041 | ||||
Average value | 0.063 | 0.023 | 0.183 | 0.036 | 0.652 | 0.160 | ||
Table 3.19. Average content and range of 226 Ra in Phuoc Dinh sea area
STT
Sample symbol | Model name | Sample collection coordinates | Unit calculate | Content | |
01 | NPD | Water | Latitude: 11 o 25'40''N Longitude: 109 o 01'50''E | mBq/L | 2.01 0.66 |
1.76 2.89 | |||||
02 | TTPD | Sediment | -nt- | Bq/kg dry | 26.07 ± 5.99 |
19.01 29.95 | |||||
03 | RPD | Seaweed | Latitude: 11 o 25'N Longitude: 109 o 01'E | Bq/kg fresh | 0.782 0.163 |
0.412 1.348 | |||||
04 | CPD | Fish | -nt- | Bq/kg fresh | 0.252 ± 0.058 |
0.093 0.835 | |||||
05 | MPD | Squid | -nt- | Bq/kg fresh | 0.063 0.023 |
0.027 0.114 | |||||
06 | TPD | Shrimp | -nt- | Bq/kg fresh | 0.183 0.036 |
0.091 0.277 | |||||
07 | SPD | Clam | -nt- | Bq/kg fresh | 0.659 0.160 |
0.618 0.706 |
Table 3.20 presents the distribution of the content of the natural radioactive isotope 226 Ra in the marine environmental objects of Vinh Hai and Phuoc Dinh; and is compared with similar data of other authors in the country and in the Asia-Pacific region. Figures 3.27a and 3.27b. show the distribution of the content of 226 Ra in the marine environmental objects of Vinh Hai and Phuoc Dinh.
compared to other regions of Vietnam and the Asia-Pacific region. Table 3.21a and Figure 3.28a present the bioaccumulation coefficient of 226 Ra in marine organisms in Ninh Thuan. Table 3.21b and Figure 3.28b present the bioaccumulation coefficient of 226 Ra in various types of seaweed in Ninh Thuan. These data are suitable to contribute to the national and regional baseline data set, serving as the basis for assessments.
their next entry price.
Table 3.20. Average values and range of 226 Ra content in marine environmental objects of Vinh Hai and Phuoc Dinh, and compared with similar data of other authors in the country and Asia-Pacific region
Sample
Unit | Average value and range of content | ||||
Vietnam Sea | Asia-Pacific Sea [24], [34], [53] | ||||
Vinh Hai | Phuoc Dinh | Other regions of Vietnam [2], [9], [10] | |||
Water | mBq/L | 1.86 0.57 | 2.01 0.66 | 2.05 0.62 | |
1.65 2.36 | 1.76 2.89 | 1.72 2.90 | 0.03 1260 | ||
Sediment | Bq/kg dry | 19.41 4.05 | 26.07 ± 5.99 | 29.41 ± 4.90 | 24.98 ± 2.97 |
17.46 22.51 | 19.01 29.95 | 23.07 40.21 | 7.22 103.80 | ||
Algae | Bq/kg fresh | 0.685 0.137 | 0.782 0.163 | 0.934 0.217 | 0.7 0.2 |
0.296 1.382 | 0.412 1.348 | 0.283 4.735 | 0.5 1.2 | ||
Fish of all kinds | Bq/kg fresh | 0.225 0.047 | 0.252 ± 0.058 | 0.274 0.082 | 0.38 0.11 |
0.028 0.840 | 0.093 0.835 | 0.073 0.648 | 0.12 0.56 | ||
Squid | Bq/kg fresh | 0.074 0.027 | 0.063 0.023 | 0.025 0.006 | 0.11 ± 0.01 |
0.036 0.123 | 0.027 0.114 | 0.010 0.049 | 0.07 0.14 | ||
Shrimp | Bq/kg fresh | 0.183 0.036 | 0.137 0.030 | 0.21 0.06 | |
0.091 0.277 | 0.053 0.252 | 0.01 1.66 | |||
Clam | Bq/kg fresh | 0.659 0.160 | 0.674 0.135 | 0.8 0.25 | |
0.618 0.706 | 0.139 1.493 | 0.58 4.20 | |||

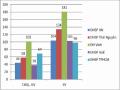
Figure 3.26. Fluctuations in 226 Ra content in water and marine sediments in Vinh Hai and Phuoc Dinh areas.