cateniannulata CPA14V yielded 7.9g of total dichloromethane extract ( CD ) with an extraction efficiency of 31.6% of dry biomass. The total dichloromethane extract ( CD) was extracted in layers with n -hexane. After removing the solvent, 3.0g of n- hexane extract ( CCH ) and 4.8g of dichloromethane extract ( CCD ) were obtained . The extraction efficiency of CCD fraction reached 60.8% of CD mass, equivalent to 19.2% of fungal biomass.
- Results of isolation of substances from dichloromethane extract ( CCD ) by column chromatography
Isolation of 4.8g of dichloromethane extract ( CCD) was performed by chromatography through silica gel column. The result was 3 main fractions ( CCD1-CCD3) . Thin layer chromatography determined that fraction CCD2 contained COD. The solvent was removed to obtain 1.6g of fraction CCD2 containing COD, the yield was 33.3% of CCD mass equivalent to 6.4% of fungal biomass.
Separating 1.6g of CCD2 fraction on a RP - 18 reversed phase column with the solvent system MeOH:H 2 O (3:7) resulted in 3 small fractions ( CCD2.1 - CCD2.3 ). Thin layer chromatography determined that fraction CCD2.1 contained the active ingredient COD. Clearing the solvent yielded 0.5g of fraction CCD2.1 , with a yield of 31.3% of CCD2 mass, equivalent to 2% of fungal biomass.
Maybe you are interested!
-

 Initial Research Model on Factors Affecting the Internal Control System on Social Insurance Collection
 -
 Factors affecting the effectiveness of internal control system in social insurance collection at Binh Duong Provincial Social Insurance - 19
 -
 Factors Affecting the Management of Compulsory Social Insurance Collection
 -
 Factors affecting the effectiveness of internal control system in social insurance collection at Binh Duong Provincial Social Insurance - 18
 -
 Building a Research Model on Factors Affecting the Effectiveness of Internal Control System in Social Insurance Collection
Fraction CCD2.1 (0.5g) was re-purified through sephadex LH20 column with MeOH elution solvent to obtain 2 small fractions ( CCD2.1.a - CCD2.1c ). Thin layer chromatography determined that fraction CCD2.1b contained COD active ingredient.
Recrystallization of CCD2.1b fraction in acetone solvent yielded compound CC1 (white powder, R f = 0.38 (solvent system CH 2 Cl 2 : MeOH = 20:1), mass 93.8 mg), purity 98.1% by HPLC. Yield 0.375% of freeze-dried mushroom biomass.
Fresh C. cateniannulata mushrooms
Wash, freeze dry
Dried C. cateniannulata mushroom
1. Extraction with CH 2 Cl 2 (2 liters x 3)
2. Distill the solvent under low pressure
Dichloromethane extract
1. Add water (0.05 liters)
2. Extract successively with n -hexane (0.3 liters x 3),
3. Distill the solvent under low pressure
n-hexane extract
Dichloromethane extract
Silica gel Gradient CH 2 Cl 2 :MeOH (99:1→20:1) Check the fractions by thin film chromatography
COD-containing fraction after silica gel column chromatography
RP-18, MeOH−H 2 O (3:7)
Examination of fractions by thin film chromatography
COD containing fraction after RP-18 reverse phase column separation
Sephadex LH20, MeOH Fraction testing
COD-containing fraction after purification via sephadex column
Acetone crystallization
COD cleaner
Figure 3.35. Laboratory scale COD collection process (CC1)
From the above results, we propose a process for collecting COD from fungal biomass at laboratory scale, the process is described in Figure 3.35.
3.5.1.2. Some factors affecting the collection of cyclooligomer depsipeptide
- Effect of solvent on COD content (CC1)
The influence of extraction solvent on the extraction of COD ( CC1 ) from the total extract was investigated. The results presented in Figure 3.36 show the difference when changing the extraction solvents. Using dichloromethane (D) solvent, the CC1 content obtained was 0.376% and decreased significantly when extracted with the following solvents: ethyl acetate (E), ethanol (M) and n -hexane (H).
The above results also show that using dichloromethane, the CC1 content obtained is the most efficient. Therefore, we chose dichloromethane for the next research processes in the technological process of extracting active ingredient CC1 using organic solvent method.
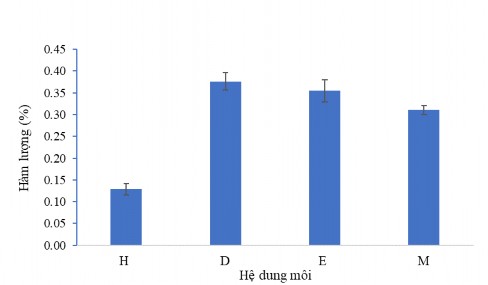
Figure 3.36. Effect of extraction solvent on CC1 content
- Effect of extraction temperature on COD content (CC1)
The investigation of the effect of temperature on the CC1 extraction process has obtained the results shown in Figure 3.37. This result shows that at high temperature, high CC1 active ingredient content is obtained . As the temperature increases, the CC1 active ingredient content gradually increases. For convenience in the following experiments, the sample extraction temperature is around 50 o C.
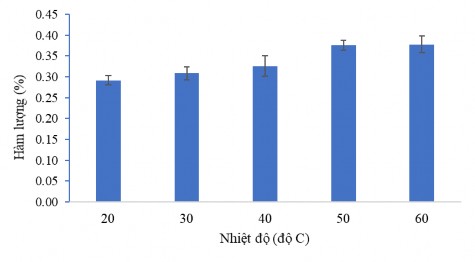
Figure 3.37. Effect of temperature on CC1 content
- Effect of extraction time on COD content (CC1)
The results of CC1 active ingredient content collection at different time periods also have different variations. The longer the sample processing and extraction process, the more active ingredients are obtained, however, this time period is limited, after that time the content of the substances obtained does not change. Figure 3.38 below clearly shows this variation. From these results, we chose the ultrasonic extraction time of 2 hours for the CC1 active ingredient extraction technology process.
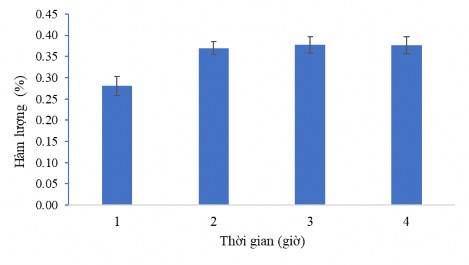
Figure 3.38. Effect of ultrasonic time on CC1 content
The study of COD extraction and purification from C. cateniannulata CPA14V strain showed that the suitable extraction solvent sequence was dichloromethane, water, n-hexane and combined with thin layer chromatography system, normal column chromatography with silicagel, reversed phase chromatography with YMC RP 18 and molecular ray chromatography with sephadex LH-20 stationary phase and crystallization with acetone for high yield (0.37% CDW) and beauvericin purity (98.1%). The best extraction and purification efficiency was obtained under the condition of ultrasonication of biomass with dichloromethane for 2 hours, at a temperature of 50 o C. The research results obtained on the ability to synthesize, recover, purify and activity
of COD compound from C. cateniannulata CPA14V strain shows the potential for research and application of this compound in Vietnam.
3.5.2. Determination of the chemical structure of the cyclooligomer depsipeptide
3.5.2.1. LC/MS Q-TOF spectral measurement results
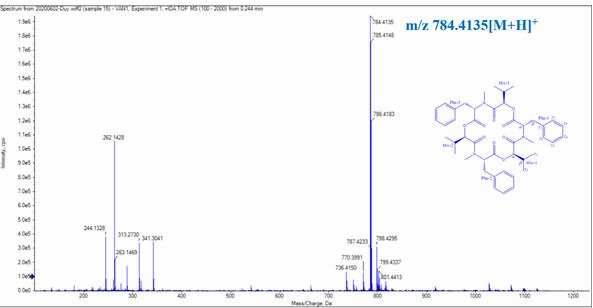
Figure 3.39. LC/MS Q-TOF spectrum of CC1
Compound CC1 was obtained as a white powder. The LC/MS Q-TOF spectrum gave m/z 784.4135 [M + H]+ corresponding to the molecular formula C 45 H 57 N 3 O 9 (Figure 3.40)
P tiger 1 H-NMR
The 1 H-NMR spectrum showed that the molecule of CC1 had 3 methyls at 𝛿 H 0.88 (3H, d, J = 6.5 Hz, H γ 1 -Hiv), 0.29 (3H, d, J = 7.0 Hz, H γ 2 -Hiv) and 3.16 (3H, s,
NC H 3 ); 1 methylene group at 𝛿 H 3.40 (1H, dd, J = 4.5 and 14.5 Hz, H β1 -Phe) and 3.05 (1H, m, H β2 -Phe); 3 methine groups at 𝛿 H 1.84 (1H, m, H β -Hiv), 4.88 (1H, d, J = 9.0 Hz, H α -Hiv), and 5.83 (1H, dd, J = 4.5 and 12.5 Hz, H α -Phe); and benzene ring protons at 𝛿 H 7.19-7.27 (5H, m, H γ 2,3,4,5,6 -Phe) (Figure 3.40)
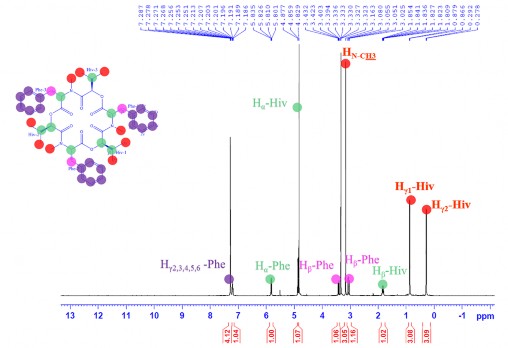
Figure 3.40. 1 H-NMR spectrum of CC1
13C-NMR, DEPT and HSQC spectra
The 13 C-NMR spectrum combined with the DEPT and HSQC spectra of CC1 showed signals of 15 carbons, including 2 carbonyl groups at 𝛿 C 173.0 (CO-Phe) and 170.9 (CO-Hiv); 3 metine groups at 𝛿 C 31.2 (C β -Hiv), 57.8 (C α -Phe) and 77.2 (C α -Hiv); 1 methylene group at 𝛿 C 35.5 (C β -Phe), 3 methyl groups at 𝛿 C 17.2 (C γ 1 -Hiv), 18.3 (C γ 2 -Hiv) and 32.2 (NC H 3 ) and benzene ring carbons at 𝛿 C 127.9- 129.8 (C γ 2,3,4,5,6 -Phe) (Figure 3.41). Analysis of NMR spectral data combined with mass spectra showed that compound CC1 consisted of three identical groups with each group having 15 carbon atoms.
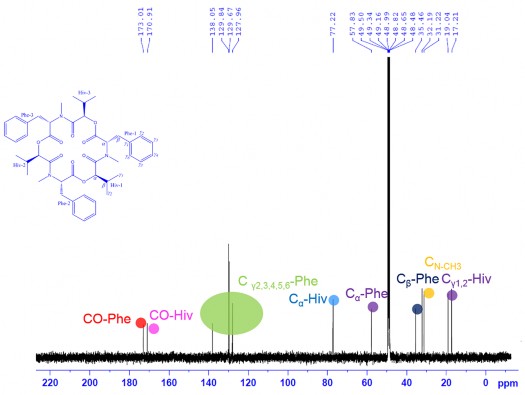
13 C-NMR spectrum of CC1
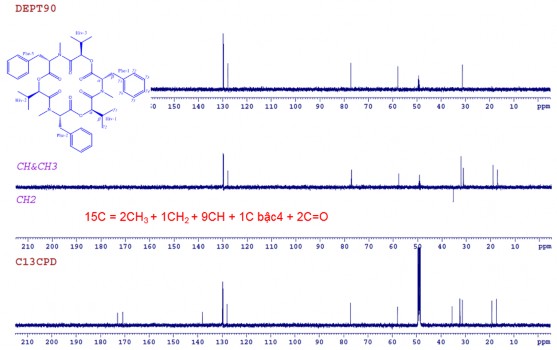
DEPT spectrum of CC1
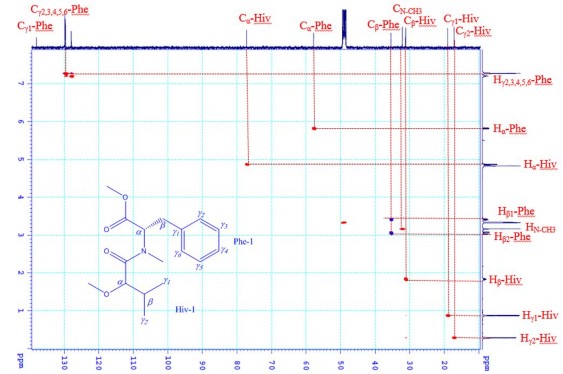
HSQC spectrum of CC1
Figure 3.41. 13 C-NMR spectrum , DEPT spectrum, HSQC spectrum of CC1
COSY spectrum, NOESY spectrum and HMBC spectrum
The 1 H- 1 H COSY and 13 C- 1 H HMBC interactions of CC1 are shown in Figure 3.42, Figure 3.43. In the 1 H- 1 H COSY spectrum of CC1 , the interactions of H β -Hiv with H γ 1 -Hiv, H γ 2 -Hiv and H α -Hiv and of the benzene ring protons H γ 2,3,4,5,6 -Phe are observed. The HMBC spectrum of CC1 shows the interactions of H β - Hiv ( δ H 1.84), H γ 1 -Hiv ( δ H 0.88), H γ 2 -Hiv ( δ H 0.29), H α -Hiv ( δ H 4.88) with C β -
Hiv ( δ C 31.2), C γ 1 -Hiv ( δ C 17.2), C γ 2 -Hiv ( δ C 18.3) and C α -Hiv ( δ C 77.2) respectively; interactions of H α -Phe ( δ H 5.83) with C O-Phe ( δ C 170.9), N- CH 3 -Phe ( δ C 32.2) and C β -Phe ( δ C 35.5) ; Interactions of H β -Phe ( δ H 3.05 and 3.40) with C O-Phe ( δ C 170.9), C α -Phe ( δ C 57.8), C γ 1 -Phe ( δ C 138.1), C γ 2 -Phe ( δ C 129.8) and C γ 6 -
Phe ( δ C 129.8).