The KMO test result gives a value of 0.565 which is within the allowable range. In addition, the Bartlett test gives a significance level of less than 0.05, so the results obtained in factor analysis can be used.
Table 10. EFA rotated factor matrix of dependent variable
Ingredient | |||||||||||
1 | |||||||||||
I will introduce you Agribank Phu Vang | raft, | People | close | history | use | pandemic | service | money | send | belong to | 0.876 |
I will increase my deposit at Agribank Phu Vang | 0.843 | ||||||||||
I will continue to use deposit services at Agribank Phu Vang in the future. next time | 0.749 | ||||||||||
Maybe you are interested!
-
 Summary of Dependent Variable Efa Analysis
 -
 EFA Analysis Results for Dependent Variable Group (Preliminary Quantitative Research Phase)
 -
 Reliability Testing of Dependent Variable Scale
 -
 Perform Factor Analysis (Efa) for Independent Variables
 -
 Summary Table of Exploratory Factor Analysis Results Efa

(SPSS processing source)
The results show that after rotating the factor matrix of the dependent variable, no variable was eliminated. The extracted variance value was 67.925, satisfying the requirements of factor analysis. This number indicates that these variables explain 67.925% of the variation of the dependent variables.
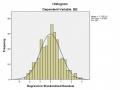
2.2.3.3. Testing the reliability of the scale
Cronbach's Alpha coefficient is a statistical test used to check the consistency and correlation between observed variables. Cronbach's alpha coefficient is used first to eliminate inappropriate variables. Cronbach's alpha from 0.8 to 1 is a good measurement scale, from 0.7 to 0.8 is a usable measurement scale. In case the concept being studied is new, or new to the respondents, Cronbach's alpha coefficient greater than 0.6 can be accepted.
Results of Cronbach's Alpha reliability coefficient analysis for the scale of factors affecting the choice of deposit services of individual customers at the Phu Vang District Branch of the State Bank of Vietnam.
Table 11. Cronbach Alpha of scale groups
Observation variable
Correlate total variable | Cronbach's Alpha if excluded variable | ||
STT | Group 1 | Cronbach's Alpha = 0.929 | |
1 | Agribank banking system has transaction points Widespread, convenient for travel | 0.621 | 0.928 |
2 | Transaction space of Agribank Phu Vang comfortable | 0.803 | 0.917 |
3 | Facilities and means of transaction Agribank Phu Vang is good and modern | 0.676 | 0.924 |
4 | The transaction process is simple and fast, convenient | 0.681 | 0.924 |
5 | Reasonable transaction costs | 0.727 | 0.921 |
6 | Transactions are executed accurately | 0.832 | 0.915 |
7 | I can easily find information about Agribank Phu Vang's deposit services on various media. media | 0.764 | 0.919 |
8 | Agribank Phu Vang's deposit service is suitable with demand | 0.744 | 0.921 |
9 | Agribank Phu Vang's deposit services have many advantages. A variety of terms makes it easy for me to choose | 0.815 | 0.916 |
Group 2 | Cronbach's Alpha = 0.906 | ||
10 | Agribank is a long-standing bank. | 0.845 | 0.868 |
11 | Agribank's reputation makes me feel secure when depositing money. | 0.770 | 0.884 |
12 | Agribank Phu Vang secures customer information well. row | 0.692 | 0.904 |
13 | Agribank Phu Vang resolves complaints quick | 0.805 | 0.876 |
14 | Agribank Phu Vang fulfills its commitment to client | 0.749 | 0.888 |
Group 3 | Cronbach's Alpha = 0.844 | ||
14 | My family members wish I deposit money at Agribank Phu Vang | 0.683 | 0.808 |
15 | My friends and colleagues advised me to deposit money. | 0.738 | 0.755 |
at Agribank Phu Vang | |||
16 | Consultant of Agribank Phu Vang recommend me to deposit here | 0.709 | 0.784 |
Group 4 | Cronbach's Alpha = 0.789 | ||
17 | Agribank Phu Vang staff are very enthusiastic. goodwill, politeness | 0.611 | 0.735 |
18 | Agribank Phu Vang staff do a good job of consulting. question and answer fully and clearly | 0.680 | 0.658 |
19 | Agribank Phu Vang staff have style very professional work | 0.604 | 0.741 |
Group 5 | Cronbach's Alpha = 0.854 | ||
20 | Agribank Phu Vang has a care program customers on important holidays | 0.708 | 0.825 |
21 | Agribank Phu Vang has many programs attractive promotion | 0.767 | 0.772 |
22 | Agribank Phu Vang has many incentives for customers. row | 0.777 | 0.787 |
Group 6 | Cronbach's Alpha = 0.785 | ||
23 | Agribank Phu Vang's deposit interest rate is very high. reasonable, optimal to create effective profitability | 0.694 | 0.681 |
24 | Agribank Phu Vang's deposit interest rate is very high. stable | 0.716 | 0.666 |
25 | Agribank Phu Vang pays deposit interest on time | 0.291 | 0.880 |
26 | The way Agribank Phu Vang calculates deposit interest is very simple. clear, precise | 0.728 | 0.660 |
Group 7 | Cronbach's Alpha = 0.756 | ||
27 | I will continue to use the deposit service at Agribank Phu Vang in the coming time | 0.499 | 0.782 |
28 | I will increase my deposit at Agribank Phu Echoing | 0.638 | 0.611 |
29 | I will introduce my friends and relatives to use the service. Agribank Phu Vang deposit service | 0.686 | 0.555 |
(SPSS processing source)
Comment : The results of the scale analysis of all 7 groups presented in Table 16 show that the Cronbach' Alpha coefficient of these scales is relatively high (> 0.7) and most of the variables have a total variable correlation coefficient greater than 0.3. Only the variable "Agribank Phu Vang pays interest on deposits on time" has a total variable correlation coefficient of 0.291 <0.3, so this variable is
type. So there are 29 variables of these scales that are acceptable and can be used to analyze the factors affecting the choice of deposit services of individual customers at the Phu Vang District Branch of the State Bank of Vietnam.
2.2.3.4. Naming the factors
to sue
After testing the reliability of the scale, new factor groups were formed and named as follows:
Table 12. Naming the characters
STT
Observation variable | Name factor | |
1 | Agribank banking system has widespread transaction points, convenient for travel | Convenience factor profit (X1) |
Agribank Phu Vang transaction space is comfortable and pleasant | ||
Facilities and means of transaction of Agribank Phu Vang good, modern | ||
Simple, fast and convenient transaction process | ||
Reasonable transaction costs | ||
Transactions are executed accurately | ||
I can easily find information about Agribank's deposit services. Phu Vang in the media | ||
Agribank Phu Vang's deposit services are suitable for your needs. | ||
Agribank Phu Vang's deposit service has many flexible terms. Rich helps me choose easily | ||
2 | Agribank is a long-standing bank. | Brand Reputation Factor (X2) |
Agribank's reputation makes me feel secure when depositing money. | ||
Agribank Phu Vang secures customer information well | ||
Agribank Phu Vang resolves complaints quickly | ||
Agribank Phu Vang fulfills its commitment to customers | ||
3 | My family members want me to deposit money at Agribank Phu Vang | Role photo person |
My friends and colleagues advised me to deposit money at Agribank Phu Echoing | enjoy (X3) | |
Agribank Phu Vang's consultant encouraged me to deposit here | ||
4 | Agribank Phu Vang staff are very enthusiastic, friendly and polite. | Employee factor (X4) |
Agribank Phu Vang staff do a good job of consulting and answering questions. full and clear | ||
Agribank Phu Vang staff have a very professional working style. career | ||
5 | Agribank Phu Vang has a customer care program. important occasions | Promotion program (X5) |
Agribank Phu Vang has many attractive promotions | ||
Agribank Phu Vang has many incentives for customers | ||
6 | Agribank Phu Vang's deposit interest rates are very reasonable and optimal. create effective profitability | Interest Factor (X6) |
Agribank Phu Vang's deposit interest rates are very stable. | ||
The way Agribank Phu Vang calculates deposit interest is very clear and accurate. | ||
7 | I continue to use deposit services at Agribank Phu Vang in the near future | Usage Trend (Y) |
I will increase my deposit at Agribank Phu Vang | ||
I will introduce friends and relatives to use your deposit service. Agribank Phu Vang |
(SPSS processing source)
2.2.3.5. Test for normal distribution
Testing for normal distribution is a condition to ensure the satisfaction of the variables for factor analysis. According to Master Dao Hoai Nam, Ho Chi Minh City University of Economics, the Skewness coefficient and the Kurtosis concentration coefficient are used to test the normal distribution of factors. A Skewness distribution is considered a normal distribution when its Standard Error is in the range (-2; 2). Similarly, a Kurtosis distribution is considered a normal distribution when its Standard Error is in the range (-2; 2).
Table 13. Skewness Coefficient and Kurtosis Coefficient of Research Variables
Factors
Skewness | Std. Error of Skewness | Kurtosis | Std. Error of Kurtosis | |
Convenience factor | -0.539 | 0.192 | -0.380 | 0.381 |
Brand reputation factor | 0.146 | 0.192 | -0.820 | 0.381 |
The role of influencers | -0.210 | 0.192 | -0.256 | 0.381 |
Employee factor | -0.533 | 0.192 | -0.738 | 0.381 |
Promotion program | -0.199 | 0.192 | -0.241 | 0.381 |
Interest factor | -0.243 | 0.192 | -0.445 | 0.381 |
Usage trends | -0.136 | 0.192 | -0.968 | 0.381 |
(SPSS processing source) Through the analysis table, we see that the Std. Error of Skewness and Std. Error of Kurtosis values of the factors are all in the range (-2; 2). Thus, it can be concluded that the
The above factor is normally distributed.
2.2.3.6. Calibrating the research model
After analyzing factors and evaluating the scale using Cronbach Alpha coefficient, we have determined that there are 6 factors affecting the trend of using deposit services of individual customers at the Phu Vang District Branch of the Bank for Agriculture and Rural Development. These are Convenience factor, Brand reputation factor, Role of influencers, Staff factor, Promotion program, Interest rate factor. The new model is kept the same as the proposed model.
2.2.4. Linear regression analysis
2.2.4.1. Testing the correlation between variables
Table 14. Pearson correlation coefficient
Convenience factor profit | Brand reputation | The role of influencers | Element staff | Promotion program | Element interest rate | ||
Trend use | Correlate Pearson | 0.719 ** | 0.729 ** | 0.596 ** | 0.725 ** | 0.683 ** | 0.721 ** |
Sig. (2-sided) | 0.000 | 0.000 | 0.000 | 0.000 | 0.000 | 0.000 |
(SPSS processing source)
Note: * : Test hypotheses at a significance level less than 0.05
** : Test hypotheses at significance level less than 0.1
Comment: It can be seen that the dependent variable and the independent variables are correlated with each other, the Sig. value is less than the significance level α, indicating that the correlation is statistically significant. Thus, the regression model has 6 independent variables, of which the variable "Brand reputation" has a relatively strong correlation with Customer usage tendency.
2.2.4.2. Building a regression model
After conducting factor analysis and testing the reliability of the scale, the factors that are eligible for regression are obtained. The results of factor analysis only indicate the factors that affect the customer's tendency to use the service, but do not indicate the specific level of influence. Therefore, to measure the impact of these factors on the tendency to use the service, regression analysis is used. The regression model applied is a multivariate regression model.
The research model is represented in the form of a regression equation as follows: Usage tendency = β 0 + β 1 x Convenience factor + β 2 x Brand reputation + β 3 x Influencer role + β 4 x Employee factor + β 5 x Promotion program +
β 6 x Interest factor
Where β i is the partial regression coefficient corresponding to the independent variables.
Adjusted assumption
H 0i : The main factors have no correlation with the tendency to use
H 1 : Convenience factor is positively correlated with service usage tendency.
H 2 : Brand reputation is positively correlated with the tendency to use the service. H 3 : Influencer role is positively correlated with the tendency to use the service. H 4 : Employee factor is positively correlated with the tendency to use the service.
H 5: Promotional programs are positively correlated with service usage trends.
H 6: Interest rate factor is positively correlated with service usage trend.
2.2.4.3. Assessment of the suitability of the multiple linear regression model
The model often does not fit the actual data as the R 2 value shows. In this situation, adjusted R 2 is used to more closely reflect the suitability of the multivariate linear regression model (Hoang Trong and Chu Nguyen Mong Ngoc, 2008). Thus, to evaluate the suitability of the model, we use the coefficient of determination adjusted R 2 .
Table 15. Assessment of the suitability of the multiple linear regression model
Model
R | R 2 | R 2 correction | Std. Error of the Estimate | Durbin – Watson | |
1 | 0.927 | 0.860 | 0.855 | 0.247 | 1,853 |
(SPSS processing source)
The model's suitability is shown through the adjusted R2 value . The results in the table above show that the model with 6 independent variables has an adjusted R2 value of 0.855. Thus, the model's suitability is 85.50%. So the 6 independent variables in the model explain 85.50% of the variation in the dependent variable "Usage trend" . With this value, the model's suitability is high.
2.2.4.4. Testing the suitability of the multiple linear regression model
ANOVA test is used to test the suitability of the correlation regression model, that is, whether there is a relationship between the independent variables and the dependent variable.
The hypothesis is: H 0 : The coefficients β i = 0.
Table 16. Test of the suitability of the multiple linear regression model
ANOVA b
Model
Sum of squares | df | Mean square | F | Significance level. | ||
1 | Regression | 57,568 | 6,000 | 9,595 | 156,842 | 0.000 |
Balance | 9,360 | 153,000 | 0.061 | |||
Total | 66,927 | 159,000 |
(SPSS processing source)
The ANOVA analysis results of the regression analysis show that the Sig. value = 0.000 < 0.05, so there is enough statistical evidence to reject the hypothesis H 0 . Thus, the combination of independent variables explains well the changes in the dependent variable.