Variable
Total variable correlation coefficient | Cronbach's Alpha coefficient if variable is excluded | |
4. Perceived risk reduction: Cronbach's Alpha = 0.735 | ||
RR1 | 0.542 | 0.667 |
RR2 | 0.552 | 0.656 |
RR3 | 0.581 | 0.620 |
5. Cost of use: Cronbach's Alpha = 0.874 | ||
CP1 | 0.806 | 0.777 |
CP2 | 0.766 | 0.815 |
CP3 | 0.703 | 0.870 |
6. Work influence: Cronbach's Alpha = 0.725 | ||
CV1 | 0.510 | 0.686 |
CV2 | 0.583 | 0.603 |
CV3 | 0.555 | 0.627 |
Maybe you are interested!
-
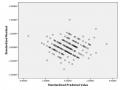
 Testing the Linear Relationship Between the Dependent Variable and the Independent Variable.
 -
 Testing the Reliability of the Scale Using Cronbach'S Alpha Coefficient
 -
 Research Results For Dependent Variable Scale Efficiency
 -
 A. Results of Testing the Reliability Coefficient of the Factor Scale from the Enterprise Side
 -
 Testing the Reliability of the Scale Using Cronbach'Alpha

(Source: Author's investigation results in 2020)
Through the summary table of the results of the reliability test of the scale above, it can be concluded that the scale used in the study is appropriate and reliable, ensuring the step of exploratory factor analysis EFA.
Table 2. 10 Reliability test of dependent variable scale
Variable
Total variable correlation coefficient | Cronbach's coefficient if variable is removed | |
Decision to use: Cronbach's Alpha = 0.786 | ||
QD1 | 0.640 | 0.701 |
QD2 | 0.675 | 0.666 |
QD3 | 0.576 | 0.760 |
(Source: Author's investigation results in 2020)
The results of the reliability assessment of the factor "Decision to use" for Cronbach's Alpha coefficient = 0.786. The total correlation coefficient of the 3 observed variables is large.
more than 0.3 and Cronbach's Alpha coefficient if the variable is less than 0.786, so the dependent variable "Decision to use" is retained and ensures reliability to perform the next analysis steps.
2.3.4 Exploratory Factor Analysis (EFA)
2.3.4.1 KMO Test and Bartlett's Test of Independent Variables
Before conducting exploratory factor analysis, the study needs to test KMO to see if this analysis is appropriate or not. The test is done by examining the KMO coefficient (Kaiser Meyer – Olkin of Sampling Adequacy) and Bartlett's Test.
The KMO value is an indicator used to examine the appropriateness of EFA. The content of the KMO coefficient test must satisfy the condition 0.5 ≤ KMO ≤ 1, proving that the EFA exploratory factor analysis step is appropriate in this study.
The results are as follows:
- KMO value of 0.783 is greater than 0.5, showing that EFA analysis is appropriate.
- The significance level Sig. of Bartlett's Test is less than 0.05, so the observed variables included in the research model are correlated with each other and suitable for exploratory factor analysis EFA.
Table 2. 11 KMO test and Bartlett's Test of independent variables
KMO and Bartlett's Test
KMO value (Kaiser Meyer – Olkin of Sampling Adequacy) | 0.783 | |
Statistical quantity Bartlett's Test | Approx. Chi-Square | 1236,700 |
df | 210 | |
Sig. | 0.000 | |
(Source: Author's investigation results in 2020)
2.3.4.2 Exploratory factor analysis EFA independent variables
In this study, when analyzing the exploratory factor EFA to use the method
Principal Components Analysis with Number of Factors
Factor) is pre-determined to be 6 according to the proposed research model. The purpose of using this method is to reduce data, limit violations of multicollinearity between factors in the analysis of the next regression model.
The selected factor rotation method is Varimax procedure: rotate the original factors to minimize the number of variables with large coefficients on the same factor to enhance the ability to explain the factor. Variables with factor loading coefficient <0.5 will be eliminated from the research model, only variables with factor loading coefficient >0.5 will be included in the next analysis.
In this study, the factor loading coefficient (Factor Loading) must satisfy the condition of greater than or equal to 0.5. According to Hair et al. (1998), Factor Loading is an indicator to ensure the practical significance of EFA, Factor Loading > 0.3 is considered the minimum level and is recommended if the sample size is larger than 350. Factor Loading > 0.4 is considered important, Factor Loading > 0.5 is considered to have practical significance and this study chooses the Factor Loading value > 0.5 with a sample size of 120.
Table 2.12 Extraction of independent variable factors
Observation variable
Group of factors | ||||||
1 | 2 | 3 | 4 | 5 | 6 | |
SUDUNG3 | 0.883 | |||||
SUDUNG4 | 0.846 | |||||
SUDUNG2 | 0.717 | |||||
SUDUNG1 | 0.674 | |||||
XAHOI3 | 0.840 | |||||
XAHOI4 | 0.807 | |||||
XAHOI1 | 0.790 | |||||
XAHOI2 | 0.656 | |||||
HUUICH2 | 0.811 | |||||
HUUICH4 | 0.807 | |||||
HUUICH3 | 0.723 | |||||
HUUICH1 | 0.714 | |||||
Observation variable
Group of factors | ||||||
1 | 2 | 3 | 4 | 5 | 6 | |
CHIPHI1 | 0.848 | |||||
CHIPHI2 | 0.812 | |||||
CHIPHI3 | 0.773 | |||||
CONGVIEC2 | 0.846 | |||||
CONGIN1 | 0.749 | |||||
CONGVIEC3 | 0.647 | |||||
RUIRO1 | 0.782 | |||||
RUIRO3 | 0.740 | |||||
RUIRO2 | 0.609 | |||||
Eigenvalue coefficient | 6,294 | 2,488 | 1,866 | 1,632 | 1,309 | 1,018 |
Forward variance progressive (%) | 14,786 | 27,074 | 39,309 | 51,058 | 60,554 | 69,558 |
(Source: Author's investigation results in 2020)
Conducting factor analysis for the first time, putting 24 observed variables in 6 independent variables affecting customers' usage decisions into factor analysis according to the Eigenvalue standard greater than 1, 6 factors were created.
Thus, after conducting exploratory factor analysis (EFA), the number of observed variables is still 21. No observed variable has a factor loading coefficient (Factor Loading) less than 0.5, so the variable is not eliminated, the topic continues to proceed with the next analysis steps.
The result of factor analysis is accepted when the Variance Explained Criteria > 50% and the Eigenvalue is greater than 1 (according to Gerbing & Anderson, 1998). Based on the above results, the total variance extracted is 69.558% > 50%, so factor analysis is appropriate.
Name the factor groups:
- Factor 1 includes 4 observed variables: SUDUNG1, SUDUNG2, SUDUNG3, SUDUNG4. The study named this new factor “ Perceived ease of use”.
- Factor 2 includes 4 observed variables: HUUICH1, HUUICH2, HUUICH3, HUUICH4. The study named this new factor " Perceived usefulness".
- Factor 3 includes 4 observed variables: XAHOI1, XAHOI2, XAHOI3, XAHOI4. The study named this new factor " Social influence".
- Factor 4 includes 3 observed variables: RUIRO1, RUIRO2, RUIRO3. The study named this new factor “ Perceived risk reduction”
- Factor 5 includes 3 observed variables: SUDUNG1, SUDUNG2, SUDUNG3. This study names this new factor “ Usage cost”.
- Factor 6 includes 3 observed variables: CONGVIEC1, CONGVIEC2, CONGVIEC3. This study names this new factor “ Work Influence”.
2.3.4.3 KMO Test and Bartlett's Test of dependent variable
The conditions for testing KMO and Bartlett's Test for the dependent variable are similar to the conditions for testing the independent variable. After analyzing and evaluating the general decision to use the e-commerce service of Agribank Hue branch through 3 observed variables, the result for the KMO index is 0.695 (greater than 0.5) and the Bartlett's Test gives the value Sig. = 0.000 (less than 0.05), so the income data meets the conditions for conducting factor analysis.
Table 2. 13 KMO test and Bartlett's Test of dependent variable
KMO and Bartlett's Test
KMO value (Kaiser Meyer – Olkin of Sampling Adequacy | 0.695 | |
Statistical quantity Bartlett's Test | Approx. Chi-Square | 106,162 |
df | 3 | |
Sig. | 0.000 | |
(Source: Author's investigation results in 2020)
2.3.4.4 Exploratory factor analysis EFA dependent variable
Table 2.14 Extracting dependent variable factors
Decision to use
Load factor | |
QUYETDINH1 | 0.866 |
QUYETDINH2 | 0,848 |
QUYETDINH3 | 0.803 |
Cumulative variance (%) | 70,466 |
(Source: Author's investigation results in 2020)
The results of the exploratory factor analysis extracted a factor, which was created from 3 observed variables that the topic had previously proposed, with the aim of drawing conclusions about customers' decision to use the TTKDTM service of Agribank Nam Song Huong branch. This factor is called " Decision to use".
The above EFA factor analysis process has identified 6 factors affecting the decision to use the e-commerce service of Agribank Hue branch in Hue City, namely " Perceived usefulness", "Perceived ease of use", "Social influence", "Perceived risk reduction", "Cost of use" and "Work influence".
Thus, the research model after EFA exploratory factor analysis did not change significantly compared to the original, no observed variables were removed from the model during the process of testing scale reliability and exploratory factor analysis.
2.3.5 Model fit testing
2.3.5.1 Testing the correlation between independent variables and dependent variables
Table 2.15 Pearson correlation analysis
SD | HI | XH | RR | CP | CV | QD | ||
QD | Pearson correlation | 0.556 | 0.447 | 0.269 | 0.563 | 0.547 | 0.432 | 1,000 |
Sig.(2-tailed) | 0.000 | 0.000 | 0.001 | 0.000 | 0.000 | 0.000 | - | |
N | 120 | 120 | 120 | 120 | 120 | 120 | 120 |
(Source: Author's investigation results in 2020)
Based on the above analysis results, we see:
- The Sig.(2-tailed) values of the new factors are all less than the significance level α = 0.05
shows significant correlation between independent variables and dependent variable
- Pearson correlation coefficient is also quite high (3 factors are greater than 0.5) and 3 factors are lower than 0.5, so we can conclude that the independent variables after adjustment can explain the dependent variable "Decision to use"
2.3.5.2 Analysis of the impacts of factors on customers' decision to use non-cash payment services at Nam Song Huong branch
After conducting exploratory factor analysis (EFA) to discover new factors affecting the dependent variable "decision to use", the study conducted linear regression to determine the direction and level of influence of these new factors on the decision to use.
The regression model was built with the dependent variable " Decision to use " ( QD) and the independent variables extracted from the EFA exploratory factor analysis including 6 variables: " Perceived ease of use" ( SD) , "Perceived usefulness" ( HI) , "Social influence" ( XH ), "Perceived risk reduction" ( RR ), "Cost of use" ( CP ) and "Work influence" ( CV ) with corresponding Beta coefficients β 1 , β 2 , β 3 , β 4 , β 5, β 6, respectively.
The regression model is constructed as follows:
QD= β 0 + β 1 SD + β 2 HI + β 3 XH + β 4 RR + β 5 CP + β 6 CV + ei
Based on the standardized Beta coefficient with the corresponding significance level Sig. to determine which independent variables affect the dependent variable in the model and to what extent and in what direction. From there, it is the basis for more accurate conclusions and highly convincing solutions. The results of the regression model will help us determine the direction and level of influence of factors affecting the decision to use the TTKDTM service of Agribank Hue branch in Hue city.
Linear regression analysis will help us know the direction and intensity of the influence of independent variables on the dependent variable. In the regression analysis phase, the study chose the Enter method, selecting based on the criteria of selecting factors with a significance level of Sig. < 0.05. Factors with a Sig. value > 0.05 will be removed from the model and that factor will not be further studied.
The results of regression analysis are shown in the following tables:
Table 2.16 Results of regression model analysis of factors affecting decision
Customer's intention to use e-commerce services at Nam Song Huong branch
Unstandardized coefficient | Standardization factor | t | Sig. | VIF | ||
B | Standard deviation | Beta | ||||
Constant | -0.233 | 0.401 | - | -0.582 | 0.562 | - |
SD | 0.184 | 0.073 | 0.207 | 2,502 | 0.014 | 1,665 |
HI | 0.263 | 0.082 | 0.226 | 3,207 | 0.002 | 1,207 |
XH | 0.039 | 0.065 | 0.041 | 0.603 | 0.548 | 1,143 |
RR | 0.258 | 0.078 | 0.268 | 3,299 | 0.001 | 1,607 |
CP | 0.131 | 0.065 | 0.167 | 2,024 | 0.045 | 1,656 |
CV | 0.176 | 0.082 | 0.156 | 2,143 | 0.034 | 1,293 |
(Source: Author's investigation results in 2020)