Table 3.8. NMR spectral data ( δ ppm) of SD8 and reference compounds
Location
a,c δ H | a,b δ C | # δ C | & δ C | |
1 | - | 141.7 | 141.6 | 142.1 |
2 | - | 145.2 | 145.1 | 146.6 |
3 | 6.87 s | 106.8 | 106.7 | 106.8 |
3a | - | 127.4 | 127.5 | 126.2 |
4 | 3.21 t (6.0) | 30.7 | 30.8 | 28.9 |
5 | 3.27 t (6.0) | 50.6 | 50.5 | 53.5 |
6a | - | 143.9 | 144.1 | 61.8 |
6b | - | 118.3 | 118.3 | 126.4 |
7 | 6.88 s | 106.8 | 106.7 | 26.7 |
7a | - | 129.4 | 129.5 | 129.6 |
8 | - | 141.7 | 141.6 | 145.9 |
9 | - | 150.2 | 150.2 | 152.0 |
10 | 7.01d (9.0) | 108.8 | 108.5 | 110.3 |
11 | 8.64d (9.0) | 123.4 | 123.4 | 123.1 |
11a | - | 118.8 | 118.6 | 124.6 |
11b | - | 117.5 | 117.4 | 116.5 |
12 | 6.18 s | 100.9 | 100.8 | 100.6 |
8- OCH3 | 3.97 s | 60.6 | 60.5 | 60.7 |
9- OCH3 | 3.98 s | 56.2 | 56.2 | 55.7 |
6-NCH 3 | 3.12 s | 40.6 | 40.5 | 43.7 |
Maybe you are interested!
-
 1H And 13C-Nmr Spectral Data Of Compound Sxh6 And Reference Substance
 -
 1H And 13C-Nmr Spectral Data Of Compound Sxe15 And Reference Substance
 -
 1 H, 13 C-Nmr Spectrum Data Of At3 (Cd 3 Od, 500/125Mhz)
 -
 Table of Data Converted to Logarithm Base E
 -
 Internship report at Vietnam Institute of Industrial Chemistry - 1
a CDCl 3 , b 500 MHz, c 125 MHz
# δ C of dehydrocrebanin measured in CDCl 3 & δ C of SD7 measured in CDCl 3 [123]
NMR spectral data showed that SD8 was similar to SD7 except for the structure of the C ring with large changes in the chemical shifts of C-6a (- 82.1 ppm), C-6b (+ 8.1 ppm), C-7 (- 80.1 ppm) and C-11a (+ 5.8 ppm). 13 C-NMR and HSQC spectra
showed the presence of -CH=C< group ( δ C 106.8 and 143.9) in the C ring instead of methine and methylene groups as in the structure of SD7 . This was also observed in the 1 H-NMR spectrum with the appearance of olefinic proton at δ H 6.88 (s). The spectrum
HMBC also showed the interaction of this proton with C-6b, C-11a and C-8. With the above data analysis and comparison with published references, it was possible to identify compound SD8 as dehydrocrebanin [123] ( Figure 3.9 ).
Figure 3.9. Structure of compound SD8
3.1.2.9. Compound SD9
Compound SD9 was isolated as a white solid. The ESI-MS spectrum showed a pseudomolecular ion peak at m/z 120.8 [MH] - consistent with the molecular formula C 7 H 6 O 2 . 1 H-NMR (500 MHz, CD 3 OD) and 13 C-NMR (125 MHz, CD 3 OD) spectra:
See table 3.9 .
Table 3.9. NMR spectral data ( δ ppm) of SD9 and reference compounds
Location
a,b δ H | a,c δ C | # δ C | |
1 | - | 130.0 | 130.3 |
2, 6 | 7.79d (9.0) | 133.5 | 133.5 |
3, 5 | 6.92d (9.0) | 117.1 | 116.9 |
4 | - | 165.8 | 165.2 |
7 | 9.77 s | 192.8 | 192.9 |
a CD 3 OD, b 500 MHz, c 125 MHz
# δ C of 4-hydroxybenzaldehyde measured in CD 3 OD [125]
The 1 H-NMR spectrum showed two pairs of olefin proton signals at δ H 7.79 (2H, d, J
= 9.0 Hz, H-2, H-6) and 6.92 (2H, d, J = 9.0 Hz, H-3, H-5) characterize the aromatic ring system of AAʹBBʹ type. In addition, the proton spectrum also showed the signal of the aldehyde group at δ H 9.77 (1H, s, H-7). The 13 C-NMR and DEPT spectra showed the signals of 7 carbons, of which 6 carbons of the aromatic ring at δ C 130.0 (C-1), 133.4 (C-2, C-6), 117.0 (C-3, C-5) and 165.7 (C-4). The signal at δ C 192.7 (C-7) characterizes the aldehyde group.
With the above spectral data analysis and comparison with published references, SD9 can be identified as 4-hydroxybenzaldehyde [125] ( Figure 3.10 ).
Figure 3.10. Structure of compound SD9
3.1.2.10. Compound SD10
Compound SD10 was isolated as a white amorphous powder. The ESI-MS spectrum showed a pseudomolecular ion peak at m/z 292.9 [M+Na] + consistent with the molecular formula C13H18O6 . The 1 H-NMR (500 MHz , CD3OD ) and 13 C-NMR (125 MHz, CD3OD) spectra were obtained .
MHz, CD 3 OD): See table 3.10 .
Table 3.10. NMR spectral data ( δ ppm) of SD10 and reference compounds
Location
a,b δ H | a,c δ C | # δ C | |
1 | - | 139.0 | 139.1 |
2, 6 | 7.41 m | 129.2 | 129.3 |
3, 5 | 7.31 m | 129.1 | 129.2 |
4 | 7.26 m | 128.6 | 128.6 |
7 | 4.66d (12.0) 4.92d (12.0) | 71.7 | 71.8 |
1ʹ | 4.35d (8.0) | 103.2 | 103.3 |
2ʹ | 3.23-3.30 m | 75.1 | 75.1 |
3ʹ | 77.9 | 78.1 | |
4ʹ | 71.6 | 71.7 | |
5ʹ | 3.34 m | 78.0 | 78.1 |
6ʹ | 3.69 d (6.0, 12.0) 3.89 d (2.5, 12.0) | 62.8 | 62.8 |
a CD 3 OD, b 500 MHz, c 125 MHz
# δ C of benzyl β-D-glucopyranoside measured in CD 3 OD [126]
The 1 H-NMR spectrum showed signals of 5 aromatic protons at δ H 7.41 (2H, m, H-2, H-6), 7.31 (2H, m, H-3, H-5) and 7.26 (1H, m, H-4) suggesting the presence of a substituted benzene ring at position 1. In addition, the proton spectrum also showed signals of the oxymethylene group at δ H 4.66 (1H, d, J = 12.0 Hz, H-7) and 4.92 (1H, d, J = 12.0 Hz, H-7). In addition, the presence of β -D-glucopyranosyl sugar group was also shown through the signals of anomeric protons with large coupling constants [ δ H 4.35 (1H, d, J = 8.0 Hz)], hydroxymethylene group protons [ δ H 3.69 (1H, d, J = 6.0; 12.0 Hz), 3.89 (1H, d, J = 2.5; 12.0 Hz)] and hydroxymethin group protons [ δ H 3.23 – 3.34 (4H, m)]. The 13 C-NMR spectrum showed signals of 13 carbons, of which 6 carbons of β -D-glucopyranosyl sugar group [ δ C 103.2, 75.1, 77.9, 71.6, 78.0 and 62.8]. The position of this sugar moiety was determined at C-7 through the HMBC interaction between H-1′ ( δ H 4.35) and C-7 ( δ C 71.7). With the above spectral data analysis and comparison with published references, compound SD10 can be identified as benzyl β- D-glucopyranoside [126] ( Figure 3.11 ).
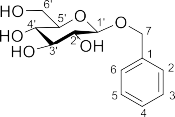
Figure 3.11. Structure of compound SD10
3.1.2.11. Compound SD11
Compound SD11 was obtained as a white amorphous powder. The ESI-MS spectrum showed a pseudomolecular ion peak at m/z 409 [M+Na] + consistent with the molecular formula C19H30O8 . The 1 H-NMR ( 500 MHz , CD3OD ) and 13 C - NMR (125 MHz,
CD 3 OD): See table 3.11 .
Table 3.11. NMR spectral data ( δ ppm) of SD11 and reference compounds
Location
a,b δ H ( J = Hz) | a,c δ C | # δ C | & δ C | $ δ C | @ δ C | |
1 | - | 42.4 | 42.5 | 42.5 | 42.5 | 42.4 |
2 | 2.18m/2.61m | 50.7 | 50.7 | 50.8 | 50.8 | 50.7 |
3 | - | 201.2 | 201.2 | 210.3 | 201.3 | 201.1 |
4 | 5.89 br s | 127.1 | 127.2 | 127.1 | 127.2 | 127.2 |
5
- | 167.0 | 167.3 | 167.4 | 167.2 | 166.9 | |
6 | - | 80.0 | 80.0 | 80.0 | 80.1 | 80.0 |
7 | 6.99d (15.5) | 133.7 | 131.6 | 131.7 | 134.7 | 134.1 |
8 | 5.75d (15.5) | 133.7 | 135.3 | 135.1 | 133.8 | 133.8 |
9 | 4.55 m | 74.6 | 77.3 | 76.9 | 74.7 | 74.7 |
10 | 1.31d (6.5) | 22.2 | 21.22 | 21.2 | 22.3 | 22.2 |
11 | 1.06 s | 23.4 | 23.5 | 23.4 | 23.5 | 23.5 |
12 | 1.03 s | 24.7 | 24.7 | 24.6 | 24.7 | 24.8 |
13 | 1.96d (1.5) | 19.5 | 19.6 | 19.7 | 19.6 | 19.4 |
1ʹ | 4.29d (7.5) | 101.2 | 102.8 | 102.6 | 100.3 | 100.9 |
2ʹ | 3.21 t (8.0) | 74.9 | 75.3 | 75.2 | 75.0 | 75.0 |
3ʹ | 3.25-3.30 m | 78.3 | 78.2 | 78.0 | 78.4 | 78.3 |
4ʹ | 3.25-3.30 m | 71.6 | 71.7 | 71.5 | 71.7 | 71.8 |
5ʹ | 3.17 m | 78.1 | 78.1 | 78.0 | 78.3 | 78.1 |
6ʹ | 3.66 d (6.0, 11.5) 3.87 d (2.0, 11.5) | 62.8 | 62.9 | 62.6 | 62.9 | 62.9 |
a CD 3 OD, b 500 MHz, c 125 MHz
# δ C of (6S,9R)-roseoside, & δ C of (6R,9R)-roseoside, $ δ C of (6S,9S)- roseoside and @ δ C of (6R,9S)-roseoside measured in CD 3 OD [127]
The 1 H-NMR spectrum of compound SD11 showed the signals of an olefin proton of the form C=CH at δ H 5.89 (1H, br s, H-4) and a doubly different double bond (CH=CH) of the trans form at δ H 6.99 (1H, d, J = 15.5 Hz, H-7) and 5.75 (1H, dd, J = 15.5 Hz, H-8); 3 tertiary methyl groups [ δ H 1.03 (3H, s, H-12), 1.06 (3H, s, H-11) and 1.96 (3H,
d, J = 1.5 Hz, H-13)] and 1 secondary methyl group [ δ H 1.31 (3H, d, J = 6.5 Hz, H- 10)]; 1 methylene group [ δ H 2.18 (1H, m, H-2a)/2.61 (1H, m, H-2b)]; 1 oxymethine group [ δ H 4.55 (1H, t, J = 6.8 Hz, H-9)]. In addition, the 1 H-NMR spectrum also showed signals of an anomeric proton at δ H 4.29 (1H, d, J = 7.5 Hz, H-1ʹ), 2 hydroxymethylene protons at δ H 3.66 (1H, dd, J = 6.0, 11.5 Hz, H-6ʹ), 3.87 (1H, dd, J = 2.0; 11.5 Hz, H-6ʹ) and hydroxymethine protons in the field range of 3.17 - 3.21 ppm, suggesting the presence of a hexose sugar moiety.
The chemistry of the sugar moiety together with the large interaction constant of the anomeric H- 1'/H-2' proton ( J 1′-2′ = 7.5 Hz) suggests that the sugar moiety is O- β -D-glucopyranosyl.
The 13 C-NMR and HSQC spectra of compound SD11 showed resonance signals of 19 carbons, including 13 carbons characteristic of the megastigman framework: 1 carbonyl group at δ C 201.2 (C-3), 2 methine olefin groups of the double bond (CH=CH) at δ C 133.7 (C-7)/133.7 (C-8), 2 other olefin carbon signals of the double bond CH=C at 127.1 (C-4)/167.0 (C-5), 4 methyl groups at δ C 19.5 (C-13), 22.2 (C-10), 23.4 (C-11),
24.6 (C-12), 1 methylene group at δ C 50.7 (C-2), 1 non-hydrogen-bearing carbon bonded to oxygen at δ C 80.0 (C-6), oxymethin group at δ C 74.6 (C-9), and six carbons characteristic of sugar residues at δ C 101.2 (C-1ʹ) and 5 oxymethin/oxymethylene group signals in the region from δ C 62.8 - 78.3.
HMBC spectrum analysis of SD11 showed that the positions of two tertiary methyl groups at C-1 and C-5 were determined based on the interactions between H 3 -11/H 3 -12 with C-1/C-2/ C-6, between H 3 -13 with C-4/C-5/C-6; the position of one remaining secondary methyl group at C-9 was determined based on the HMBC interactions between H 3 -10 with C-8/C-9. By similarly determining the correlation between the interactions, the position of the ketone group (C-
3) is determined based on the HMBC interactions between the H-2/H-4 proton and C-3. The HMBC interaction between the anomeric H-1ʹ proton and C-9 determines the position of the sugar bond at C-9.
The 6 R , 9 S configuration was determined based on the chemical shifts of carbon at positions C-7, C-8 and C-9 ( Table 3.11 ). From the above analysis combined with comparison of NMR spectral data with the previously published compound (6 R , 9 S )-roseoside [127], it can be confirmed that SD11 is (6 R , 9 S )-roseoside ( Figure 3.12 ).


Figure 3.12. Structure (A) and HMBC interactions (B) of compound SD11
Thus, from the stem and leaves of the plant, 11 compounds were extracted, isolated and determined in structure. The basic information of these compounds is summarized in Table 3.12.
Table 3.12. Compounds isolated from the stems and leaves of the plant
STT
Compound name | CTPT – KLPT | Chemical structure | ||
1 | Steriltin A (SD1) | C 19 H 15 NO 6 | O | |
M = 353.0899 | O | N | ||
O OCH 3 | ||||
OH | ||||
OCH 3 | ||||
2 | Steriltin B (SD2) | C 17 H 11 NO 4 | O | |
M = 293.0688 | O | N | ||
O | ||||
OCH 3 | ||||
3 | Oxostephanin (SD3) | C18H11NO4 | O | |
M = 305 | O | N | ||
O | ||||
OCH 3 | ||||
4 | Oxostephanosine (SD4) | C 17 H 9 NO 4 M = 291 | OO | NO OH |
5 | Oxocrebanin (SD5) | C 19 H 13 NO 5 | O | |
M = 335 | O | N | ||
O | ||||
OCH 3 | ||||
OCH 3 | ||||
6 | Aristolactam (SD6) | C 17 H 11 NO 4 | O | O |
M = 293 | O | NH | ||
OCH 3 | ||||
7
Crebanin (SD7) | C20H21NO4 | O | ||||
M = 339 | O N CH 3 | |||||
OCH 3 | ||||||
OCH 3 | ||||||
8 | Dehydrocrebanin | C20H19NO4 | O | |||
(SD8) | M = 337 | O N CH 3 | ||||
OCH 3 | ||||||
OCH 3 | ||||||
9 | 4-hydroxybenzaldehyde (SD9) | C 7 H 6 O 2 M = 122 | OH OH | |||
10 | Benzyl β- D-glupyranoside (SD10) | C13H18O6M = 270 | HO O O HO HO OH | |||
11 | (6 R ,9 S )-roseoside (SD11) | C 19 H 30 O 8 M = 386 | O | O HO O OH | OH | OH OH |
3.2. INITIAL RESEARCH ON DEVELOPING ISOLATION METHODS AND QUANTITATIVE METHODS TO MONITOR OXOSTEPHANIN CONTENT IN MEDICINAL HERBS ACCORDING TO HARVESTING TIME
3.2.1. Isolation and preliminary assessment of the purity of oxostephanin
3.2.1.1. Isolation of oxostephanin
The raw material is dried rhizome leaves and stems (moisture content 5.6%) (5 kg) crushed and soaked in MeOH (35 liters) at room temperature. After 3 days, the extract is separated and evaporated on a vacuum distiller to obtain MeOH residue. Repeat the extraction two more times using the above solvent to obtain MeOH residue, denoted as M (0.45 kg, efficiency 9.0% compared to the mass of dried rhizome leaves and stems).