73.60%, the group <5 years old has the lowest rate of 3.73%. The ethnic groups and occupations of the surveyed subjects are mainly Kinh and Stieng ethnic groups, accounting for the majority of 44.53% and 41.73%, respectively. The main occupation of the surveyed subjects at the research site is farming and forestry, accounting for 46.54%.
3.1.2. Malaria parasites detected at the study site
Table 3.2. Malaria parasite infection rate at the study site
Dak O Commune (n=399) | Bu Gia Map Commune (n=351) | Total of 02 communes (n=750) | ||||
Technical review test | KSTSR infection | KSTSR infection | KSTSR infection | |||
Have (%) | Are not (%) | Have (%) | Are not (%) | Have (%) | Are not (%) | |
Real-Time PCR | 72 (18.05) | 327 (81.95) | 107 (30.48) | 244 | 179 (23.87) | 571 (76.13) |
RDT | 03 (0.75) | 396 (99.25) | 07 (2.0) | 344 (98.0) | 10 (1.33) | 740 (98.67) |
KHV | 09 (2.56) | 390 (97.74) | 07 (2.0) | 344 (98.0) | 16 (2.13) | 734 (97.87) |
Overall infection rate | 72 (18.05) | 327 (81.95) | 107 (30.48) | 244 | 179 (23.87) | 571 (76.13) |
Maybe you are interested!
-
 Objective 2: Effectiveness of Surveillance, Detection and Treatment of Malaria Infections at the Study Site, 2018-2019
 -
 Overview of Abs Management at the Study Site
 -
 Limiting social insurance debt of businesses by applying sanctions Case study of businesses in Thanh Xuan district, Hanoi city - 12
 -
 The relationship between travel motivation, destination image and destination choice - A case study of Binh Dinh province tourism destination - 1
 -
 Study on fabrication and gas sensitivity of heterostructure between SnO2 nanowires and some semiconducting metal oxides - 17

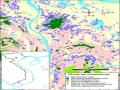
Results of cross-sectional survey in Bu Bung, Bu Khon, Bu Ka villages, Dak O commune and Bu Lu, Bu Ren, Dak Con villages, Bu Gia Map commune, showed that the rate of malaria parasites detected by Real-Time PCR, RDT and blood smear microscopy was unevenly distributed between villages of the two communes.
The overall rate of malaria parasites detected by Real-Time PCR technique in Dak O and Bu Gia Map communes was 23.87%, the rate of malaria parasites detected by RDT was 1.33% and the rate of malaria parasites detected by blood smear microscopy was 2.13%.
Table 3.3. Species composition of malaria parasites detected at the study site (n=750)
KSTSR species
Testing techniques | n | P. falciparum n (%) | P. vivax n (%) | P. falciparum + P. vivax n (%) | Total n (%) |
Real-Time PCR | |||||
Dak O | 399 | 61 (15.29) | 07 (1.75) | 04 (1.0) | 72 (18.05) |
Fat Bu Gia Map | 351 | 55 (15.67) | 30 (8.55) | 22 (6.27) | 107 (30.48) |
Add | 750 | 116 (15.47) | 37 (4.93) | 26 (3.47) | 179 (23.87) |
RDT | |||||
Dak O | 399 | 03 (0.75) | 00 (0.0) | 00 (0.0) | 03 (0.75) |
Fat Bu Gia Map | 351 | 05 (1.42) | 02 (0.57) | 00 (0.0) | 07 (2.0) |
Add | 750 | 08 (1.07) | 02 (0.27) | 00 (0.0) | 10 (1.33) |
KHV | |||||
Dak O | 399 | 08 (2.01) | 01 (0.25) | 00 (0.0) | 09 (2.56) |
Fat Bu Gia Map | 351 | 05 (1.42) | 02 (0.57) | 00 (0.0) | 07 (2.0) |
Add | 750 | 13 (1.73) | 03 (0.40) | 00 (0.0) | 16 (2.13) |
The rate of malaria parasite infection detected by Real-Time PCR technique was 23.87%. Of which, malaria parasite caused by P. falciparum accounted for 15.47%, malaria parasite caused by P. vivax accounted for 4.93% and mixed infection of P. falciparum + P. vivax accounted for 3.47%.
The proportion of malaria parasites detected by RDT technique was 1.33%, of which P. falciparum parasites accounted for 1.07% and P. vivax parasites accounted for 0.27%. The proportion of malaria parasites detected by microscopic examination of blood smears was 2.13%, of which P. falciparum parasites accounted for 1.73% and P. vivax parasites accounted for 0.40%. The RDT and microscopic examination of blood smears in this study did not detect subjects infected with mixed malaria parasites.
90
80
70
60
50
40
30
20
10
0
80.0%
81.25%
64.8%
20.67%
14.53%
20.0%
18.75%
0.0%
0.0%
Real-Time PCR
P. falciparum
RDT
P. vivax
KHV
PH
Figure 3.1. Structure of malaria parasite species detected by testing techniques
The malaria parasite species caused by P. falciparum accounted for the highest proportion of the total malaria parasites detected, in which P. falciparum detected by blood smear microscopy accounted for 81.25%, RDT accounted for 80.0% and Real-Time PCR technique accounted for 64.80%.
Table 3.4. Rate of malaria parasite infection detected at the study site
Technical review
test
Location | n | Parasitic infection (n= 750) | P | ||
Have (%) | Are not (%) | ||||
Real-Time PCR | Dak O | 399 | 72 (18.05) | 327 (81.95) | <0.05 |
Fat Bu Gia Map | 351 | 107 (30.48) | 247 (69.52) | ||
RDT | Dak O | 399 | 03 (0.75) | 396 (99.25) | >0.05 * |
Fat Bu Gia Map | 351 | 07 (2.0) | 344 (98.0) | ||
KHV | Dak O | 399 | 09 (2.56) | 390 (97.74) | >0.05 |
Fat Bu Gia Map | 351 | 07 (2.0) | 344 (98.0) | ||
* : Fisher exact correction
The rate of malaria parasite infection detected by Real-Time PCR technique in Dak O commune and Bu Gia Map commune has a difference of p<0.05. However, the rate of malaria parasite detected
By RDT technique and blood smear microscopy in the two communes, there was no difference p>0.05.
3.1.3. Malaria parasite prevalence distribution according to characteristics of the study subjects
12.2
12.1
12
11.9
11.8
11.7
11.6
11.5
12.13%
11.73%
Male
Female
Figure 3.2. Parasite prevalence distribution by sex of study subjects. Parasite prevalence at the study site using real-time PCR technique.
Men account for 12.13%, equivalent to women account for 11.73%.
18.0%
20
5.20%
10
0.66%
0
<5 years old
5-15 years old
>15 years old
Figure 3.3. Rate of parasitic infection by age group of study subjects. The rate of parasitic infection was highest in subjects >15 years old 18.0%, lowest
The highest infection rate was in the <5 years old group at 0.66% and in the 5-15 years old group at 5.20%.
9.87%
10.13%
12
10
8
6
4
2
0
2.53%
1.33%
Terrible
Stieng
Tay, Nung, M'Nong
Other
Figure 3.4. Parasitic infection rates by ethnicity of study subjects
1211.33%
10
8
6
4.14%
4.40%
4
2
0
Farming Forestry Trading Housework Student Other
The Stieng ethnic group has a malaria parasite infection rate of 10.13%, higher than the Kinh ethnic group at 9.87% and other ethnic groups at 1.33%.
2.80% | ||||
0.53% 0.67% |
Figure 3.5. Rate of parasite infection according to occupation of the study subjects. Rate of parasite infection in subjects working in fields and forests is 14.13%, students and
Housewives account for 8.54%, the lowest are traders and housewives account for 1.20%.
3.1.4. Describe some related epidemiological factors and history of malaria
Variable | Frequency | Percentage | |
At home | 129 | 17.20 | |
On the farm | 406 | 54.13 | |
In the forest | 38 | 5.07 | |
Elsewhere | 177 | 23.60 | |
Length of stay at the location | <1 year | 13 | 1.73 |
direction | ≥1 year | 737 | 98.27 |
Have | 85 | 11.33 | |
Table 3.5. Some epidemiological factors related to malaria
Accommodation within 14 days
Crossing the border
Sleep at home with mosquito net at night
Are not
No 665 88.67
There are 743 99.07
No 07 0.93
Have | 67 | 8.93 | |
Are not | 683 | 91.07 | |
Have | 154 | 20.53 | |
Are not | 596 | 79.47 | |
Have | 210 | 28.00 | |
Ever had malaria | Are not | 531 | 70.80 |
Don't remember | 09 | 1.20 | |
Sleeping in the forest
Sleeping while working in the fields
Epidemiological factors related to malaria infection of subjects at the research site in the 14 days before the survey, when interviewed, the majority of the research subjects were in the fields (54.13%), at home (17.20%), in the forest (5.07%) and elsewhere (23.60%). Subjects who have time to stay, live and work in the locality
≥1 year accounted for 98.27% and had border exchanges between Vietnam and Cambodia accounted for 11.33%. The rate of regularly sleeping under mosquito nets at night accounted for 99.07%, and sleeping over when
Going to the forest accounted for 8.93%, sleeping in the fields accounted for 20.53% and having a history of malaria accounted for 28.0%.
21.52%
70
22.71%
60
28.57%
21.81%
20.74%
50
40
47.76%
30
32.94%
31.82%
31.90%
20
23.82%
10
0
Border exchange
Sleep under mosquito net at home
Sleeping in the woods
Sleeping in the field
Ever had malaria
Yes No
Figure 3.6. Malaria parasite infection rate distributed by epidemiological factors
The rate of malaria parasite infection in subjects with border exchanges was 32.94%, higher than that of subjects without exchanges at 22.71%, and the rate of malaria parasite infection in subjects who slept in the forest was 47.76%, while those who did not sleep in the forest had an infection rate of 21.52%. The rate of malaria parasite infection in subjects who slept in the fields was 31.82%, while those who did not sleep in the fields had an infection rate of 21.81%. On the other hand, subjects with a history of malaria had a rate of malaria parasite infection of 30.91%, and subjects who had never had malaria had an infection rate of 20.74%. In subjects who regularly slept under mosquito nets at home at night at the research site, the rate of malaria parasite infection in these subjects was 23.82%, while those who did not sleep under mosquito nets or did not regularly had an infection rate of 28.57%.
3.1.5. Describe some factors related to the rate of malaria parasite infection at the study site
Table 3.6. Description of some factors related to malaria parasite infection rate with general characteristics of the study subjects
Parasitic infection (n= 750)
Variable | Have (%) n=179 | Are not (%) n=571 | OR | CI 95% | P | |
Gender calculate | Male | 91 (27.08) | 245 (72.92) | 1.38 | 0.97-1.95 | 0.06 |
Female | 88 (21.26) | 326 (78.74) | ||||
Group year old | <5 years old | 05 (17.86) | 23 (82.14) | 1 | ||
5 - 15 years old | 39 (22.94) | 131 (77.06) | 1.37 | 0.49-3.84 | 0.55 | |
>15 years old | 135 (24.46) | 417 (75.54) | 1.49 | 0.56-3.99 | 0.43 | |
Terrible | 74 (22.16) | 260 (77.84) | 1 | |||
S'tieng | 76 (24.28) | 237 (75.72) | 1.13 | 0.78-1.62 | 0.52 | |
Nation | Tay, Nung, Dream Farmer | 19 (36.54) | 33 (63.46) | 2.02 | 1.09-3.76 | 0.03 |
Other ethnic groups | 10 (19.61) | 41 (80.39) | 0.86 | 0.41-1.79 | 0.68 | |
Farming | 85 (28.72) | 211 (71.28) | 1 | |||
Forestry | 21 (39.62) | 32 (60.38) | 1.63 | 0.89-2.98 | 0.11 | |
Profession career | Trade | 04 (15.38) | 22 (84.62) | 0.45 | 0.15-1.35 | 0.15 |
Housewife | 05 (17.24) | 24 (82.76) | 0.52 | 0.19-1.40 | 0.19 | |
Pupil | 31 (22.14) | 109 (77.86) | 0.71 | 0.44-1.31 | 0.15 | |
Other | 33 (16.02) | 173 (83.98) | 0.47 | 0.30-0.74 | 0.001 | |
The rate of malaria parasite infection in the Tay, Nung, and Mo Nong ethnic groups was 2.02 times higher than that of the Kinh ethnic group, and the rate of malaria parasite infection in those with other occupations was only 0.47 times higher than that of the farming group, the difference was statistically significant p<0.05.
The rate of KSTSR infection between gender and age groups in the study was not statistically different, p>0.05.