APPENDIX 2 (CONTENT 2)
2.1 Linear curve of microbial density with OD 600nm
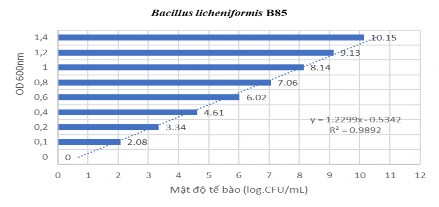
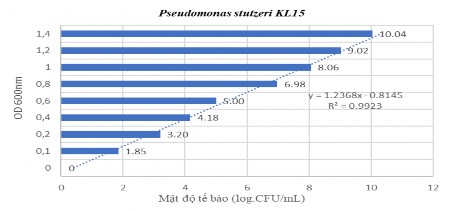
Figure 2.1 Linear curve of Bacillus licheniformis B85 bacteria
Figure 2.2 Linear curve of P. stutzeri KL15 bacteria
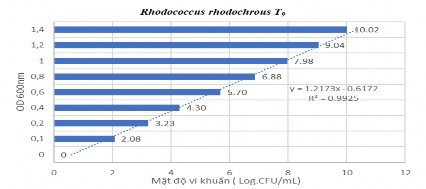
Figure 2.3 Linear curve of R. rhodochrous T 9 bacteria
2.2 Biomass human environment components
Luria Bertani (LB) medium
Ingredient
g/l | |
Peptone | 10 |
Yeast extract | 5 |
NaCl | 10 |
Maybe you are interested!
-

 Summary of Sem Linear Structural Model Data
 -
 Results of Linear Regression Analysis on Factors Affecting Land Complaints in Vinh City
 -
 Simple Iteration Method to Solve Linear Equations
 -
 Detecting Essential Assumption Violations in Linear Regression
 -
 Design of Linear Phase Fir Filter Using Window
Nutrient Broth (NB)
Ingredient
g/l | |
Meat height | 1.5 |
Yeast extract | 1.5 |
Peptone | 5 |
NaCl | 5 |
Tryptic soybean broth (TSB) medium
Ingredient
g/l | |
Tryptose | 17 g |
Papaic Digest Soybean Meal | 3 g |
NaCl | 5 g |
Dextrose (Glucose) | 2.5 g |
K2HPO4 | 2.5 g |
2.3 Liquid production environment
Based on TSB medium composition, some mineral components were added, balancing the Carbon and glucose content.
Tryptic soybean broth (TSB) production medium
Ingredient
g/l | |
Peptone | 10 g |
Glucose | 10 g |
CaCl2 | 0.2 g |
MgSO 4 | 1g |
K2HPO4 | 2 g |
NaCl | 1 g |
2.4 Semi-solid medium composition
Based on the composition of TSB liquid production medium, some solid components such as rice bran, corn bran, wheat bran, soybean residue are added as technical Nitrogen sources for industrial production (Tran Thi Thanh, 2000; Nguyen Duc Luong, 2006) while still keeping the carbon source as glucose and minerals as the liquid medium optimized for bacterial species. Water is added to about 50% humidity.
Table 2.1 Composition of semi-solid medium
Ingredient
grams | |
Rice bran/corn bran/wheat bran/soybean meal CaCl 2 NaCl K 2 HPO 4 MgSO 4 Glucose | 980 0.2 1 2.5 1 20 |
2.5. Creating liquid preparations
2.5.1 Survey of biomass multiplication conditions of bacterial strains on liquid medium
Table 2.2 Effect of biomass culture medium on three bacterial strains
Status
Bacterial strain | Bacterial density (log.CFU/mL) | |||
Environment | LB | TSB | NB | |
1 | R. rhodochrous T 9 | 8.31b ± 0.04 | 8.37b ± 0.01 | 8.87a ± 0.08 |
2 | B. licheniformis B85 | 8.58b ± 0.02 | 8.84a ± 0.02 | 8.70ab ± 0.13 |
3 | P. stutzeri KL15 | 8.63ab ± 0.08 | 8.86a ± 0.09 | 8.32b ± 0.001 |
Bacterial density (Log10.CFU/mL) is calculated as the logarithm base 10 of the average of 3 replicates. Letters a, b, c indicate statistical differences according to the bacterial strain biomass media (p < 0.01) .
Table 2.3 Effect of seed density on biomass multiplication of three bacterial strains
Status
Bacterial strain | Bacterial density (log.CFU/mL) | ||||
Bacterial density | 10 6 | 10 7 | 10 8 | 10 9 | |
1 | R. rhodochrous T 9 | 8.20c ± 0.03 | 8.69b ± 0.01 | 9.66a ± 0.01 | 9.69a ± 0.01 |
2 | B. licheniformis B85 | 8.30c ± 0.02 | 8.73b ± 0.01 | 9.69a ± 0.02 | 9.75a ± 0.03 |
3
P. stutzeri KL15 | 8.39c ± 0.04 | 8.78b ± 0.01 | 9.66a ± 0.02 | 9.76a ± 0.03 |
Bacterial density (Log10.CFU/mL) is calculated as the logarithm base 10 of the average of 3 replicates. Letters a, b, c indicate statistical differences in the density of bacterial strains (p < 0.01) .
Table 2.4 Effect of growth time on biomass of three bacterial strains
Status
Bacterial strain | Bacterial density (Log.CFU/mL) | |||||
Time | 24 hour | 36 hour | 48 hour | 60 hour | ||
72 hours | ||||||
1 | R. rhodochrous T 9 | 8.53 d ± 0.02 | 9.67a ±0.01 | 9.72a ±0.02 | 9.49a ±0.01 | 9.02 c ±0.01 |
2 | B. licheniformis B85 | 8.49 c ±0.01 | 9.70a ±0.02 | 9.73a ±0.02 | 9.09b ±0.01 | 8.99b ±0.01 |
3 | P. stutzeri KL15 | 8.74 c ±0.02 | 9.70a ± 0.01 | 9.78a ± 0.02 | 9.26b ± 0.01 | 8.70 c ± 0.03 |
Bacterial density (Log10.CFU/mL) is calculated as the logarithm base 10 of the average of 3 replicates. Letters a, b, c indicate statistical differences according to bacterial strain growth time (p < 0.01) .
2.5.2 Survey of biomass multiplication conditions of bacterial strains on liquid production medium (environmental composition section 2.2)
Table 2.5 Effect of inoculum loading ratio on biomass of three bacterial strains
Status
Bacterial strain | Bacterial density (Log.CFU/mL) | ||||
Seed loading rate | 1% | 2.5% | 3.5% | 5% | |
1 | R. rhodochrous T 9 | 9.66b ± 0.01 | 9.98a ± 0.01 | 9.66b ± 0.01 | 9.69b ± 0.01 |
2 | B. licheniformis B85 | 9.66b ± 0.01 | 10.03a ± 0.01 | 9.69b ± 0.03 | 9.75b ± 0.01 |
3 | P. stutzeri KL15 | 9.84b ± 0.07 | 10.07a ± 0.03 | 9.78b ± 0.04 | 9.73b ± 0.04 |
Bacterial density (Log10.CFU/mL) is calculated as the logarithm base 10 of the average of 3 replicates. Letters a, b, c indicate statistical differences in the loading ratio of the same bacterial strain (p < 0.01) .
Table 2.6 Effect of time on biomass of three bacterial strains
Status
Bacterial strain | Bacterial density (Log.CFU/mL) | ||||
Time | 12 hours | 24 hours | 36 hours | 48 hours | |
1 | R.rhodochrous T 9 | 9.66b ± 0.01 | 9.98a ± 0.01 | 10.01a ± 0.01 | 9.98a ± 0.01 |
2 | B. licheniformis B85 | 9.63b ± 0.01 | 10.01a ± 0.01 | 10.03a ± 0.01 | 9.99a ± 0.03 |
3 | P. stutzeri KL15 | 9.75b ± 0.04 | 10.13a ± 0.05 | 10.19a ± 0.01 | 10.07a ± 0.03 |
Bacterial density (Log10.CFU/mL) is calculated as the logarithm base 10 of the average of 3 replicates. Letters a, b, c indicate statistical differences of time according to bacterial strain (p < 0.01) .
Table 2.7 Effect of temperature on biomass of three bacterial strains
Status
Bacterial strain | Bacterial density (Log.CFU/mL) | ||||
Temperature | 30 o C | 33 o C | 35 o C | 37 o C | |
1 | R. rhodochrous T 9 | 9.98ab ± 0.01 | 10.04a ± 0.01 | 9.91 bc ±0.01 | 9.85c ± 0.02 |
2 | B. licheniformis B85 | 10.01ab ± 0.01 | 9.99b ± 0.01 | 10.07a ± 0.01 | 10.05ab ± 0.01 |
3 | P. stutzeri KL15 | 9.87±0.07 | 9.88 ±0.05 | 9.96±0.02 | 10.23±0.03 |
Bacterial density (Log10.CFU/mL) is calculated as the logarithm base 10 of the average of 3 replicates. Letters a, b, c indicate statistical differences according to the temperature of the bacterial strain (p < 0.01) (The P. stutzeri KL15 strain alone is not statistically significant because p>0.05, so no ranking test is performed).
Table 2.8 Effect of pH on biomass of three bacterial strains
Status
Bacterial strain | Bacterial density (Log.CFU/mL) | ||||
pH | 6.0 | 6.5 | 7.0 | 7.5 | |
1 | R. rhodochrous T 9 | 9.98b ± 0.01 | 10.05a ± 0.02 | 9.98a ± 0.01 | 9.78c ± 0.02 |
2 | B. licheniformis B85 | 9.87b ± 0.01 | 9.97a ± 0.01 | 9.98a ± 0.02 | 10.03a ± 0.01 |
3 | P. stutzeri KL15 | 9.85b ± 0.01 | 9.82b ± 0.05 | 10.02a ± 0.02 | 9.87b ± 0.01 |
Bacterial density (Log10.CFU/mL) is calculated as the logarithm base 10 of the average of 3 replicates. Letters a, b, c indicate statistical differences according to pH of bacterial strains (p < 0.01) .
Table 2.9 Effect of nitrogen source on biomass of three bacterial strains
Status
Bacterial strain | Bacterial density (Log.CFU/mL) | ||||
Nitrogen Source | Ammonium sulfate | Yeast extract | Sodium nitrate | peptone | |
1 | R. rhodochrous T 9 | 8.66c ± 0.01 | 9.75b ± 0.02 | 8.50d ± 0.01 | 10.03a ± 0.01 |
2 | B. licheniformis B85 | 8.55c ± 0.01 | 10.11a ± 0.03 | 8.68b ± 0.01 | 10.07a ± 0.01 |
3 | P. stutzeri KL15 | 8.20b ± 0.05 | 10.08a ± 0.02 | 8.03b ± 0.06 | 10.00a ± 0.04 |
Bacterial density (Log10.CFU/mL) is calculated as the logarithm base 10 of the average of 3 replicates. Letters a, b, c indicate statistical differences according to nitrogen source of bacterial strains (p < 0.01) .
Table 2.10 Effect of carbon source on biomass of three bacterial strains
Status
Bacterial strain | Bacterial density (Log.CFU/mL) | ||||
Carbon Source | Glucose | Maltodextrin | Molasses | Sucrose | |
1 | R.rhodochrous T9 | 10.07a ± 0.01 | 8.65c ± 0.01 | 9.75b ± 0.02 | 8.50d ± 0.01 |
2 | B. licheniformis B85 | 10.10a ± 0.02 | 8.68b ± 0.01 | 10.11a ± 0.2 | 8.55c ± 0.01 |
3 | P. stutzeri KL15 | 9.24b ± 0.05 | 9.28b ± 0.04 | 9.41a ± 0.06 | 8.75c ± 0.05 |
Bacterial density (Log10.CFU/mL) is calculated as the logarithm base 10 of the average of 3 replicates. Letters a, b, c indicate statistical differences according to carbon source of bacterial strain (p < 0.01) .
Investigation of carbon and nitrogen source contents of three bacterial strains.
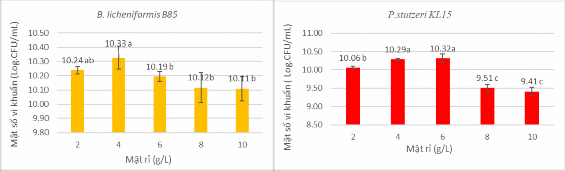
Figure 2.4 Investigation of molasses content of B.licheniformis B85 Figure 2.5 Investigation of molasses content of P. stutzeri KL15
Figure 2.6 Investigation of molasses content of R.rhodochrous T9 Figure 2.7 Investigation of high yeast content of B.licheniformis B85
Figure 2.8 Survey of high yeast content of P. stutzeri KL15 Figure 2.9 Survey of peptone content of R. rhodochrous T9
Purpose : The survey of carbon and nitrogen source content is to survey and select the content ranges.
The content of molasses and yeast extract gave the highest density of B. licheniformis B85 and P. Stutzeri KL15 bacteria , and the content of peptone and glucose gave the highest density of R. rhodochrous T9 bacteria, to arrange in the experiment to optimize the composition of liquid production medium for 3 bacterial strains. This is the intermediate experiment after selecting the best C and N sources, to have the best choice, move to the optimization content.
2.5.3 Optimizing the production environment of bacterial strains
Screening of significant factors using Plackett – Burman matrix Bacillus licheniformis B85 Table 2.11 Variables in Plackett - Burman matrix and their influence
Sign | Level | Level of influence | ||||
effect | Element | Unit | Low (-1) | (-1) | High | Image Prob>F enjoy |
X1 | Molasses | g/L | 2 | 6 | 0.0433a 0.0182 | |
X2 | Yeast extract | g/L | 9 | 25 | -0.06a 0.0050 | |
X3 | K2HPO4 | g/L | 1.25 | 5.00 | -1.45862E-15 b 1.0000 | |
X4 | MgSO4 | g/L | 0.25 | 1.50 | 1.46724E- 15b 1.0000 | |
X5 | CaCl2 | g/L | 0.05 | 0.40 | 0.0033 b 0.8013 | |
X6 | NaCl | g/L | 1 | 5 | -0.0633a 0.0040 |
α: significant at confidence level α = 0.05; b : not significant at confidence level α = 0.05
Table 2.12 Plackett – Burman design matrix
Solution Variables
Bacterial density (Log.CFU/ml)
awake
X1 | X2 | X3 | X4 | X5 | X6 | Experiment | Model | |
1 | 1 | -1 | 1 | 1 | -1 | 1 | 10.12 | 10.10 |
2 | 1 | 1 | -1 | 1 | 1 | 1 | 10.03 | 10.04 |
3 | -1 | 1 | 1 | -1 | 1 | 1 | 10.01 | 9.99 |
4 | -1 | -1 | -1 | -1 | -1 | -1 | 10.13 | 10.12 |
5 | -1 | -1 | 1 | -1 | 1 | 1 | 10.04 | 10.05 |
6 | -1 | -1 | -1 | 1 | -1 | 1 | 10.03 | 10.05 |
7 | -1 | 1 | -1 | 1 | 1 | -1 | 10.07 | 10.06 |
8 | 1 | 1 | 1 | -1 | -1 | -1 | 10.08 | 10.10 |
9 | -1 | -1 | 1 | 1 | 1 | -1 | 10.16 | 10.16 |
10 | 1 | 1 | -1 | -1 | -1 | 1 | 10.04 | 10.04 |
11 | 1 | -1 | -1 | -1 | 1 | -1 | 10.16 | 10.16 |
12 | -1 | 1 | 1 | 1 | -1 | -1 | 10.05 | 10.06 |
Table 2.13 Coefficients in the objective function equation
Element
Estimated coefficient | Degrees of freedom | Standard error | 95% CI low | 95% CI high | VIF | |
Intercept | 11.42 | 1 | 0.0093 | 11.40 | 11.44 | |
A- Molasses | 0.0386 | 1 | 0.0068 | 0.0211 | 0.0560 | 1.43 |
B-Yeast extract | -0.0188 | 1 | 0.0057 | -0.0334 | -0.0041 | 1,0000 |
-0.0439 | 1 | 0.0068 | -0.0614 | -0.0265 | 1.38 | |
AB | 0.0250 | 1 | 0.0080 | 0.0043 | 0.0457 | 1,0000 |
AC | 0.0404 | 1 | 0.0109 | 0.0122 | 0.0685 | 1.73 |
BC | 0.0425 | 1 | 0.0080 | 0.0218 | 0.0632 | 1,0000 |
A² | -0.0673 | 1 | 0.0092 | -0.0908 | -0.0438 | 1.21 |
B² | -0.1577 | 1 | 0.0092 | -0.1812 | -0.1342 | 1.21 |
C² | -0.0248 | 1 | 0.0092 | -0.0483 | -0.0013 | 1.21 |
Screening of significant factors using Plackett – Burman matrix Pseudomonas stutzeri KL15
Table 2.14 Variables in the Plackett - Burman matrix and their effects
Level of influence
SignElement | Unit | |||||
Short | High | Image | ||||
effect | ||||||
Prob>F | ||||||
(-1) | (-1) | enjoy | ||||
X1 | Molasses | g/L | 2 | 6 | 0.55a | 0.0002 |
X2 | Yeast extract | g/L | 9 | 25 | 0.32a | 0.0029 |
X3 | K2HPO4 | g/L | 1.25 | 5.00 | 0.03b | 0.6502 |
X4 | MgSO4 | g/L | 0.25 | 1.50 | 0.25a | 0.0079 |
X5 | CaCl2 | g/L | 0.05 | 0.40 | 0.09b | 0.1933 |
X6 | NaCl | g/L | 1 | 5 | -0.15b | 0.0568 |
α: significant at confidence level α = 0.05; b : not significant at confidence level α = 0.05
Table 2.15 Plackett - Burman design matrix
Bacterial density
Solution Variables
(Log.CFU/ml)
awake
X 1 | X 2 | X 3 | X 4 | X 5 | X 6 | Experiment | Model | |||||||
1 | 1 | 1 | -1 | -1 | -1 | 1 | 10.19 | 10.10 | ||||||
2 | -1 | 1 | -1 | 1 | 1 | -1 | 10.01 | 10.04 | ||||||
3 | 1 | -1 | 1 | 1 | -1 | 1 | 10.05 | 10.06 | ||||||
4 | 1 | 1 | -1 | 1 | 1 | 1 | 10.36 | 10.44 | ||||||
5 | -1 | 1 | 1 | -1 | 1 | 1 | 9.69 | 9.67 | ||||||
6 | 1 | 1 | 1 | -1 | -1 | -1 | 10.16 | 10.27 | ||||||
7 | -1 | -1 | 1 | -1 | 1 | 1 | 9.33 | 9.35 | ||||||
8 | -1 | 1 | 1 | 1 | -1 | -1 | 10.08 | 9.98 | ||||||
9 | -1 | -1 | -1 | -1 | -1 | -1 | 9.31 | 9.38 | ||||||
10 | -1 | -1 | -1 | 1 | -1 | 1 | 9.48 | 9.49 | ||||||
11 | 1 | -1 | -1 | -1 | 1 | -1 | 10.10 | 10.01 | ||||||
12 | 1 | -1 | 1 | 1 | 1 | -1 | 10.31 | 10.29 |
Table 2.16 Coefficients in the objective function equation
Element
Estimated coefficient | Degrees of freedom | Standard error | 95% CI short | 95% CI High | VIF | |
Intercept | 11.55 | 1 | 0.0044 | 11.52 | 11.56 | |
A- Molasses | 0.155 | 1 | 0.0067 | 0.0150 | 0.0518 | 1,0000 |
B-Yeast extract | 0.043 | 1 | 0.0087 | 0.0011 | 0.019 | 1,0000 |
C - Mg2SO4 | 0.058 | 1 | 0.0070 | 0.0027 | 0.089 | 1,0000 |
0.0255 | 1 | 0.0038 | 0.0114 | 0.0546 | 1,0000 | |
AC | 0.0125 | 1 | 0.0038 | 0.0173 | 0.0023 | 1,0000 |
BC | 0.01 | 1 | 0.0038 | 0.0148 | 0.0048 | 1,0000 |
A² | -0.1675 | 1 | 0.0040 | -0.1748 | -0.1544 | 1.01 |
B² | -0.095 | 1 | 0.0040 | -0.1773 | -0.1569 | 1.01 |
C² | -0.110 | 1 | 0.0040 | -0.1898 | -0.1694 | 1.01 |
Screening of significant factors using Plackett – Burman matrix Rhodococcus rhodochrous T 9Table 2.17 Variables in the Plackett - Burman matrix and their effects
Sign | Level | Image level | enjoy | ||||
Element | Unit | ||||||
Short | High | Image | |||||
effect | |||||||
Prob>F | |||||||
(-1) | (-1) | enjoy | |||||
X1 | Glucose | g/L | 6 | 10 | 0.0683a | 0.042 | |
X2 | Peptone | g/L | 4 | 8 | 0.0683a | 0.042 | |
X3 | K2HPO4 | g/L | 1.25 | 5.00 | -0.0083b | 0.5713 | |
X4 | MgSO 4 | g/L | 0.25 | 1.50 | 0.005 b | 0.7313 | |
X5 | CaCl2 | g/L | 0.05 | 0.40 | 0.015 b | 0.3255 | |
X6 | NaCl | g/L | 1 | 5 | -0.075a | 0.0028 |
a : significant at confidence level α = 0.05; b : not significant at confidence level α = 0.05
Table 2.18 Plackett - Burman design matrix
Solution Variables
Bacterial density (Log10. CFU/ml)
awake
X 1 | X 2 | X 3 | X 4 | X 5 | X 6 | Experiment | Model | |
1 | -1 | -1 | -1 | 1 | -1 | 1 | 9.87 | 9.89 |
2 | 1 | 1 | -1 | -1 | -1 | 1 | 10.03 | 10.03 |
3 | 1 | 1 | 1 | -1 | -1 | -1 | 10.06 | 10.10 |
4 | -1 | -1 | 1 | -1 | 1 | 1 | 9.87 | 9.89 |
5 | 1 | 1 | -1 | 1 | 1 | 1 | 10.04 | 10.03 |
6 | 1 | -1 | 1 | 1 | 1 | -1 | 10.05 | 10.03 |
7 | -1 | -1 | -1 | -1 | -1 | -1 | 9.98 | 9.96 |
8 | 1 | -1 | 1 | 1 | -1 | 1 | 9.96 | 9.96 |
9 | -1 | 1 | 1 | 1 | -1 | -1 | 10.03 | 10.03 |
10 | -1 | 1 | -1 | 1 | 1 | -1 | 10.04 | 10.03 |
11 | -1 | 1 | 1 | -1 | 1 | 1 | 9.98 | 9.96 |
12 | 1 | -1 | -1 | -1 | 1 | -1 | 10.04 | 10.03 |
Table 2.19 Coefficients in the objective function equation
Element
Estimated coefficient | Degrees of freedom | Standard error | 95% CI short | 95% CI High | VIF | |
Intercept | 10.47 | 1 | 0.0044 | 10.46 | 10.48 | |
A-Glucose | -0.0088 | 1 | 0.0027 | -0.0157 | -0.0018 | 1,0000 |
B-Peptone | 0.0150 | 1 | 0.0027 | 0.0081 | 0.0219 | 1,0000 |
C-NaCl | -0.0088 | 1 | 0.0027 | -0.0157 | -0.0018 | 1,0000 |
AB | -0.0500 | 1 | 0.0038 | -0.0598 | -0.0402 | 1,0000 |
-0.0075 | 1 | 0.0038 | -0.0173 | 0.0023 | 1,0000 | |
BC | -0.0050 | 1 | 0.0038 | -0.0148 | 0.0048 | 1,0000 |
A² | -0.1646 | 1 | 0.0040 | -0.1748 | -0.1544 | 1.01 |
B² | -0.1671 | 1 | 0.0040 | -0.1773 | -0.1569 | 1.01 |
C² | -0.1796 | 1 | 0.0040 | -0.1898 | -0.1694 | 1.01 |
2.6. Creating powder products
2.6.1 Survey of factors affecting the production process on semi-solid medium. Table 2.20 Effects of environment on the biomass of three bacterial
Status
Bacterial strain | Bacterial density ( Log10.CFU/mL) | ||||
Environment | Rice bran | Corn bran | Soybean residue | Wheat bran | |
1 | R. rhodochrous T 9 | 9.02a ± 0.01 | 8.88b ± 0.02 | 8.53c ± 0.02 | 8.93ab ± 0.02 |
2 | B. licheniformis B85 | 8.91b ± 0.02 | 8.80 bc ±0.05 | 9.47a ± 0.05 | 8.58c ± 0.06 |
3 | P. stutzeri KL15 | 8.75 bc ±0.04 | 9.10a ± 0.04 | 8.85ab ± 0.02 | 8.53c ± 0.08 |
Bacterial density (Log.CFU/gram) is calculated as the logarithm base 10 of the average of 3 replicates. Letters a, b, c indicate statistical differences according to bacterial strain environment (p < 0.01) .
Table 2.21 Effect of seed ratio on biomass of three bacterial strains
Status
Bacterial strain | Bacterial density (Log.CFU/g) | ||||
Breeding ratio | |||||
2.5% | 5% | 7.5% | 10% | ||
1 | R. rhodochrous T 9 | 8.27b ± 0.1 | 9.02a ± 0.01 | 9.23a ± 0.04 | 9.26a ± 0.04 |
2 | B. licheniformis B85 | 8.40b ± 0.04 | 9.47a ± 0.01 | 9.54a ± 0.05 | 9.50a ± 0.01 |
3 | P. stutzeri KL15 | 8.43c ± 0.01 | 9.10b ± 0.04 | 9.30a ± 0.03 | 9.34a ± 0.05 |
Bacterial density (Log.CFU/gram) calculated as the logarithm base 10 of the average of 3 replicates. Letters a, b, c indicate statistical differences in the similarity ratio of bacterial strains (p < 0.01) .
Table 2.22 Effect of humidity on biomass of three bacterial strains
Status
Bacterial strain | Bacterial density (Log.CFU/g) | ||||
Humidity | 45% | 50% | 55% | 60% | |
1 | R. rhodochrous T 9 | 8.27c ± 0.07 | 9.03a ± 0.01 | 9.15a ± 0.04 | 8.57b ± 0.01 |
2 | B. licheniformis B85 | 8.44c ± 0.06 | 9.47a ± 0.01 | 9.56a ± 0.05 | 8.74b ± 0.02 |
3 | P. stutzeri KL15 | 8.40d ± 0.01 | 9.14b ± 0.03 | 9.30a ± 0.03 | 8.84c ± 0.02 |
Bacterial density (Log.CFU/gram) calculated as the logarithm base 10 of the average of 3 replicates. Letters a, b, c indicate statistical differences according to the humidity of the bacterial strains (p < 0.01) .
Table 2.23 Effect of time on biomass of three bacterial strains
Status
Bacterial strain | Bacterial density (Log.CFU/g) | ||||||
Time | 36 hour | 48 hour | 60 hour | 72 hour | 84 hour | 96 hour | |
1 | R.rhodochrous T 9 | 8.27 d ± 0.1 | 9.23b ±0.04 | 9.30b ± 0.05 | 9.79a ±0.02 | 9.24b ±0.02 | 8.94 c ±0.01 |
2 | B. licheniformis B85 | 8.44 d ±0.06 | 9.56b ±0.01 | 9.96a ± 0.01 | 9.93a ±0.02 | 9.57b ±0.02 | 9.10 c ±0.01 |
3 | P. stutzeri KL15 | 8.40 e ±0.01 | 9.30 c ±0.03 | 9.44 bc ± 0.06 | 9.70a ±0.01 | 9.50b ±0.02 | 9.12 d ±0.01 |
Bacterial density (Log.CFU/gram) is calculated as the logarithm base 10 of the average of 3 replicates. Letters a, b, c indicate statistical differences over time of bacterial strains (p < 0.01).
2.6.2 Survey of storage conditions of bacterial strains on semi-solid media Table 2.24 Effect of time on biomass of three bacterial
Bacterial density
Temperature ( oC ) | Time | B. licheniformis B85 | P. stutzeri KL15 | R.rhodochrous T 9 |
(day) | (log.CFU/g) | (log.CFU/g) | (log.CFU/g) | |
0 | 9.72 ± 0.01 | 9.52 ±0.05 | 9.26 ± 0.03 | |
30 | 9.61 ± 0.03 | 9.36 ± 0.02 | 9.18 ± 0.01 | |
4 - 8 | 60 | 9.42 ± 0.02 | 9.26 ± 0.03 | 9.07 ± 0.02 |
90 | 9.21 ± 0.03 | 9.11 ± 0.01 | 8.93 ± 0.03 | |
120 | 9.11 ± 0.02 | 8.94 ± 0.01 | 8.79 ± 0.05 |