- In addition to the causes of formation, the rainfall regime is also influenced by climatic factors and surface characteristics. Among the climatic factors affecting rainfall, the wind regime plays the most important role. In the northern provinces of our country, in winter, the northeast monsoon brings cold and dry air from the northern continent, so rainfall is low and the intensity of rain is low. In summer, hot and humid air masses dominate, in addition to weather patterns that cause rain such as storms, tropical convergence zones, ... often causing heavy rain. The northeast monsoon from the sea causes heavy rain in the central provinces. Wind direction and wind speed are factors affecting the rainfall regime. Researching statistical data in [9], the average main wind direction velocity in the rainy months of the year is often 1.5 - 2 times greater than the average annual wind velocity and they themselves affect the rainfall regime in our country.
- Among the buffer factors, terrain conditions have the most dominant influence on rain. The terrain that affects rain is the height and direction of the windward slope. The direction of the windward slope created by the terrain causes a "mountain blocking effect", the air is strongly disturbed, so it rains more on the windward slope than on the leeward slope. The height of the terrain also affects the rainfall regime and amount of rain. Many research results show that when the height increases, the rainfall increases due to the temperature decreasing and the humidity increasing, however, this relationship only exists up to a certain limit height, this limit height in Vietnam is estimated to be 1800 - 2000m [21], [25], [26], [38]. The average height of small basins of small drainage works on roads in our country is often within these limits. Due to the influence of terrain in a region with relatively uniform climate conditions, there may exist areas of heavy rain, often called rain centers. In our country, there are heavy rain centers such as Dong Trieu, Bac Quang, Hoang Lien Son, Tam Dao, Ba Na, Tra Mi, Bach Ma, ... . . , the average annual rainfall in these rain centers is very large, with
can reach over 3000mm, the largest rainfall center in Vietnam is Bach Ma with an average annual rainfall of over 8000mm. The area with high rainfall extending from latitude 150 north to 160 north is called the water latitude. On the contrary, small rainfall centers are formed in low, hidden areas or parallel to the direction of humid winds, such as An Chau, Son La, Muong Xen, Ninh Thuan province, ... The average annual rainfall in these areas is only about 1000mm, especially in Ninh Thuan province, the average annual rainfall is only about 800mm. Areas with low rainfall
The southernmost coastal region of Central Vietnam, from latitude 100 north to 120 north , is a typical low-rainfall region in our country, [15], [25].
- When conducting research and surveying statistical data in [9], which is a data source that was reviewed in 2008, for 54 meteorological stations distributed nationwide, it shows that in our country, places with high average annual rainfall are often at high altitudes and also often have high average main wind speeds during the rainy months of the year. However, there are also many exceptions because the rainfall regime also depends on many other factors.
- In recent years, Vietnam's climate has been greatly affected by climate change, causing negative impacts on the rainfall regime in our country. This is clearly demonstrated through studies in climate change scenarios in our country published by the Ministry of Natural Resources and Environment.
2.2. Introduction to the network of meteorological stations and sources of rainfall data in our country.
- In our country, it was not until the end of the 19th century and the beginning of the 20th century that the system of hydrometeorological observation stations was established by the French, however the number of observation stations was still small, mainly hydrometeorological observation stations on large river systems and measuring water levels. Only since 1959, in the North after liberation, the system of hydrometeorological observation stations was expanded on a large scale and organized to monitor systematically and completely. In the South, meteorological observation data from 1978 - 1980 onwards is reliable because it is complete, continuous and systematic, while for the years from around 1980 onwards, due to historical circumstances, there is no observation data or there is very scattered and lost data, so it is considered to be of low reliability.
- According to the source of the National Center for Hydrometeorology, since 1991 the network of rain gauge stations in our country has been re-planned according to the correct standards. Currently, there are about 172 meteorological stations, 231 hydrological stations, over 400 people's rain gauges in operation (excluding people's rain gauges that have stopped). In total, there are about 800 rain gauges distributed throughout the territory, reaching an average density of about 433 km 2 / rain gauge point nationwide, the densest in the Northern Delta, to the Northern mountainous and midland regions, to the Southern region, to the Central region, the sparsest in the Central Highlands, [26]. Self-recording rain gauges are available at most meteorological stations, accounting for about 20% of the total number of rain gauges, each province has at least 1 meteorological station with a self-recording rain gauge, some provinces have up to 2 - 3 stations, the remaining rain gauges only have daily rainfall measuring equipment.
In recent years, self-recording rain gauges have been invested in and installed at many meteorological stations. Many modern rain measuring machines and technologies have been researched and applied, such as rain measuring technology using weather radar, which can continuously measure rain in an area, ... This has enriched and made more accurate the source of self-recording rain gauge data in our country.
- In the thesis, self-recorded rainfall data were collected at 12 meteorological stations, selecting typical stations for each geographical area nationwide for research as shown in Table 2.1 below.
Table 2.1: Information on rainfall data at 12 meteorological stations selected for study
TT
Geographical Area and Station hydrographic | Selected weather station study | Measurement series rain collect | |
1 | Northwest Region - Northwest Station | 1- Lai Chau Station, Muong Lay Town - Dien Bien Province | 1960 - 2010 50 years |
2 | Viet Bac Region - Viet Bac Radio | 2- Tuyen Quang Station, Tuyen Quang City - Tuyen Quang Province | 1960 - 2010 50 years |
3 | Northeast Region - Northeast Taiwan | 3- Lang Son Station, Lang Son City - Lang Son Province | 1960 - 2010 50 years |
4 | Northern Delta Region - Northern Delta Station | 4- Lang Station - Dong Da District 5- Ha Dong Station - Ha Dong District 6- Son Tay Station, Son Tay Town - All of Hanoi City | 1960 - 2010 1960 - 2010 1960 - 2010 50 years |
5 | Central Taipei Region and Region | 7- Vinh Station, Vinh City - Nghe An Province | 1960 - 2010 50 years |
6 | Central Taichung Region and Region + North Hai Van + South of Hai Van Pass | 8- Dong Hoi Station, Dong Hoi City - Quang Binh Province 9- Da Nang Station, Da Nang City Da Nang | 1960 - 2010 50 years 1980 - 2010 30 years |
7 | Region and Central Tainan | 10- Nha Trang Station, Nha Trang City - Khanh Hoa Province | 1980 - 2010 30 years |
8 | Central Highlands Region - Central Highlands Radio | 11- Buon Ma Thuot Station, Buon Ma Thuot City - Dak Lak Province | 1980 - 2010 30 years |
9 | Southern Region - Taiwan Southern Vietnam | 12- Can Tho Station, Can Tho City Verse | 1980 - 2010 30 years |
Maybe you are interested!
-

 General Introduction About Ba Mien Restaurant In Hilton Hanoi Opera Hotel
 -
 Building a system to monitor water level, temperature and send warnings via SMS/GSM network - 2
 -
 Network design - Master Tran Van Long, Master Tran Dinh Tung Compiled - 24
 -
 Introduction to Saigon Thuong Tin Commercial Joint Stock Bank (Sacombank)
 -
 Introduction to Research Problem
Rainfall data source: National Center for Hydro-Meteorological Forecasting.
Rainfall measurement data, coordinates, and elevations of selected meteorological stations for study can be found in Appendix 11, Thesis Appendix.
Note: According to geographical location characteristics, the National Center for Hydro-Meteorological Forecasting established 9 regional hydro-meteorological stations for 9 geographical regions nationwide.
There are not yet conditions to collect rainfall measurement data at all stations, so each geographical area only collects rainfall measurement data at 1 - 3 selected meteorological stations for analysis and research.
- The characteristics of rain collected in this thesis mainly focus on factors related to the design and construction of drainage works on roads. Specifically collected:
1) The largest annual rainfall period measured on the self-recording rain gauge at meteorological stations for each year, from 1960 to 2010. The period selected to collect data on the largest annual rainfall period is required to survey the law of rainfall and rainfall intensity changing over time and calculated rainfall frequency, specifically collecting the largest annual rainfall period at the periods T = 5min, 10min, 20min, 30min, 60min, 180min, 360min, 540min, 720min, 1080min, 1440min for each year to survey and serve the calculation to determine the largest calculated rainfall period H T,p , the average largest calculated rainfall period a T,p according to the design frequency.
2) Daily rainfall by day, by month of the year, continuously from 1960 -
2010 at meteorological stations according to the survey requirements of rainfall regime, annual rainfall, monthly rainfall and the largest daily rainfall of the year are required. At the same time, it serves the calculation of determining the calculated daily rainfall H n,p according to the design frequency.
3) Number of rainy days in each month and year at meteorological stations, continuously from year to year
1960 - 2010 according to the request to survey the rainfall regime. The time of day and month of appearance in the year of the largest daily rainfall of the year and of the largest period rainfall of the year in the periods T selected for survey at meteorological stations each year, from 1960 - 2010 according to the request to survey and compare the rule between the largest daily rainfall of the year H day max and the average rainfall intensity of the period calculated to be the largest of the year a T max .
- Based on the above rain documents, calculate, analyze and research the regulations.
The law of changing parameters of rainfall and solving the problems raised in the thesis.
2.3. Study on the characteristics of rainfall changes affected by climate change and its influence on calculating flood peak flow for designing small drainage works on roads.
2.3.1. Problem statement.
Rainfall is both random and cyclical. Randomness is expressed in the appearance of a specific value at a certain time, cyclical reflects the law of change of the average trend over long periods of time. Rainfall regime can be understood as the regular change of rain over space and time. Important characteristic parameters of rain are often used in calculating flood flow.
In the basin, the daily rainfall and rainfall intensity are the two parameters, so it is necessary to focus on clarifying these two parameters when studying the rainfall regime in our country in calculating flood flow of small drainage works on roads.
With a very long series of actual rainfall data collected, up to 50 years, continuously from 1960 - 2010, the research results ensure the necessary reliability, consistent with the current weather developments in the area of typical meteorological stations selected for research.
2.3.2. Research content.
The research was conducted on the following contents and evaluation criteria.
2.3.2.1. Rainy season, dry season.
- The rainy season in our country slows down from north to south. In the North, the rainy season is usually from May to September, in the North Central region, the rainy season is usually from August to December, then it slows down and in the South Central region, it is usually from September to December, in the Central Highlands, the same latitude but the rainy season is similar to the North, in the South, the rainy season is from April, May to October, November. In short, except for the Central coastal region, where the rainy season starts the latest due to the terrain of the Truong Son range combined with the northeast circulation, most of our country's territory has a rainy season starting from April, May and ending in October, November. Although the rainy season varies in length, ranging from 4 to 6 months, up to 70 - 90% of the annual rainfall is concentrated in the rainy season [25], [26], [38].
- To distinguish between the rainy and dry seasons in a year, the thesis uses the criterion of "exceeding losses" which is consistent with the actual rainfall in our country [34]. According to this criterion: the rainy season is the season consisting of consecutive months with rainfall exceeding losses (usually taken as 100 mm/month) with a frequency exceeding p 50%.
Meaning: p{ (H months ) i 100 mm/month } 50%
with: (H months ) i is the monthly rainfall of the month to be classified (mm/month) 100 mm/month is the recommended loss value used when classifying rainy seasons in our country, according to research by Professor Ngo Dinh Tuan in [34].
- Research results on the rainy season in the year on the series of rainfall data collected from 1960 - 2010 at 12 typical meteorological stations selected for research are shown in Table 2.2. It is found that the overall rainy season in our country has not shifted or changed compared to previous research results, however, there are fluctuations in recent years.
here. The average rainfall during the rainy months of the year at the surveyed meteorological stations with actual rainfall measurements from 1960 - 2010 ranges from 61.2% - 93%.
2.3.2.2. Months with many rainy days, few rainy days.
- To distinguish months with many rainy days and few rainy days, use the classification coefficient K rainy-many-days .
N ladder
K buy
buy - many - now30
In which: N monthly rain is the number of rainy days in the month (days) 30 is the number of days in the month.
Distinguish months with many rainy days and few rainy days as follows.
Months with few rainy days: K rainy-many-days < 0.5 Months with many rainy days: K rainy-many-days 0.5
- Research results on months with many and few rainy days on rainfall measurement data series from 1960 to 2010 at 12 selected meteorological stations, compared with research results on rainy and dry season months as summarized in Table 2.2 below.
Table 2.2: Summary of research results on months with many rainy days in a year, compared with research results on rainy months in a year at 12 meteorological stations selected for research from 1960 - 2010
TT
Meteorological station, place name | Month of many rainy days per year (average) | Rainy month per year (average) | |||
Number of months | Time of appearance | Number of rainy season months | Rainy season | ||
1 | Muong Lay Town Station | 4 months | T5 T8 | 6 months | T4 T9 |
2 | Tuyen Quang City Station | 6 months | T3 T8 | 7 months | T4 T10 |
3 | Lang Son City Station | 4 months | T5 T8 | 5 months | T5 T9 |
4 | Lang Station - Hanoi | 6 months | T3 T8 | 6 months | T5 T10 |
5 | Ha Dong Station - Hanoi | 6 months | T3 T8 | 6 months | T5 T10 |
6 | Son Tay Station – Hanoi | 6 months | T3 T8 | 6 months | T5 T10 |
7 | Vinh City Station | 4 months | T2 ₮ T3 & T9 ₮ T10 | 4 months | T8 T11 |
8 | Dong Hoi City Station | 4 months | T9 T12 | 4 months | T8 T11 |
9 | Da Nang City Station | 4 months | T9 T12 | 5 months | T8 T12 |
10 | Nha Trang City Station | 4 months | T9 T12 | 6 months | T7 T12 |
11 | Buon Ma Thuot City Station | 6 months | T5 T10 | 6 months | T5 T10 |
12 | Can Tho City Station | 7 months | T5 T11 | 7 months | T5 T11 |
- Comment.
The rainy season month is not necessarily the month with many rainy days and vice versa. This shows that the rainfall is not evenly distributed on rainy days but is concentrated in a few heavy rains.
For meteorological research stations from Hai Van Pass to the North, there is no complete overlap between the rainy season months and the months with many days of rain. For research stations from Hai Van Pass to the South, there is basically an overlap between the rainy season months and the months with many days of rain in terms of the number of months and the time of occurrence, that is, the rainy season months are often the months with many days of rain. However, in the observation data series, there are still years with a discrepancy between the rainy season months and the months with many days of rain at the survey stations in the South, but the degree of discrepancy is not very large, the number of years with discrepancy also accounts for a small proportion in the observation data series, this discrepancy at stations in different regions is also approximately the same.
2.3.2.3. Trends and levels of variation in annual rainfall and number of rainy days per year.
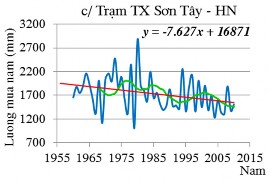
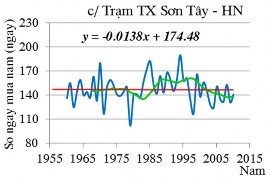
- Draw a trend line of average variation over time (by year) of the surveyed rainfall quantity. The slope of the trend line indicates the nature and level of increase or decrease over time of the surveyed quantity. A positive slope indicates an increasing trend over time, a negative slope indicates a decreasing trend over time. The larger the absolute value of the slope, the stronger the increasing or decreasing trend over time and vice versa.
To clarify the trend and level of variation in each period, and to discover the cyclical oscillation pattern of the surveyed rainfall, a 5-year double moving average was used [14], [28].

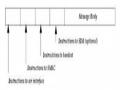
- Figure 2.1 and Figure 2.2 below are examples of finding the trend of variation over time of annual rainfall parameters H year and number of rainy days per year at Lang station, Ha Dong and Son Tay town of Hanoi city during the period from 1960 - 2010. The points marked '' '' are recent years with unusually large annual rainfall.
The synthesis of research results on the series of rainfall measurement data from 1960 - 2010 at 12 selected meteorological stations shows the trend and level of variation over time of annual rainfall and number of rainy days in a year as shown in Table 2.3 below.
- Comments.
Average annual rainfall at research stations from 1960 - 2010 ranged from 1300 - 2300 mm, the lowest at Lang Son city station was 1314mm/year, then at
Nha Trang City 1403mm/year, highest at Da Nang City station 2285mm/year, then Dong Hoi City station 2180mm/year, Muong Lay Town station 2116mm/year, Vinh City station 2040mm/year. The average number of rainy days per year at the research stations ranges from 121 - 159 days, accounting for 33 - 45% of the total number of days in the year, usually from 40 - 42%. Looking at Table 2.3, the trend and level of variation over time of annual rainfall and number of rainy days in the year appear to increase and decrease.
y
x
y
x
ul
Figure 2.1: Trend of annual rainfall variation at Lang station, Ha Dong station, Son Tay town station of Hanoi city from 1960 - 2010
Figure 2.2: Trend of variation in the number of rainy days per year at Lang station, Ha Dong station, Son Tay town station of Hanoi city from 1960 - 2010
Markers
'' ''
are the large spikes that have occurred in recent years.
Actual measurement, Average trend line, 5-year double moving average Data source: National Center for Hydro-Meteorological Forecasting