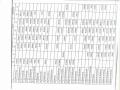
2.2.4.3. Group of performance indicators
Table 2.9: Table of performance indicators
INDICATORS
Unit | 2018 | 2019 | Comparison 2019/2018 | ||
Amount | % | ||||
1. Average receivables | Trđ | 31,830 | 43,933 | 12.103 | 38.02 |
- Beginning of year number | Trđ | 28,484 | 35,175 | 6,691 | 23.49 |
- Year-end number | Trđ | 35,175 | 52,811 | 17,636 | 50.14 |
2. Net revenue | Trđ | 737,575 | 775,247 | 37,672 | 5.11 |
3. Average inventory | Trđ | 85,092 | 82,965 | -1.813 | -2.16 |
- Beginning of year number | Trđ | 86,312 | 83,871 | -2.441 | -2.83 |
- Year-end number | Trđ | 83,871 | 82,058 | -1.813 | -2.16 |
4. Accounts receivable turnover = (2)/(1) | Time | 23.17 | 17.65 | -5.52 | |
5. Average collection period = 360/(3) | Day | 15.53 | 20.40 | 4.87 | |
6. Inventory turnover = (2)/(3) | Time | 8.67 | 9.34 | 0.67 | |
7. Number of days for inventory turnover = 365/(6) | Day | 42.10 | 39.08 | -3.02 | |
Maybe you are interested!
-

 Preparing and presenting consolidated financial statements at Saigon Tourist Corporation Limited - Current situation and solutions for improvement - 1
 -
 Preparing and presenting consolidated financial statements at Saigon Tourist Corporation Limited - Current situation and solutions for improvement - 29
 -
 General Theoretical Basis of Corporate Finance and Corporate Financial Analysis.
 -
 General Assessment of the Current Situation of Public Investment Capital Management at the Ministry of Health in the Period 2016 - 2020
 -
 General Assessment and Causes of the Current Situation of Management of Training Activities for Homeroom Teachers at High Schools in Binh Minh Town,
(Source: Finance - Accounting Department) Through the analysis table of performance indicators, we see:
The turnover of receivables has been decreasing over the years. The decrease in the turnover of receivables is due to the fact that the growth rate of net revenue is slower than the growth rate of receivables from customers. The tendency of the turnover of receivables to decrease shows that customers are occupying the company's capital for a long time, which negatively affects the company's ability to rotate capital in business.
The average collection period has increased over the years but has not had much impact on the company's production and business activities. The company always reserves a number of highly liquid assets, so it can completely ensure that customers pay late at the present time.
Inventory turnover in 2018 and 2019 showed signs of increasing. Specifically, in 2019, this indicator increased by 0.67 times compared to 2018. It can be seen that this indicator increased because the cost of goods sold tended to increase, while the company's inventory tended to decrease, leading to an increase in inventory turnover. This means that the company's customers can occupy capital longer, thereby attracting new customers, causing the company's consumption of goods to increase.
It can be seen that the inventory turnover time has decreased, which shows that the company's sales situation is faster than previous years as a result of the payment extension policy, accepting customers to pay longer, thereby reducing the inventory turnover time over three years, avoiding the situation of goods stagnation.
Table 2.10: Asset utilization efficiency table
INDICATORS
Unit | 2017 | 2018 | 2019 | Comparison 2018/2017 | Comparison 2019/2018 | |||
Amount | % | Amount | % | |||||
1. Net revenue | Trđ | 676,798 | 737,575 | 775,247 | 60,777 | 8.98 | 37,672 | 5.11 |
2. Current assets | Trđ | 197,275 | 209,634 | 227,546 | 12,359 | 6.26 | 17,912 | 8.54 |
3. Long-term assets | Trđ | 104.108 | 107,465 | 109,556 | 3,357 | 3.22 | 2,091 | 1.95 |
4. Total assets | Trđ | 301,383 | 317,099 | 337.102 | 15,716 | 5.21 | 20,003 | 6.31 |
5. Efficiency of using TSNH = (1)/(2) | Ring | 3.43 | 1.78 | 3.41 | -1.65 | 1.63 | ||
6. TSDH utilization efficiency = (1)/(3) | Ring | 6.50 | 3.48 | 7.08 | -3.02 | 3.6 | ||
7. Total asset utilization efficiency = (1)/(4) | Ring | 2.25 | 1.18 | 2.30 | -1.07 | 1.12 | ||
8. Average working capital | Trđ | 85,187 | 94,794 | -9.607 | -11.28 | |||
- Beginning of year number | Trđ | 81,030 | 89,343 | -8.313 | -10.26 | |||
- Year-end number | Trđ | 89,343 | 100,244 | 10,901 | 12.20 | |||
9. Working capital turnover = (1)/(8) | Ring | 8.66 | 8.18 | -0.48 | ||||
(Source: Finance - Accounting Department)
49
Through the analysis table above we see:
- The efficiency of using short-term assets in the period of 2017 - 2019 tends to increase and decrease unevenly. In 2017, it was 3.43 times; in 2018, it was 1.78 times; in 2019, it was 3.41 times. Specifically, in 2018, the efficiency of using short-term assets decreased by 1.65 times compared to 2017, but in 2019, this efficiency increased by 1.63 times compared to 2018. This shows that in 2019, the company managed short-term assets effectively.
- The efficiency of long-term asset usage in 2017 was 6.50 times; in 2018 it was 3.48 times; in 2019 it was 7.08 times. By 2019, the efficiency of long-term asset usage increased by 3.6 times compared to 2018. This shows that the company is effectively managing long-term assets in 2019.
- We see that the company's total asset utilization efficiency in 2017 was 2.25 times and in 2018 it was 1.18 times, a decrease of 1.07 times compared to 2017. But by 2019, the total asset utilization efficiency was 2.30 times, an increase of 1.12 times compared to 2018. This shows that the company is gradually using assets effectively.
Through the analysis of operating indicators, it shows that the company uses capital for business activities better each year than the previous year. The efficiency of total asset utilization continuously increases, showing that the company's capital utilization efficiency is getting higher and higher. However, the company still needs to constantly improve operating indicators, find more customers, strengthen business activities to increase revenue... only then can it create a solid foundation for the company to implement policies and strategies on market expansion.
50
2.2.4.4. Analysis of groups of profitability indicators
Table 2.11: Profitability Index Table
INDICATORS
Unit | 2017 | 2018 | 2019 | Comparison 2018/2017 | Comparison 2019/2018 | |||
Amount | % | Amount | % | |||||
1. Net revenue | Trđ | 676,798 | 737,575 | 775,247 | 60,777 | 8.98 | 37,672 | 5.11 |
2. Profit after tax | Trđ | 23,346 | 25,385 | 27,219 | 2,039 | 8.73 | 1,834 | 7.22 |
3. Equity | Trđ | 184,845 | 196,514 | 209,384 | 11,669 | 6.31 | 12,870 | 6.55 |
4. Total assets | Trđ | 301,383 | 317,099 | 337.102 | 15,716 | 5.21 | 20,003 | 6.31 |
5. ROS = (2/1) | % | 3.45 | 3.41 | 3.51 | 0.18 | 0.01 | ||
6. ROA = (2/4) | % | 7.75 | 8.01 | 8.07 | 0.26 | 0.06 | ||
7. ROE = (2/3) | % | 12.63 | 12.92 | 12.01 | 0.29 | -0.91 | ||
(Source: Finance - Accounting Department)
51
Profitability ratio on revenue: In 2017, every VND 1 net revenue generated VND 3.45 profit after tax, in 2018, every VND 1 net revenue generated VND 3.41 profit after tax, in 2019, every VND 1 net revenue generated VND 3.51 profit after tax. It can be seen that in the three years, the profitability ratio on revenue has tended to increase. However, the rate of generating profit after tax from net revenue is still not high, because the cost of goods sold and other expenses account for a large proportion, causing profit after tax to account for a small proportion of net revenue.
Return on total assets: In 2018, every 100 VND of assets generated 8.01 VND of net profit, an increase of 0.26% compared to 2017. Looking at the balance sheet, we see that the company's total assets increased by 5.21% while after-tax profit increased by 15.04%, which led to a sharp increase in the return on total assets in 2018 compared to 2017. By 2019, every 100 VND of assets generated 8.07 VND of net profit, an increase of 0.06% compared to 2018. It can be seen that in 2019, the company's asset utilization efficiency was high, showing that the company used its assets reasonably.
Return on equity: In 2017, every 100 VND of equity generated 12.63 VND of profit, in 2018, every 100 VND of equity generated 12.92 VND of profit, in 2019, every 100 VND of equity generated 12.01 VND of profit. In 2018, the return on equity increased by 0.29% compared to 2017, the reason for this increase was that in 2018, the growth rate of equity was lower than the growth rate of profit after tax. By 2019, the return on equity compared to 2018 decreased by 0.91%. Although there was a slight decrease, the company's return on equity was still high, showing that the company's efficiency in using equity was good.
2.2.4.5. Analyze financial ratios through Dupont diagram
* ROA Analysis
ROA =
LNST =
Total assets
LNST
Revenue
Revenue Total assets
ROA 2017 = 3.45% × 2.25 = 7.76%
ROA 2018 = 3.41% × 1.18 = 7.94%
ROA 2019 = 3.51% × 2.30 = 8.07%
Asset turnover increased, specifically: every 1 VND invested in total assets will generate after-tax profit of 0.0776 VND in 2017; 0.0794 VND in 2018 and 0.0807 VND in 2019. Thus, the company has effectively used its existing total assets in production and business activities.
In 2017, for every 1 dong invested in company assets, the company will receive 0.0776 dong in after-tax profit due to two influencing factors:
- 1 dong of net revenue generates 3.45 dong of profit after tax.
- 1 dong of business capital put into production and business creates 2.25 dong of net revenue.
In 2018, for every VND of capital invested in the company's assets, the company will receive VND 0.0794 in profit after tax, due to two influencing factors:
- 1 dong of net revenue generates 3.41 dong of profit after tax.
- 1 dong of business capital put into production and business creates 1.18 dong of net revenue.
In 2019, for every VND of capital invested in the company's assets, the company will earn VND 0.0787 in profit after tax, due to two influencing factors:
- 1 VND of net revenue generates 3.51 VND of profit after tax.
- 1 dong of business capital put into production and business creates 2.30 dong of net revenue.
Thus, there are two ways to increase ROA: increase the profit margin on net sales (ROS) or increase working capital turnover.
+ Increase ROS by saving costs
+ Increase business capital turnover by increasing revenue and reducing selling prices and enhancing sales promotion activities
* ROE Analysis
ROE = ROA
Total assets
Equity
ROE 2017 = 7.76% 1.63 = 12.65%
ROE 2018 = 7.94% × 1.61 = 12.81%
ROE 2019 = 8.07% × 1.61 = 12.99%
We see that in 2017, for every VND of equity invested in production and business activities, it generated VND 0.1265 in profit after tax, in 2018 it was VND 0.1281 in profit after tax, in 2019 it was VND 0.1299 in profit after tax. Thus, the return on equity increased over the years, due to the influence of two factors: the profit margin on revenue and the equity utilization ratio.
There are two ways to increase ROE: increase ROA or increase the total assets/equity ratio.
- Increase ROA as analyzed above.
- Increase the total assets/equity ratio by reducing equity and increasing debt. We see that the higher the debt ratio, the higher the return on equity. However, when the debt ratio increases, the risk will increase, so businesses will have to be very careful when using debt.
PART 3: SOME SOLUTIONS TO IMPROVE THE FINANCIAL SITUATION AT VIPCO PETROLEUM TRANSPORT JOINT STOCK COMPANY
3.1. General assessment of the financial situation at Vipco Petroleum Transport Joint Stock Company
3.1.1. Advantages
After analyzing the indicators in the previous section, we can see the financial situation of Vipco Petroleum Transport Joint Stock Company as follows:
- The company's revenue has increased significantly over the years at a rate faster than the increase in cost of goods sold, which has led to a significant increase in profits. This is a good sign that the company's production cost management is effective.
- The company has purchased more machinery and equipment, innovated technology, and served business operations more effectively.
- The company has properly implemented the accounting regime prescribed by the Ministry of Finance, promptly supplementing and supplementing according to new circulars and accounting laws.
- Fulfill obligations to pay budget and financial and tax regulations of the State.
3.1.2. Disadvantages
But besides that, the company also faces many common difficulties due to the impact of the macro environment and other factors of the industry. The disadvantages that the company faces are:
- Short-term receivables always account for a high proportion of the company's total assets. This negatively affects the company's production and business activities as well as investment opportunities.
- Accounts payable to suppliers always accounts for a high proportion and tends to increase over three years.
- Ineffective investment in machinery and equipment has not been able to meet all new orders and demands.
3.1.3. Causes leading to such financial situation